Article

Byproduct Cross Feeding and Community Stability in an In Silico Biofilm Model of the Gut Microbiome

Department of Chemical Engineering and Institute of Applied Life Science, University of Massachusetts, Amherst, MA 01003, USA
*
Author to whom correspondence should be addressed.
Processes 2017, 5(1), 13; https://doi.org/10.3390/pr5010013
Submission received: 6 February 2017 / Revised: 13 March 2017 / Accepted: 15 March 2017 / Published: 18 March 2017

Abstract

:
The gut microbiome is a highly complex microbial community that strongly impacts human health and disease. The two dominant phyla in healthy humans are Bacteroidetes and Firmicutes, with minor phyla such as Proteobacteria having elevated abundances in various disease states. While the gut microbiome has been widely studied, relatively little is known about the role of interspecies interactions in promoting microbiome stability and function. We developed a biofilm metabolic model of a very simple gut microbiome community consisting of a representative bacteroidete (Bacteroides thetaiotaomicron), firmicute (Faecalibacterium prausnitzii) and proteobacterium (Escherichia coli) to investigate the putative role of metabolic byproduct cross feeding between species on community stability, robustness and flexibility. The model predicted coexistence of the three species only if four essential cross-feeding relationships were present. We found that cross feeding allowed coexistence to be robustly maintained for large variations in biofilm thickness and nutrient levels. However, the model predicted that community composition and short chain fatty acid levels could be strongly affected only over small ranges of byproduct uptake rates, indicating a possible lack of flexibility in our cross-feeding mechanism. Our model predictions provide new insights into the impact of byproduct cross feeding and yield experimentally testable hypotheses about gut microbiome community stability.

1. Introduction

Natural microbial communities typically form biofilms in which different species compete for and efficiently utilize available nutrients [1,2,3,4,5]. The presence of spatial heterogeneity within biofilms plays an essential role in the evolution and function of microbial species [2,6,7,8,9] and has profound effects on biofilm formation and development [5,10,11,12]. Concentration gradients in key nutrients due to limited diffusion can establish metabolic niches within the biofilm which produce spatial variations in biomass density [13] and partitioning of species [14]. With their inherent chemical gradients, biofilms can provide niches for both fast and slow growing organisms, a design feature thought to be critical to the stability of naturally occurring systems. Microbes residing in multispecies biofilms exhibit phenotypes distinct from planktonic growth. For instance, these immobilized bacteria can tolerate antimicrobial agent concentrations 10,000-fold higher than the same microbes grown planktonically [15,16]. Biofilm communities are often compared to tissues found in higher eukaryotic organisms based on the large number of cell types involved, the complex interactions between cells, the ability of cells to self-organize into three-dimensional structures and the emergent properties of the integrated systems.
Natural communities have evolved to exploit the native metabolic capabilities of each species and are highly adaptive to changes in their environments. Adaption is achieved through a variety of mechanisms, including cross feeding of metabolites synthesized by one species to support the growth of another species [17,18,19,20]. These cross-feeding relationships are a result of metabolic specialization and establish a food web within the community that maximizes utilization of available resources. When combined with the biofilm mode of growth and associated diffusional limitations, cross feeding establishes local metabolic niches that allow otherwise slower growing species to coexist with faster growing species and is hypothesized to stabilize the community against environmental perturbations [21,22,23,24]. The spatial partitioning of metabolism and physical immobilization by secreted polymers make biofilm cultures distinct from planktonic cultures grown in well-mixed environments where coexistence is not possible unless the species have the same growth rate.
The Human Microbiome Project was launched in 2008 with the goal of developing improved understanding of the human microbiome and its role in human health and disease [25]. To date, the most widely studied system is the gut microbiome due to its critical role in food metabolism [26,27,28], profound influence on the immune system [29,30] and suspected role in a wide variety of diseases including gut infections [31], inflammatory bowel and Crohn’s diseases [32,33], obesity [34], diabetes [35], cardiovascular disease [36], rheumatoid arthritis [37], colorectal cancer [38] and even depression [39]. The human gut microbiome is a highly complex multispecies system thought to consist of at approximately 1800 genera and 15,000–36,000 species of microbes [40]. The two dominant phyla in healthy humans are Firmicutes and Bacteroidetes, which comprise more than 90% of the community. Other important but much less prevalent phyla are Proteobacteria, Actinobacteria, Euryarchaeota and Verrucomicrobia as well as Eukaryota such as fungi. A critical metabolic function of the gut microbiota is to convert dietary fiber into short-chain fatty acids (SCFAs) that can be absorbed by the host intestine as an energy source. The key SFCAs acetate, propionate and butyrate are commonly present in an approximate 60:20:20 molar ratio [41].
Gut microbiome function is usually robust to dietary changes and other perturbations that alter species composition and SCFA synthesis. Correspondingly, metagenomic studies have shown wide variations in microbiota diversity and composition within healthy human populations [42]. However, large perturbations in susceptible individuals can result in long-term microbiome alteration. Many diseases are associated with the gut flora being perturbed from their normal state through a poorly understood process known as dysbiosis [26,43]. For example, Clostridium difficile infections are often attributed to the use of broad spectrum antibiotics that inadvertently alter microbiota diversity and species composition, thereby reducing colonization resistance to pathogen invasion [44,45]. The role of species interactions in maintaining healthy community function or promoting dysbiosis are poorly understood. Despite some recent progress [46,47,48], the types of species interactions required for stable community dynamics in biofilm communities where nutrient gradients provide niches for different metabolic lifestyles have not been elucidated.
While foundational to the vast majority of microbial life on the planet, the basic design principles of cross-feeding microbial biofilms remain poorly understood due largely to the complexity of naturally occurring systems [1,5]. Synthetic microbial communities comprised of a smaller number of well characterized and genetically manipulable organisms are tractable alternatives to natural systems [49,50,51]. In principle, these synthetic communities can be designed to capture the most salient features of the corresponding natural communities while offering the capability to manipulate individual species metabolism and cross-feeding interactions. However, few comprehensive studies of metabolite cross feeding in synthetic biofilm communities are available in the literature [50,52]. Quantitative understanding of the relationships between metabolite cross feeding, spatial arrangement, metabolic rates and community metabolism is critical to systematically analyze and rationally manipulate biofilm communities associated with the human gut and other microbiomes.
In this study, we developed a biofilm metabolic model of a very simple bacterial community consisting of a representative bacteroidete (Bacteroides thetaiotaomicron), firmicute (Faecalibacterium prausnitzii) and proteobacterium (Escherichia coli) as an in silico surrogate for the human gut microbiome. The model was used to investigate differences between single and multispecies biofilms, to discover putative cross-feeding relationships between biofilm species, to determine which cross-feeding relationships were essential for species coexistence, to examine robustness of the cross-feeding community to biofilm and environmental perturbations and to explore the flexibility of the cross-feeding strategy with respect to SCFA synthesis. The model generated new and experimentally testable hypotheses about the role of byproduct cross feeding in the stability and function of the human gut microbiome.

2. Results

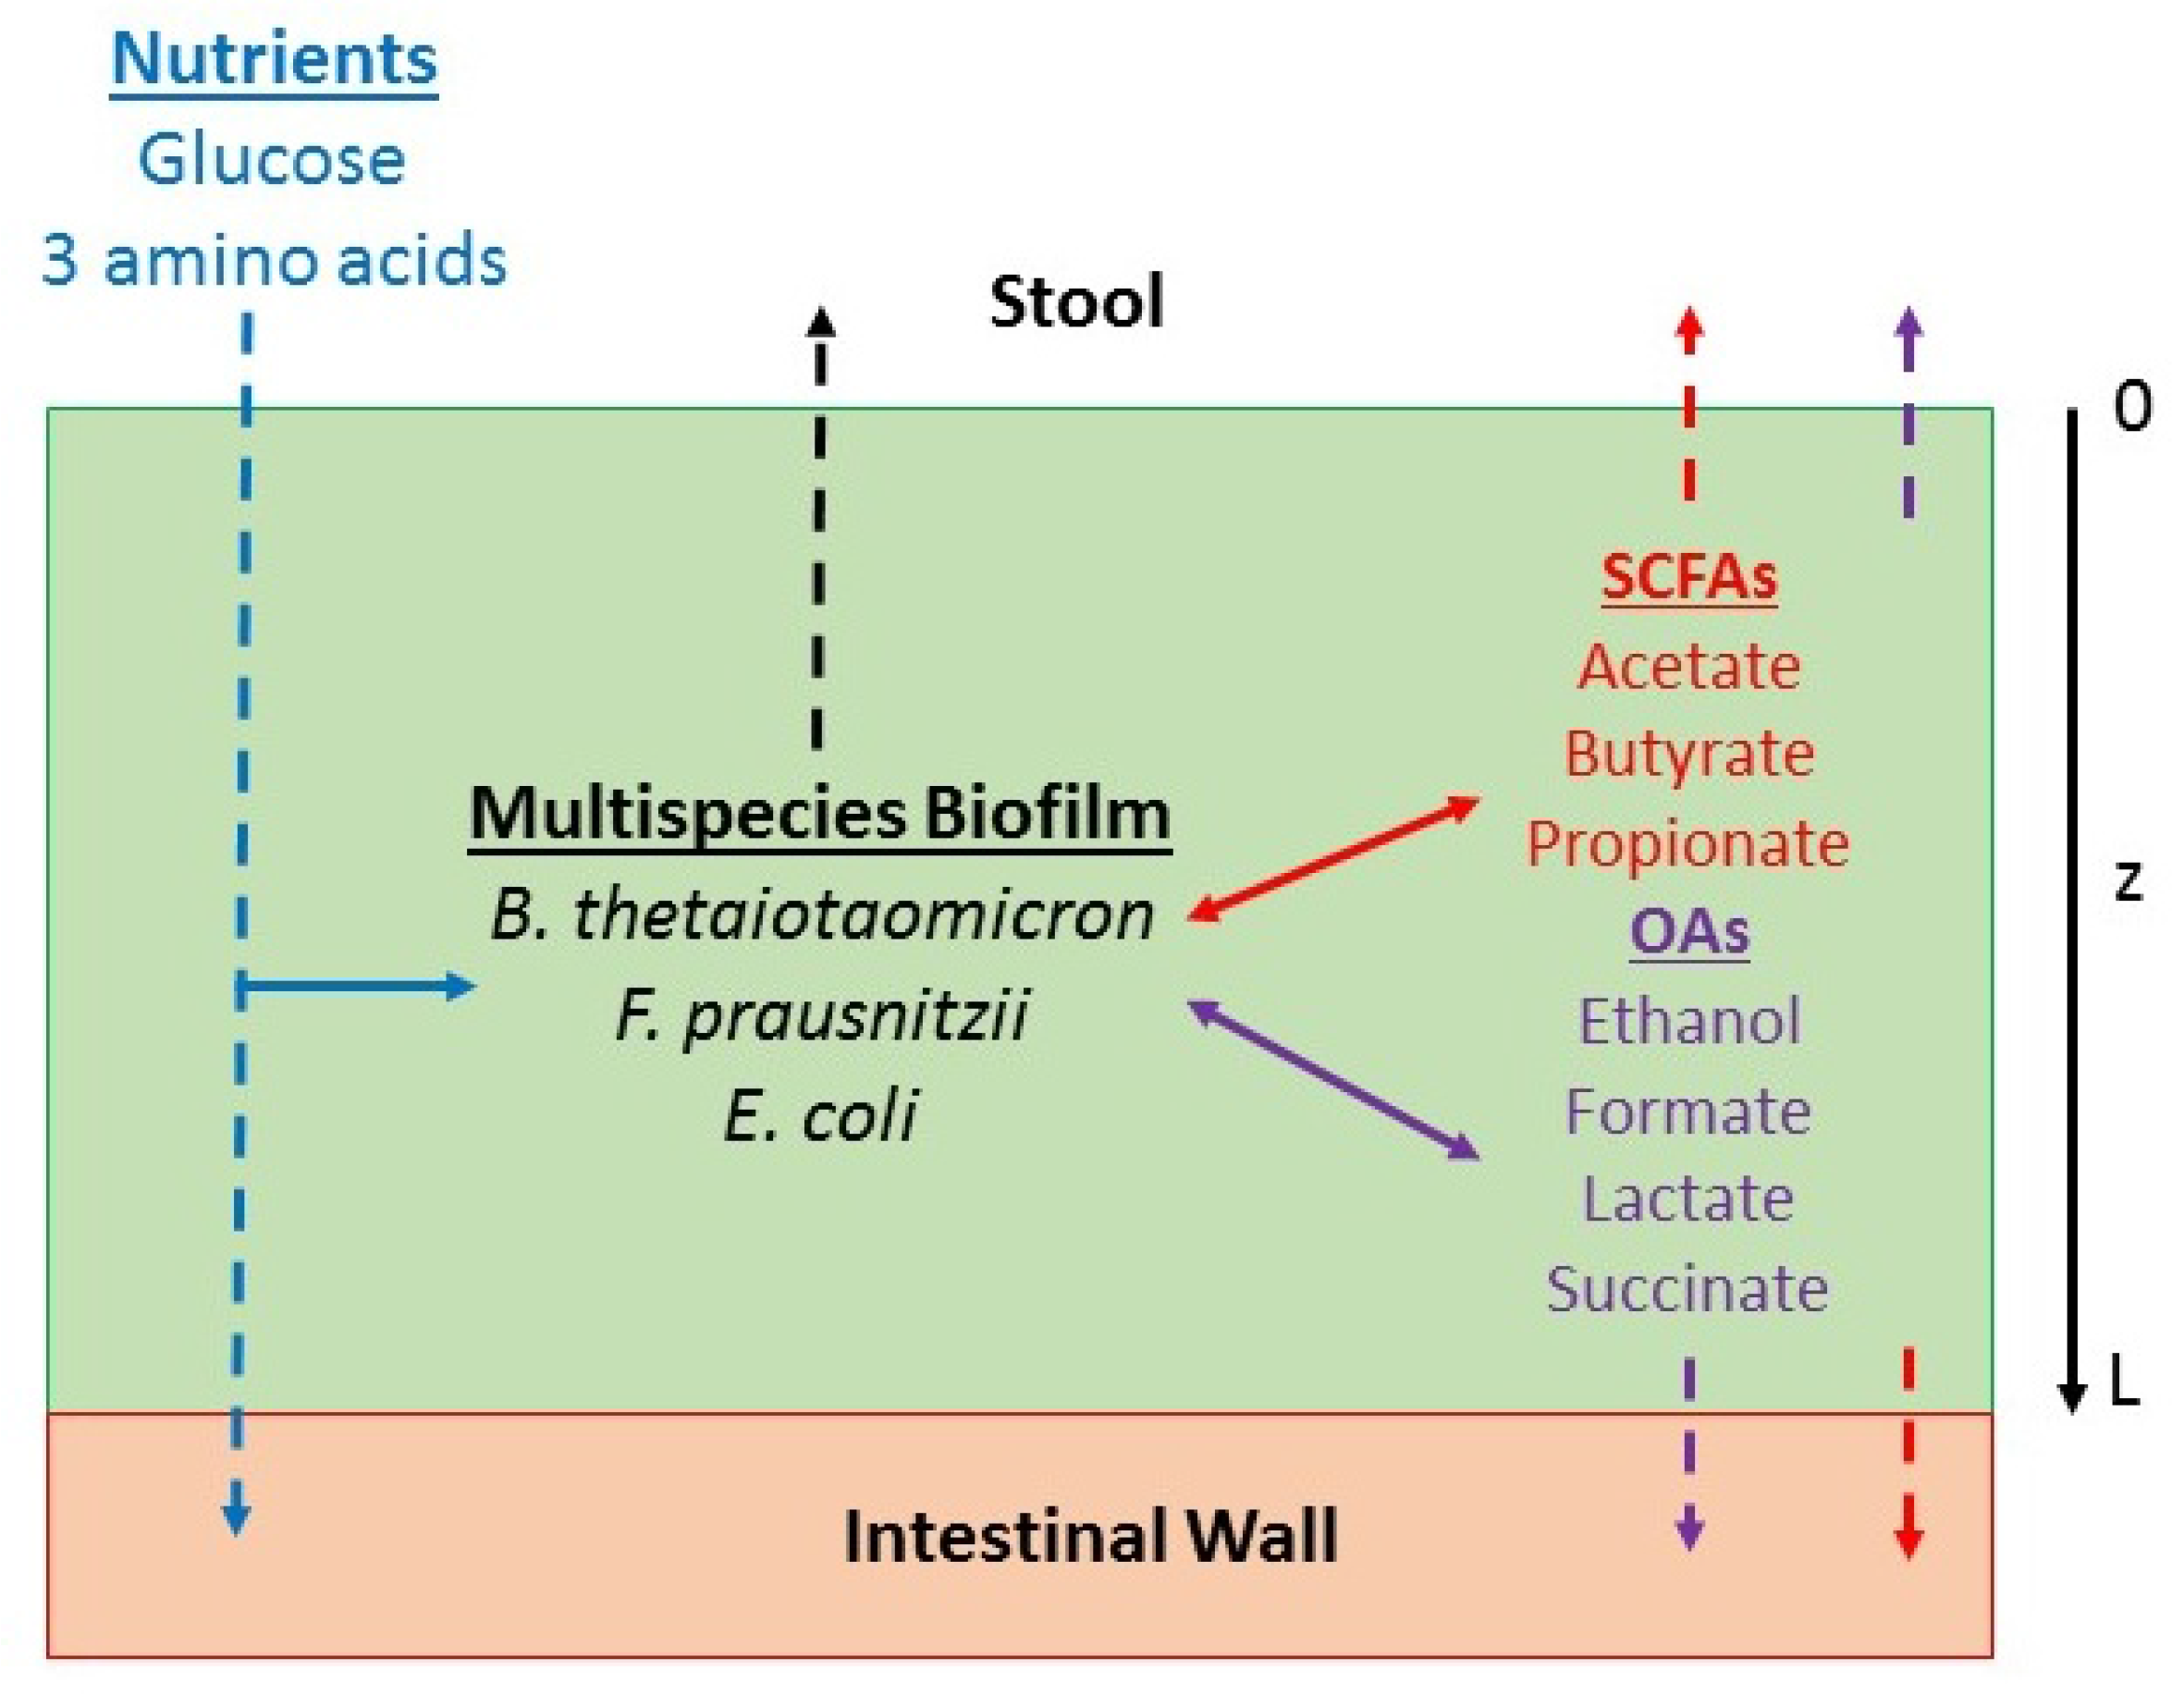
2.1. Metabolic Analysis of Single Species Biofilms

We first performed flux balance analysis (FBA) with the genome-scale metabolic reconstruction of each species to determine the secreted byproducts to be included in biofilm metabolic models. Nutrient uptake rates were specified as 10 mmol/gDW/h for glucose and 1 mmol/gDW/h for the three amino acids (methionine, serine, tryptophan) essential for F. prausnitzii in silico growth. The FBA results for planktonic growth can be qualitatively summarized as follows (Figure 1):
  • B. thetaiotaomicron: high fluxes of acetate and CO2 and a low flux of propionate
  • F. prausnitzii: high fluxes of butyrate, CO2, formate and lactate
  • E. coli: high fluxes of acetate, ethanol and formate and a very low flux of succinate
These secreted byproducts were included as extracellular metabolites in single species biofilms to further characterize byproducts possibly cross fed in the three species biofilm community. Single species biofilm simulations were performed assuming a fixed biofilm thickness of 40 μm, bulk nutrient concentrations of 5 mmol/L glucose and 0.5 mmol/L each amino acid, and initial conditions corresponding to a spatially uniform biomass concentration of 10 g/L. Due to the lack of available data on species-specific uptake kinetics for glucose and the three amino acids, each species was assigned the same uptake parameters (see Materials and Methods). Dynamic simulations were run for 300 h to ensure that a steady-state solution was obtained for each species.
Figure 2 shows steady-state spatial profiles of the biomass concentration, growth rates, nutrient concentrations and byproduct concentrations for each single species biofilm. B. thetaiotaomicron produced the highest biomass concentration throughout the biofilm due to its relatively high growth rate in the nutrient rich region near the biofilm–stool interface (z = 0 μm). The biomass concentration exhibited a strong spatial dependence due to biomass removal by erosion at the same interface. The nutrient concentrations also showed spatial variations due to cellular consumption and diffusion limited transport through the biofilm. The primary metabolic byproducts of B. thetaiotaomicron were predicted to be acetate and succinate with propionate produced at relatively low levels. The CO2 synthesized planktonically was replaced by succinate in the biofilm environment. Byproduct concentrations were almost constant throughout the biofilm due to diffusion and removal at the two boundaries. The second fastest growing species E. coli produced acetate, ethanol and formate as primary byproducts and succinate as a very minor byproduct. F. prausnitzii produced the least biomass despite having the highest growth rate in the nutrient lean region near the colon–biofilm interface (z = 40 μm). The primary metabolic byproducts of F. prausnitzii were butyrate, CO2, formate and lactate, as predicted planktonically.

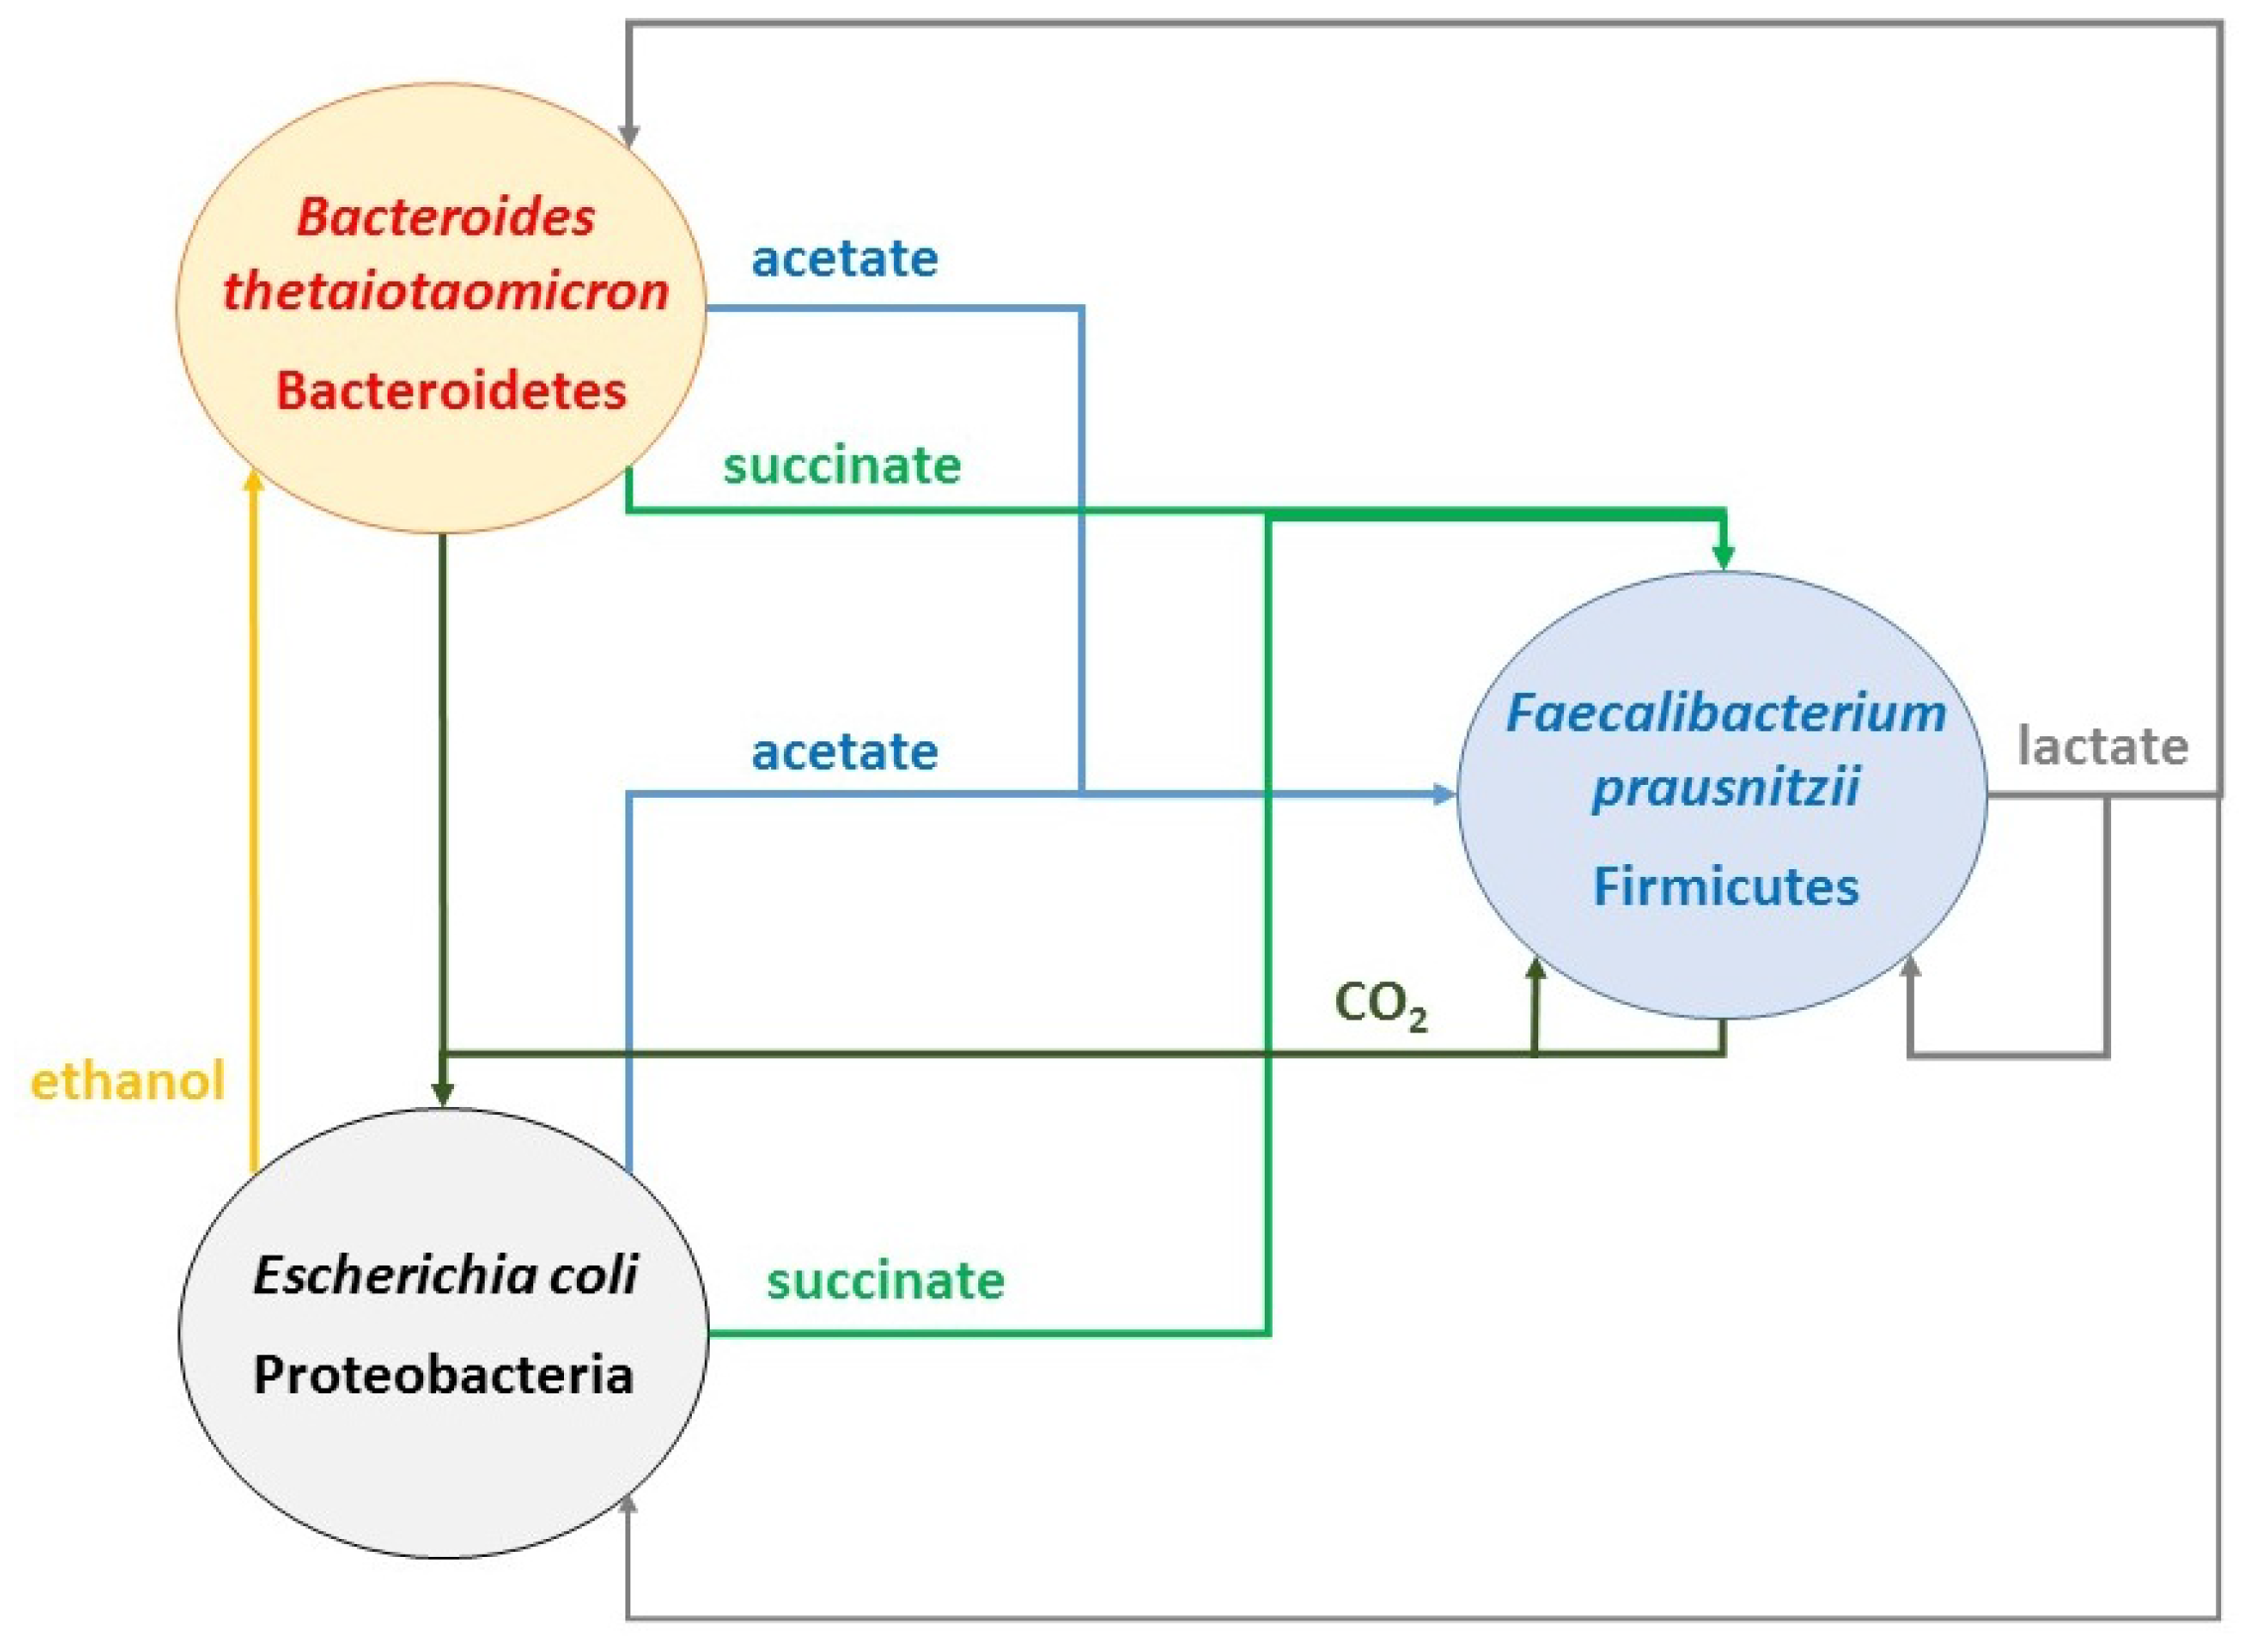
2.2. Predicting Cross-Feeding Relationships in the Multispecies Biofilm

A biofilm metabolic model was constructed for the three species community comprised of B. thetaiotaomicron, F. prausnitzii and E. coli. Initial simulations were aimed at discovering putative cross-feeding relationships without any a priori assumptions concerning the nature of these relationships. Therefore, we allowed each species to uptake any available byproduct (acetate, butyrate, CO2, ethanol, formate, lactate, propionate, succinate) to increase its local growth rate in the biofilm. Butyrate uptake was excluded for B. thetaiotaomicron and ethanol and propionate uptakes were excluded from F. prausnitzii because these models lacked the necessary exchange fluxes. Due to the lack of data on species-specific uptake kinetics for the eight byproducts, each species was assigned the same uptake parameters (see Materials and Methods). As with the single species, the multispecies biofilm simulations were performed with a fixed thickness of 40 μm and bulk nutrient concentrations of 5 mmol/L glucose and 0.5 mmol/L each amino acid. The initial conditions corresponded to spatially uniform biomass concentrations of 10 g/L for each species.
Initial simulations showed that B. thetaiotaomicron failed to synthesize propionate in the multispecies biofilm despite producing this SCFA as an isolated species (see Figure 2). Because the B. thetaiotaomicron reconstruction predicted synthesis of succinate rather than propionate for sufficiently large CO2 uptake rates, we excluded CO2 uptake for B. thetaiotaomicron to favor propionate synthesis. Figure 3A shows time profiles of the biomass, nutrient and byproduct concentrations in the middle of the biofilm (z = 20 μm) over the first 200 h of simulation. Corresponding profiles of the species growth, uptake and secretion rates are shown in Figure 3B. Interestingly, F. prausnitzii produced substantially more biomass than E. coli at the low nutritional conditions that quickly developed in the biofilm interior. Butyrate, CO2 and formate were predicted to be present at high concentrations, while the remaining five byproducts were synthesized at much lower levels.
Predicted cross-feeding relationships were identified from the byproduct secretion and uptake fluxes in Figure 3B. The following relationships were observed:
  • Acetate: produced by B. thetaiotaomicron and E. coli; consumed by F. prausnitzii
  • CO2: produced by F. prausnitzii and B. thetaiotaomicron; consumed by E. coli and F. prausnitzii
  • Ethanol: produced by E. coli; consumed by B. thetaiotaomicron
  • Formate: produced by E. coli and F. prausnitzii; consumed by F. prausnitzii
  • Lactate: produced by F. prausnitzii; consumed by B. thetaiotaomicron and E. coli
  • Succinate: produced by B. thetaiotaomicron and E. coli; consumed by E. coli
Based on the flux patterns in Figure 3B, some of these cross-feeding relationships appeared to be more important than others. The acetate, ethanol and succinate cross-feeding relationships were characterized by relatively large, sustained exchange fluxes. By contrast, lactate cross-feeding fluxes were relatively large only over the first 20 h. The CO2 uptake fluxes were small but sustained over the entire simulation. Formate uptake by F. prausnitzii was small and occurred only for the first 10 h. The cross-feeding patterns between the three species are summarized in Figure 4 with putative formate cross feeding neglected due to its presumed insignificance.

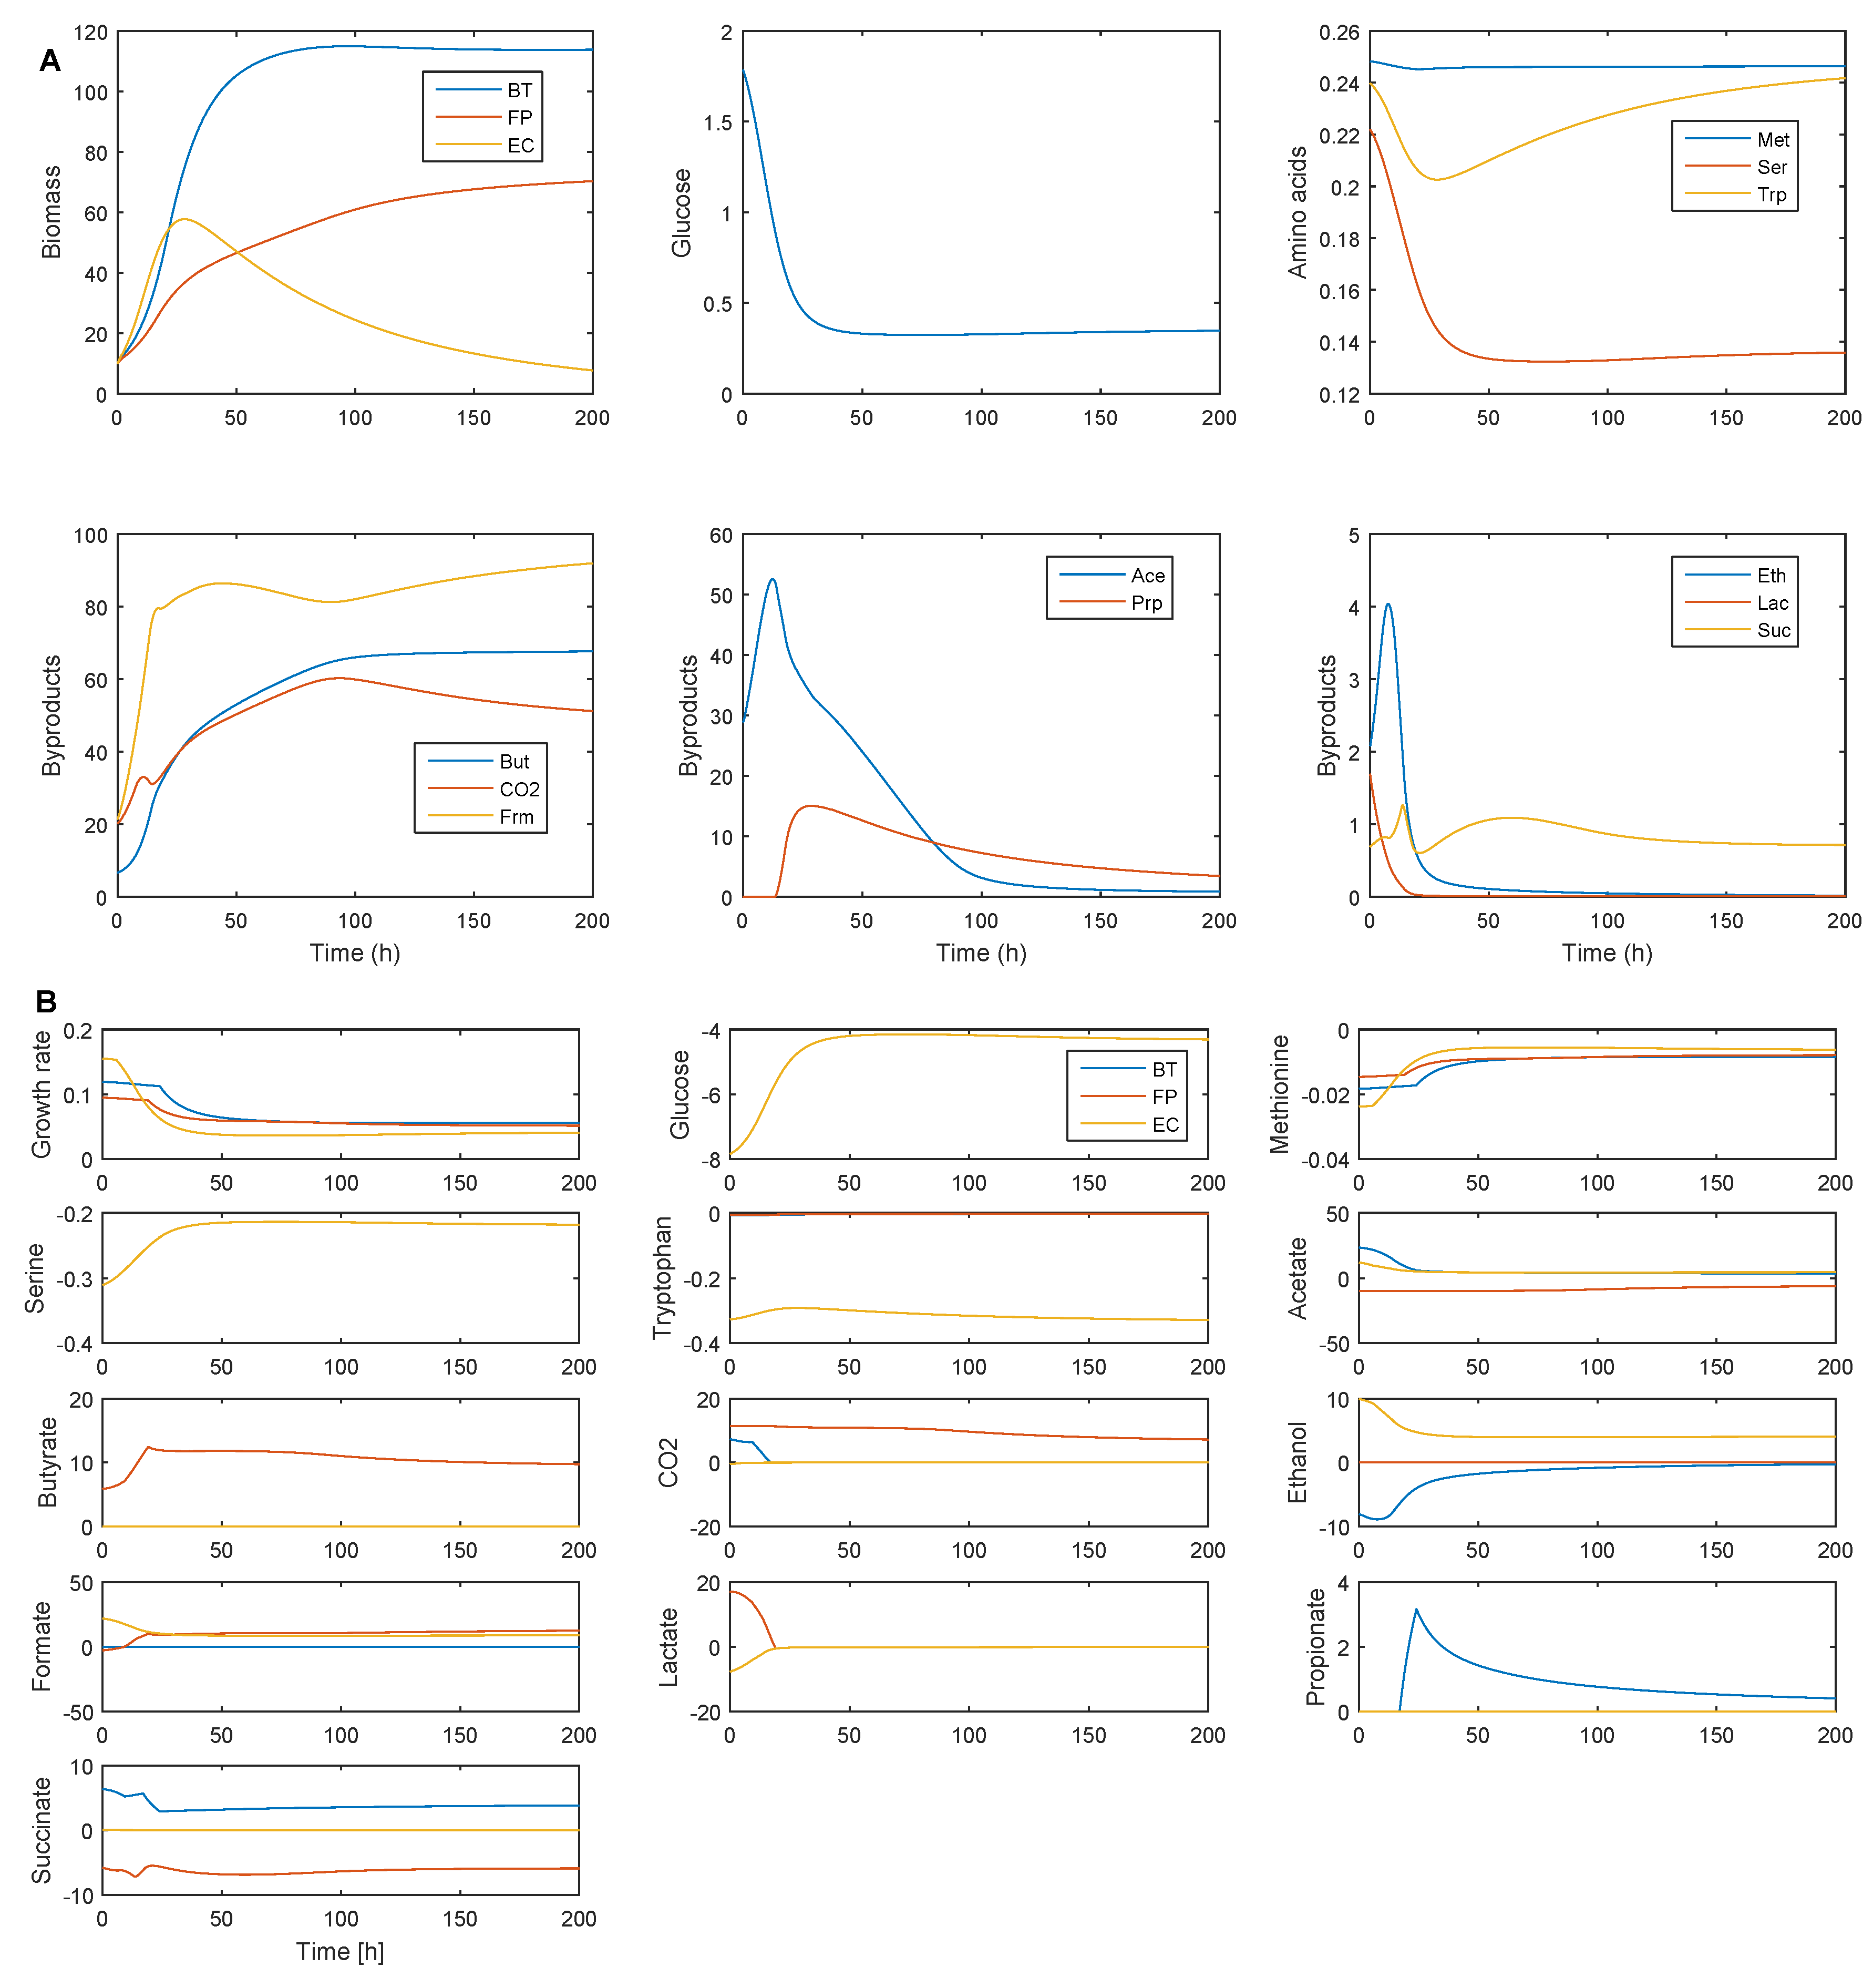
2.3. Establishing Species Coexistence in the Multispecies Biofilm

The previous dynamic simulation was performed over a short time horizon of 200 h that was insufficient to determine if the three species would coexist over long time periods as would be required for proper microbiome function. Therefore, we repeated the multispecies simulation over a much longer time horizon of 10,000 h to determine if the three species community was stable. While B. thetaiotaomicron and F. prausnitzii were able to coexist, E. coli was eliminated because its biomass generation through growth was exceeded by its biomass removal at the biofilm–stool boundary due to erosion. To achieve coexistence of the three species, the ATP maintenance value in the E. coli reconstruction was decreased from the nominal value of 8.43 to 6.75 mmol ATP/gDW/h. We justified this modification by noting that the actual gut environment is considerably more complex than reflected in our model and that the presence of unmodeled nutrients could enhance E. coli growth relative to the other two species. The new ATP maintenance value of 6.75 mmol ATP/gDW/h was chosen such that the E. coli abundance averaged across the biofilm was within the range reported for healthy gut microbiomes, as discussed below.
Figure 5A shows steady-state concentration profiles for the three species and their byproducts. Corresponding profiles of the species growth rates and the byproduct uptake and secretion rates are shown in Figure 5B. The reduced E. coli ATP maintenance value allowed all three species to stably coexist. When averaged across the biofilm, the model predicted a total biomass concentration of 182 g/L comprised of 53.9% B. thetaiotaomicron, 32.8% F. prausnitzii and 13.3% E. coli. These values are within the large range of biomass concentrations reported for other types of bacterial biofilms [13] and the ratio of Bacteroidetes–Firmicutes–Proteobacteria reported for healthy gut microbiomes [53]. The model achieved coexistence by a careful balance of species growth rates across the biofilm. B. thetaiotaomicron was predicted to have the highest growth rates in the nutrient rich region near the biofilm–stool interface, while F. prausnitzii growth was favored in the nutrient lean region near the colon–biofilm interface. Unlike the other two species, E. coli was not predicted to establish a particular spatial niche that favored its metabolism but rather produced sufficiently large growth rates over the entire biofilm to remain competitive.
The byproduct cross-feeding relationships depicted in Figure 4 also were observed in the stable community. As before, the most important relationships appeared to be: (1) F. prausnitzii consumption of acetate and succinate produced by B. thetaiotaomicron and E. coli; and (2) B. thetaiotaomicron consumption of ethanol produced by E. coli. Cross feeding of CO2, formate and lactate appeared to be less important based on the small uptake rates of these byproducts. As expected, cross feeding of butyrate and propionate were not predicted. The model predicted a spatially averaged SCFA concentration of 75 mmol/L comprised of 2% acetate, 10% propionate and 89% butyrate, which was much less acetate, much more butyrate and less propionate than commonly reported in experimental studies [54]. Because B. thetaiotaomicron synthesizes both acetate and propionate and F. prausnitzii converts acetate to butyrate, these results suggest that the ratio of the B. thetaiotaomicron and F. prausnitzii was too low or that the SCFA synthesis rates were not properly balanced. While the ATP maintenance value of each species could have been adjusted to alter the SCFA composition, we left these values unchanged since this study was focused on community stability not SCFA synthesis.
The previous simulations demonstrated that the three species cross-feeding community was stable over long time periods with steady-state species compositions within experimentally determined ranges for healthy gut microbiomes. When cross feeding was eliminated by removing all byproduct uptakes from the model, the steady state consisted of just E. coli (Figure S1). This result demonstrated that byproduct cross feeding was necessary as well as sufficient for community stability. Furthermore, biofilm simulations performed for all three possible combinations of two species predicted that the B. thetaiotaomicronF. prausnitzii and B. thetaiotaomicronE. coli combinations would result in species coexistence (Figure S2). By contrast, F. prausnitzii was unable to compete with E. coli, demonstrating that B. thetaiotaomicron was necessary for F. prausnitzii to coexist in the presence of E. coli.

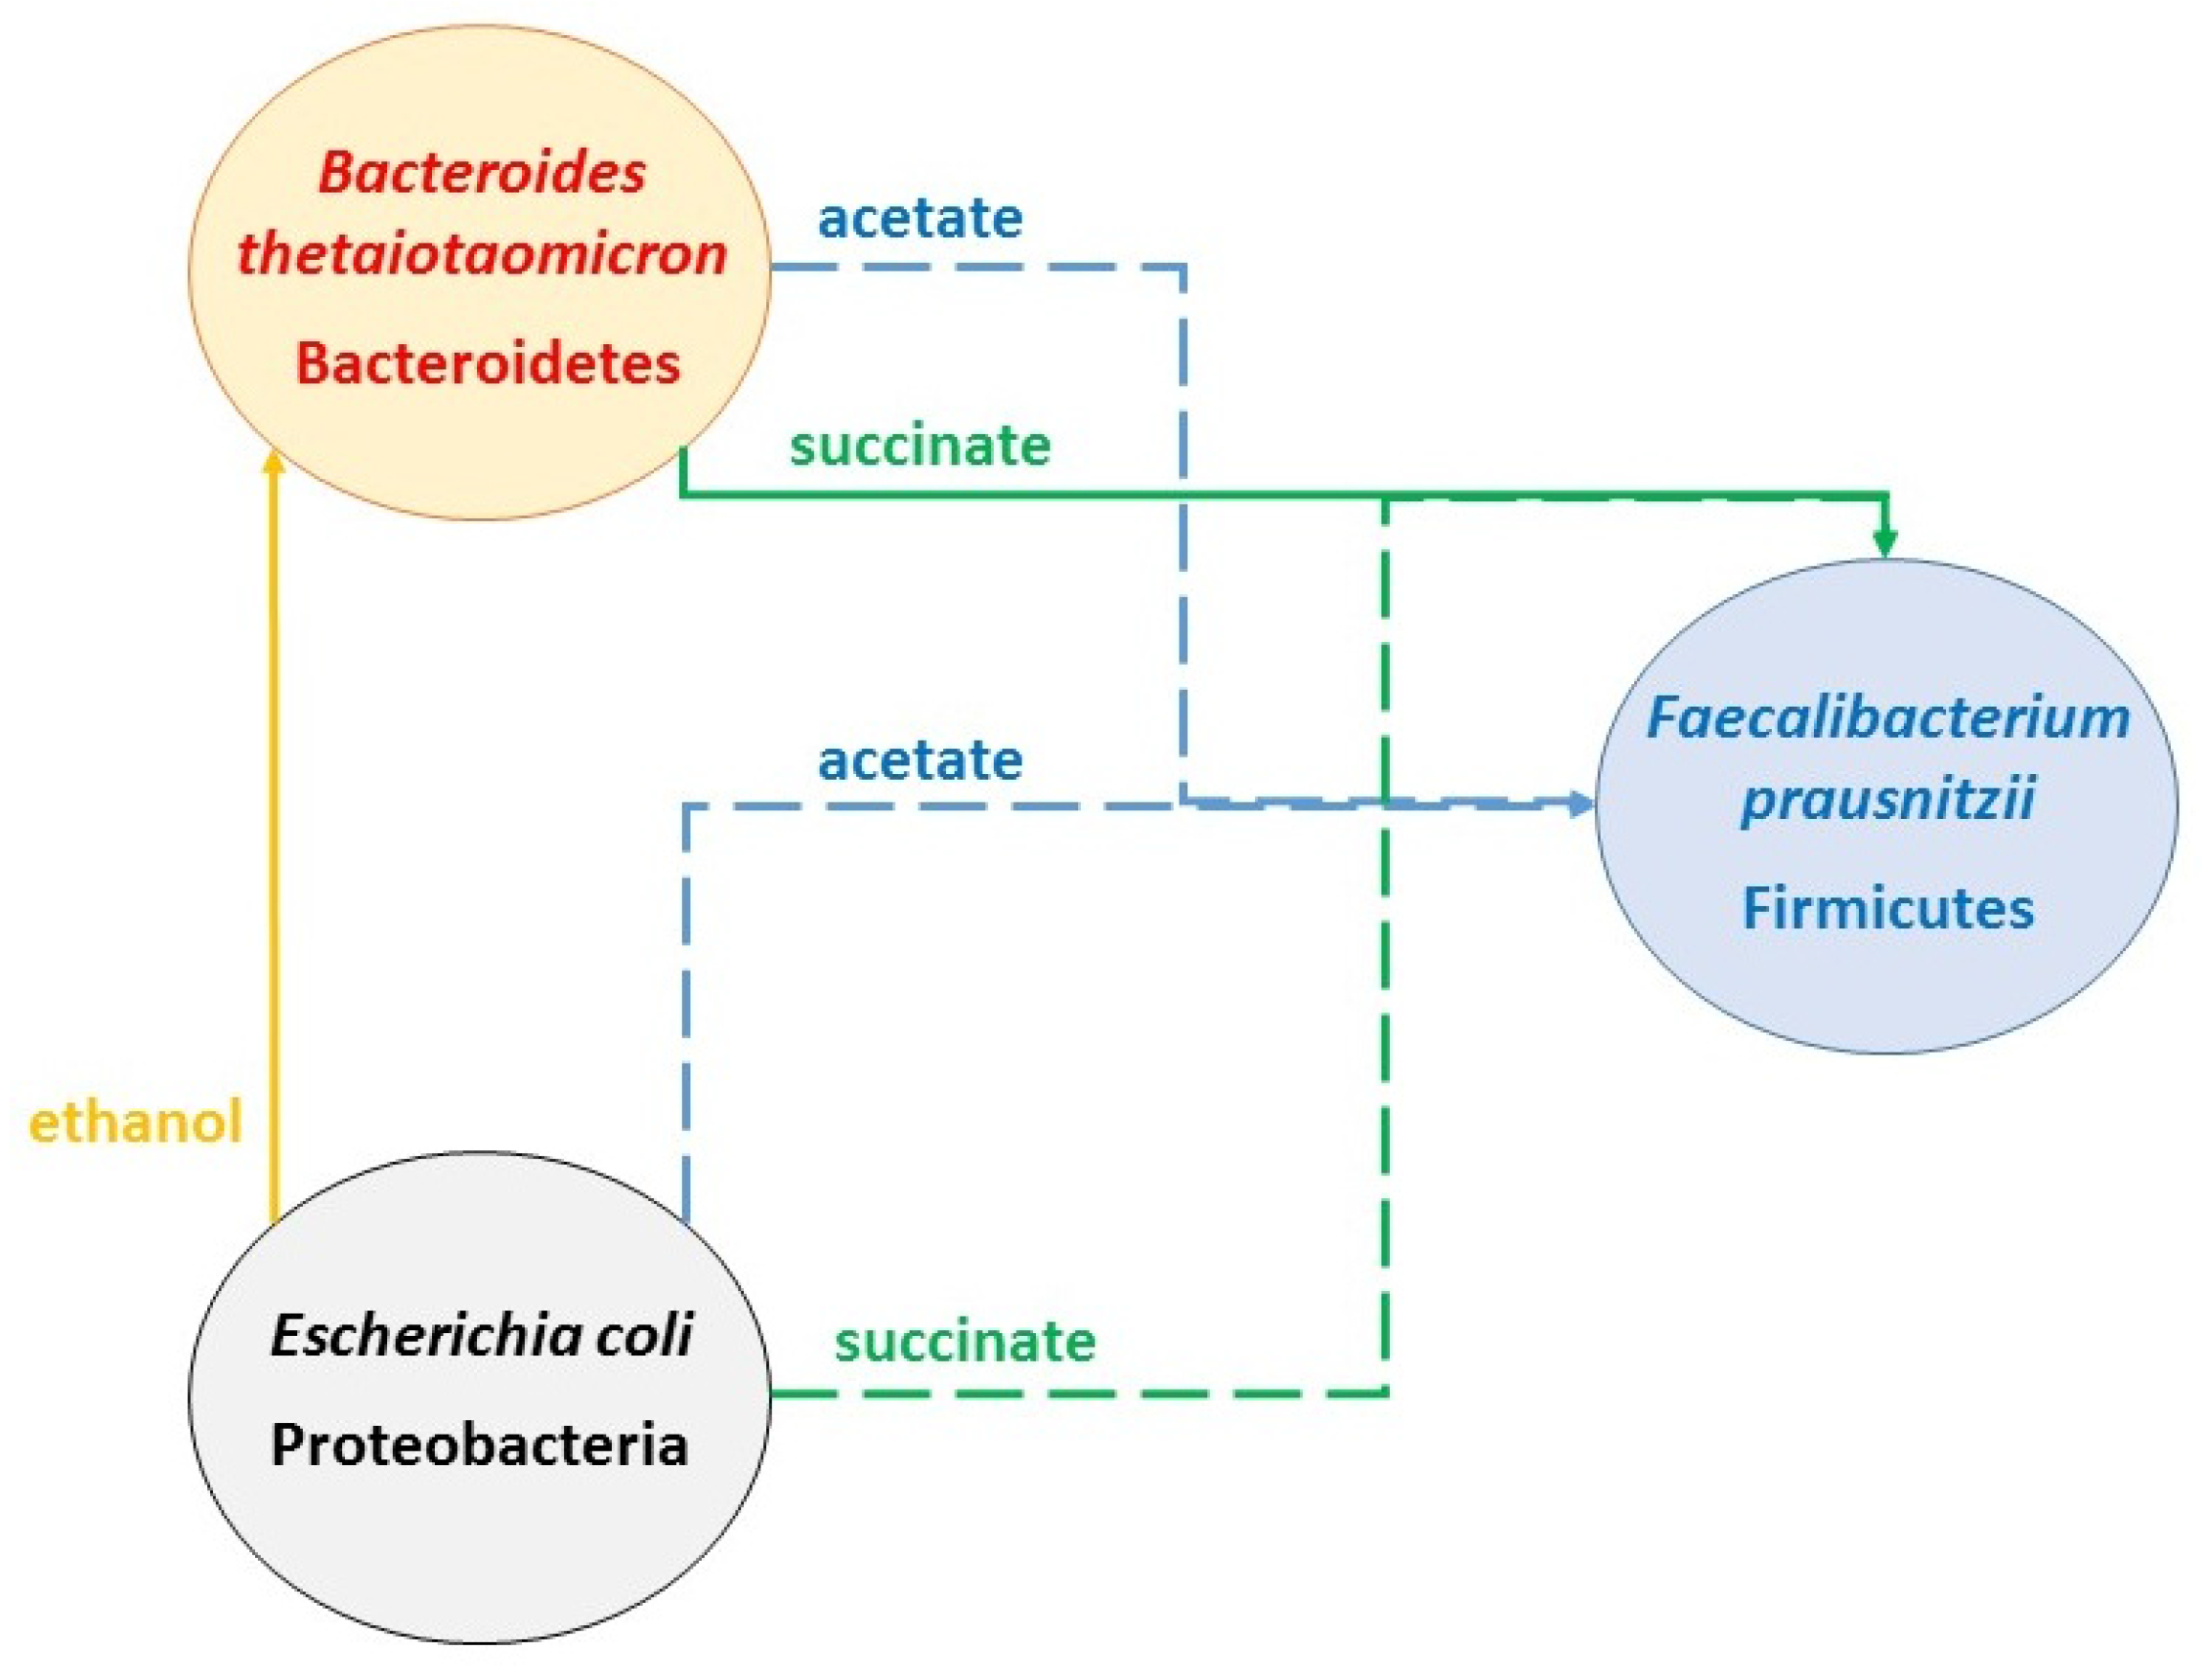
2.4. Identifying Cross-Feeding Relationships Essential for Community Stability

Given that byproduct cross feeding was required for community stability in both two species and three species biofilms, we sought to determine which specific cross-feeding relationships were required for species coexistence. Based on the relatively large magnitudes of the associated uptake fluxes, we hypothesized that acetate, ethanol and succinate cross feeding were sufficient for community stability while CO2, formate and lactate cross feeding were unnecessary. This hypothesis was tested by eliminating all byproducts uptakes in the three species community except acetate and succinate by F. prausnitzii and ethanol by B. thetaiotaomicron. We found that the community was stable with almost the same average species abundances as predicted when all cross-feeding relationships were allowed: 53.8% B. thetaiotaomicron, 32.6% F. prausnitzii and 13.6% E. coli. These results were attributed to the species growth rate profiles being virtually unchanged when CO2, formate and lactate cross feeding were eliminated.
We performed additional simulations to better understand the impact of acetate, ethanol and succinate cross feeding on community stability and species abundances. The following cross-feeding scenarios were investigated:
  • Nominal case: acetate and succinate produced by B. thetaiotaomicron and E. coli consumed by F. prausnitzii; ethanol produced by E. coli consumed by B. thetaiotaomicron
  • Nominal case without acetate consumption by F. prausnitzii
  • Nominal case without succinate consumption by F. prausnitzii
  • Nominal case without ethanol consumption by B. thetaiotaomicron
  • Nominal case without F. prausnitzii consumption of acetate produced by B. thetaiotaomicron
  • Nominal case without F. prausnitzii consumption of succinate produced by B. thetaiotaomicron
  • Nominal case without F. prausnitzii consumption of acetate produced by E. coli
  • Nominal case without F. prausnitzii consumption of succinate produced by E. coli
  • No cross feeding
These nine cross-feeding scenarios produced six distinct biofilm behaviors as shown in Figure 6. The nominal case with acetate, ethanol and succinate cross feeding resulted in coexistence of the three species (first row). The same solution was predicted when F. prausnitzii was not allowed to consume succinate produced by E. coli, demonstrating that this specific cross-feeding relationship was unimportant. When acetate consumption by F. prausnitzii was removed, F. prausnitzii was eliminated due to its substantially reduced growth rate (second row). The same solution was obtained either when F. prausnitzii was not allowed to consume any succinate or when F. prausnitzii was not allowed to consume just succinate produced by B. thetaiotaomicron. These results demonstrated that F. prausnitzii consumption of acetate and of B. thetaiotaomicron derived succinate were essential for community stability.
B. thetaiotaomicron was completely eliminated and F. prausnitzii was almost entirely eliminated when ethanol consumption by B. thetaiotaomicron was removed (third row). This cascade effect was initiated by reduced B. thetaiotaomicron growth, which resulted in less succinate being available to support F. prausnitzii growth. While community stability was maintained when F. prausnitzii was not allowed to consume acetate produced by B. thetaiotaomicron, the reduced growth of F. prausnitzii resulted in substantially increased abundances of B. thetaiotaomicron and E. coli (fourth row). A similar but much less pronounced effect was predicted when F. prausnitzii was not allowed to consume acetate produced by E. coli (fifth row). These results demonstrate that acetate cross feeding from either B. thetaiotaomicron or E. coli was required to maintain species coexistence. When all cross feeding was removed, both B. thetaiotaomicron and F. prausnitzii were eliminated due to their dependence on cross-fed byproducts for growth enhancement (sixth row). All these results are summarized schematically in Figure 7.

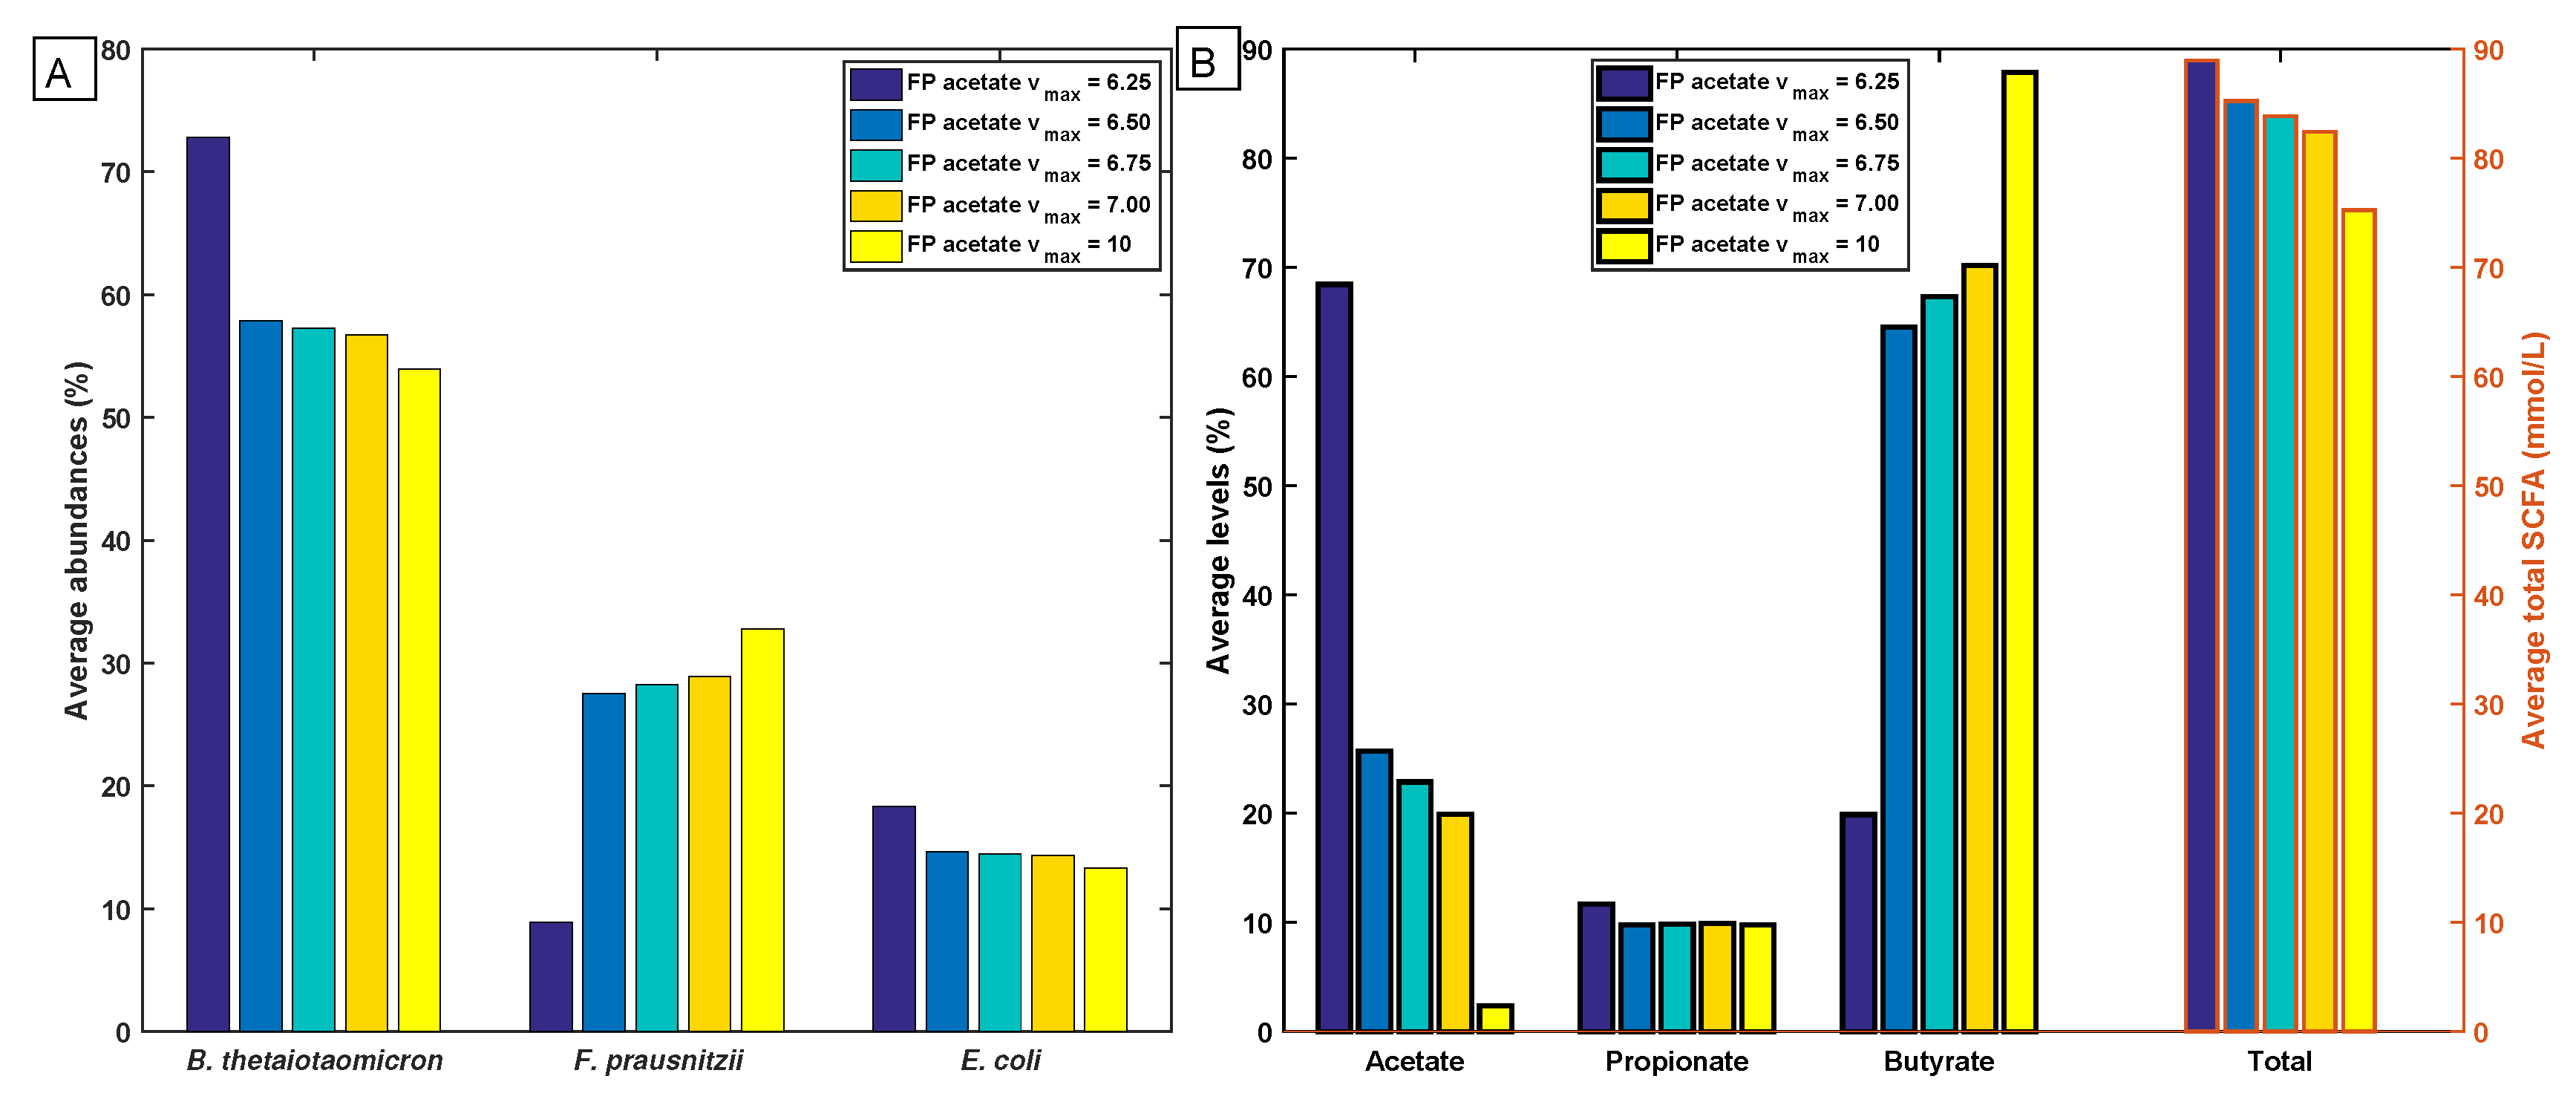
2.5. Robustness of the Cross-Feeding Strategy

The previous results demonstrated that cross feeding produced coexistence of the three species for the nominal conditions investigated. We performed additional simulations to investigate robustness of the cross-feeding mechanism to changes in biofilm and environmental conditions by varying the biofilm thickness and bulk nutrient concentrations, respectively. In this context, robustness was defined as the ability of the system to maintain community stability with small changes in the species abundances as would be expected for proper microbiome function.
Five thicknesses (L = 20, 30, 40, 50, 60 μm) were simulated at the nominal nutrient concentrations of 5 mmol/L glucose and 0.5 mmol/L each amino acid. The initial conditions corresponded to spatially uniform biomass concentrations of 10 g/L for each species. The three species community was predicted to be stable for all thicknesses except L = 20 μm (Figure 8), where B. thetaiotaomicron eliminated the other two species due to relatively high nutrient concentrations across the biofilm. For the other four thicknesses, the species abundances were predicted to remain within small ranges: B. thetaiotaomicron: 53.9%-59.6%; F. prausnitzii: 31.2%-32.8%; E. coli: 8.6%-13.3%. The F. prausnitzii abundance range was particularly small, while B. thetaiotaomicron abundance slightly decreased when E. coli abundance increased. By contrast, the average biomass concentration across the biofilm exhibited a strong decreasing trend as the thickness increased due to the lack of nutrients in the biofilm interior.
We also performed simulations for six different nutrient levels. The community remained stable with small variations in the species abundances for all cases except the highest nutrient levels, where F. prausnitzii was eliminated due to its reduced competitiveness in nutrient rich environments (Figure S3). These results further demonstrate the robustness of the putative cross-feeding strategy.

2.6. Flexibility of the Cross-Feeding Strategy

Our last set of simulations addressed the issue of system flexibility with respect to function rather than just species abundances. In this context, flexibility was defined as the ability of the community to adjust its SCFA production profile to meet different host demands by adjusting byproduct uptake rates. Due to their dominant effects on community stability, acetate and succinate uptakes by F. prausnitzii and ethanol uptake by B. thetaiotaomicron were modulated to examine their effects on total SCFA production and the split between acetate, propionate and butyrate. The relative levels of these SFCAs are known to vary substantially [54], and the regulation of byproduct uptake rates is one plausible mechanism the community might employ to achieve different production profiles. For each uptake rate, the range of maximum uptake rate v m a x values over which the SCFA profiles was most sensitive was located by trial-and-error simulations.
First, the v m a x value for F. prausnitzii acetate uptake was investigated. Our model predicted that the SCFA profile was most sensitive over a v m a x range of 6.25–7.00 mmol/gDW/h (Figure 9). Smaller v m a x values resulted in F. prausnitzii being wiped out due to insufficient growth, while larger values produced similar results to those obtained with the nominal value v m a x = 10 mmol/gDW/h. As v m a x was increased over the sensitive range, the F. prausnitzii abundance increased, the acetate level decreased, the propionate level remained almost constant, the butyrate level increased and the total SCFA concentration decreased. The SCFA profile was predicted to be particularly sensitive over the v m a x range of 6.25–6.50 mmol/gDW/h, where the acetate level dropped from 68% to 26% and the butyrate level increased from 20% to 65% due to the substantial increase in F. prausnitzii abundance.
Qualitatively similar predictions were obtained when the F. prausnitzii maximum succinate uptake rate was modulated (Figure S4). The primary effect was to alter the F. prausnitzii abundance. When the B. thetaiotaomicron maximum ethanol uptake rate was modulated, all three species abundances were strongly affected (Figure S5). Collectively, these predictions suggested that the split between acetate and butyrate could be strongly modulated through all three cross-feeding mechanisms, while the propionate level could be more weakly affected through ethanol cross feeding. However, individual SCFA levels were predicted to be strongly impacted only over small ranges of v m a x values, suggesting a lack of flexibility in the putative byproduct cross-feeding strategy with respect to SCFA modulation.

3. Discussion

A major challenge when developing in vitro models of natural microbial communities is to establish culture conditions that allow coexistence of the participating species [55]. Well-mixed suspension cultures have the disadvantage that species with widely differing growth rates cannot be co-cultured without engineering artificial dependencies such as amino acid cross feeding between the species [56]. Natural microbial communities have evolved numerous mechanisms for ensuring species coexistence, most notably the biofilm mode of growth. Spatial metabolite gradients within biofilms can allow otherwise slower growing species to establish metabolic niches favorable for their growth [21,22,23,24]. Cross feeding of secreted metabolic byproducts is another mechanism used by microbial communities to enhance the competitiveness of slower growing species and achieve community stability [17,18,19,20]. The development of in vitro systems to investigate the interplay of species metabolism, biofilm gradients and metabolite cross feeding has the potential to provide new insights into the stability and function of natural microbial communities. In turn, in silico modeling tools are needed to guide in vitro system design and to computationally interrogate difficult-to-measure behaviors such as metabolite cross feeding and long-term stability.
In this study, we developed an in silico metabolic model of a very simple community consisting of the commensal human gut microbes Bacteroides thetaiotaomicron, Faecalibacterium prausnitzii and Escherichia coli. These species were chosen as well studied representatives of the three most prevalent phyla (Bacteroidetes, Firmicutes, Proteobacteria) in the healthy gut microbiome and due to the availability of curated metabolic reconstructions. While the precise spatial organization of gut microbes is currently unknown, the structure likely includes biofilm growth associated with host mucosa and epithelial tissue [57]. Indeed the literature provides substantial support for the hypothesis that some gut microbes organize into spatially structured multispecies biofilms [58,59]. We performed single species flux balance analysis and biofilm simulations to investigate the growth characteristic and byproduct secretion patterns of the three isolated species. The models predicted widely varying individual species growth rates as a function of position in the biofilm and the secretion of eight primary byproducts that served as putative cross-fed metabolites in multispecies simulations: acetate, butyrate, CO2, ethanol, formate, lactate, propionate and succinate. The predicted byproducts secreted by each species were in agreement with experimental observations [60,61,62].
We developed a general computational strategy to identify putative cross-feeding relationships in multispecies biofilms that required no a priori assumptions about these relationships. Each species was allowed to consume every available byproduct to increase its local growth rate within the biofilm. The method provided an experimentally inaccessible picture of byproduct secretion and consumption patterns with complete temporal and spatial resolution. When applied to the three species gut microbiome system, we identified eleven distinct cross-feeding relationships involving six different byproducts (see Figure 4). To our knowledge, none of these relationships have been directly demonstrated through co-culture experiments with the participating species. However, the two acetate cross-feeding relationships were expected due to the demonstrated abilities of both B. thetaiotaomicron [60] and E. coli [62] to secrete acetate and of F. prausnitzii to consume acetate [61].
Byproduct cross feeding alone was not sufficient to achieve long-term community stability as reflected by coexistence of the three species. However, we determined that a small decrease in the non-growth associated ATP maintenance parameter in the E. coli metabolic reconstruction resulted in community stability. We justified this parameter change by noting that unmodeled nutrients in the gut environment could enhance E. coli growth relative to the other two species. The predicted abundances of 54% B. thetaiotaomicron, 33% F. prausnitzii and 13% E. coli were consistent with experimental studies on the prevalence of species from the Bacteroidetes, Firmicutes and Proteobacteria phyla, respectively, in the healthy human gut microbiome [53]. While the E. coli abundance was tuned with the ATP parameter, the relative amounts of B. thetaiotaomicron and F. prausnitzii were natural outcomes of the model. When all cross feeding was eliminated, the favorable metabolic niches for B. thetaiotaomicron in the nutrient rich region and F. prausnitzii in the nutrient lean region were eliminated and E. coli wiped out the other two species. Collectively, these results demonstrated that both biofilm formation and byproduct cross feeding were necessary for community stability. Cross-feeding simulations with all three combinations of two species systems showed that only the F. prausnitziiE. coli was unstable, suggesting that F. prausnitzii coexistence in the three species community was dependent on the presence of B. thetaiotaomicron. These predictions on community stability and species abundances are experimentally testable through biofilm culture experiments with two- and three-species systems.
We hypothesized that community stability could be maintained with only a small subset of the putative cross-feeding relationships: acetate and succinate consumption by F. prausnitzii and ethanol consumption by B. thetaiotaomicron. Multispecies biofilm simulations validated this hypothesis and further predicted a negligible change in the three species abundances with the elimination of CO2, formate and lactate cross feeding. Additional simulations were performed to determine the necessity of acetate, ethanol and succinate cross feeding on community stability and their impact on species abundances. These simulations predicted that the following relationships were necessary and sufficient for stability: (1) F. prausnitzii uptake of acetate produced by either B. thetaiotaomicron or E. coli; (2) F. prausnitzii uptake of succinate produced by B. thetaiotaomicron; and (3) B. thetaiotaomicron uptake of ethanol produced by E. coli (see Figure 7). The differential impact of F. prausnitzii acetate and succinate uptakes was attributed to the small succinate production rates of E. coli. F. prausnitzii uptake of acetate produced by B. thetaiotaomicron was the only relationship eliminated that maintained community stability while substantially altering the species abundances. In principle, these model predictions could be tested experimentally by metabolically engineering the individual species to eliminate specific byproduct secretion and uptake capabilities. Such mutants are readily generated for E. coli [63], while the necessary genetic engineering tools are under developed for B. thetaiotaomicron [64].
An essential capability of the gut microbiome is adaptation to widely varying nutritional environments while avoiding community instability that results in dysbiosis [65]. We performed biofilm simulations with the essential cross-feeding relationships for changes in the biofilm thickness and nutrient levels to ensure that species coexistence was not an artifact of the specific conditions chosen (see Table 1) but rather was a robust property of the cross-fed community. The in silico community showed a high level of robustness to variations in the biofilm thickness of 30–60 μm and nutrient levels of 1–10 mmol/L glucose and 0.1–1 mmol/L each amino acid (methionine, serine, tryptophan). Over these ranges, the community was predicted to be stable and species abundances varies less than 6% for B. thetaiotaomicron, 8% for F. prausnitzii and 9% for E. coli. As would be expected, system robustness was not a global property and outside these ranges the community could be destabilized. Biofilms of thickness 20 μm were predicted to consist of only B. thetaiotaomicron due to its higher growth rate under nutrient rich conditions, while high nutrient levels of 20 mmol/L glucose and 2 mmol/L each amino acid resulted in extinction of F. prausnitzii due to its lower growth rate under nutrient rich conditions. Because dysbiosis is commonly associated with reductions in Bacteroidetes (e.g., B. thetaiotaomicron) and Firmicutes (e.g., F. prausnitzii) abundances and increases in Proteobacteria (e.g., E. coli) abundance [53], these results suggest that the in silico community captures the inherent robustness of the considerably more complex gut microbiome. Our model predictions could be tested through in vitro experiments by varying media concentrations and measuring species abundances as a function of biofilm development time.
A primary function of the gut microbiome is to convert dietary nutrients to short chain fatty acids (SCFAs), which are absorbed in the large intestine and used as an energy source by the human host [28]. The relative levels of the primary SCFAs acetate, propionate and butyrate have been shown to vary substantially depending on the prevailing state of the gut environment and of the host [54]. We hypothesized that modulation of cross-feeding relationships between species could be one possible strategy the microbiome employs to flexibly alter SCFA synthesis profiles to meet host needs. To examine the efficacy of this putative strategy, we performed simulations by altering the maximum uptake rate v m a x associated with the three key cross-feeding relationships: acetate and succinate uptake by F. prausnitzii and ethanol uptake by B. thetaiotaomicron. The model predicted that species abundances and SCFA levels could be substantially altered only over a small range of each v m a x value. The split between acetate and butyrate could be strongly modulated through all three cross-feeding relationships, while the propionate level could be weakly affected through ethanol cross feeding. Given the small predicted ranges of v m a x values which impacted SCFA levels, we concluded that modulation of cross-feeding relationships might not be a very flexible strategy for altering SCFA profiles.
Our multispecies biofilm metabolic model represents an initial step towards predicting the impact of metabolite spatial gradients and cross feeding on the human gut microbiome. A possible limitation of this first generation model is the lack of byproduct consumption by E. coli, which renders the growth of E. coli largely independent of the other two species except for nutrient competition. Our initial hypothesis was that lactate produced by F. prausnitzii would be an important carbon source for E. coli. However, the model predicted that this cross-feeding relationship had a negligible impact on community behavior. Based on our simulation results, we hypothesize that the impact of a particular cross-feeding relationship is partially dependent on the abundances of the two species exchanging the byproduct. This hypothesis would rationalize why all three essential cross-feeding relationships involved B. thetaiotaomicron, the species with the highest abundance, and the two most impactful cross-feeding relationships involved F. prausnitzii, the species with the second highest abundance. Our simulations were designed to mimic the healthy gut microbiome, where Proteobacteria is a minority phylum compared to Bacteroidetes and Firmicutes. Dysbiosis associated with disease states such as inflammatory bowel disease are characterized by a dramatic decrease in Bacteroidetes and increase in Proteobacteria while Firmicutes are not as strongly affected [53]. In this case, the impact of lactate cross feeding between F. prausnitzii and E. coli may be predicted to be substantially more important while the effect of cross-feeding relationships predicted to be important for the healthy microbiome may be less significant. We are currently working with experimental collaborators to establish an in vitro model of the three species biofilm community to test this hypothesis as well as other in silico predictions generated by our model.

4. Materials and Methods

4.1. Multispecies Biofilm Model Formulation

The multispecies biofilm metabolic model was formulated following our previously published approach [66,67]. For the sake of brevity, the formulation is only briefly reviewed here with an emphasis on the novel features introduced for the gut microbiome model. We utilized genome-scale metabolic reconstructions for the commensal gut bacteria B. thetaiotaomicron [60], F. prausnitzii [61] and E. coli [62] to model individual species metabolism. A synthetic media was created by combining all the in silico nutrient requirements of the three bacteria assuming that growth was limited only by the primary carbon source glucose and three amino acids (methionine, serine, tryptophan) essential for F. prausnitzii.
The local concentration of each nutrient, byproduct and species biomass within the biofilm was calculated from transport equations written for the extracellular environment. One-dimensional diffusion in the axial direction of the biofilm was assumed to be the dominant transport mechanism (Figure 10). Therefore, each variable changed as a function of time t and space z over a fixed biofilm thickness L. The biomass equation for each species had the form,
X i t = μ i X i + D X , i 2 X i z 2
where X i ( z , t ) is the local biomass concentration (g/L) of species i, μ i ( z , t ) is the local growth rate (h−1) calculated from the metabolic reconstruction and D X , i is a biomass diffusion coefficient. Boundary conditions were imposed to represent zero biomass flux at the intestine–biofilm boundary ( z = L ) and biomass removal by continuous erosion [68] at the biofilm–stool interface ( z = 0 ),
X i ( L , t ) z = 0 , D X , i X i ( 0 , t ) z = k X , i [ X b , i ( 0 ) X i ( 0 , t ) ]
where k X , i is a biomass mass transfer coefficient and X b , i (0) is the bulk planktonic concentration of species i in the stool, which was assumed to be zero for simplicity. Given that the biofilm thickness was assumed to be constant, the incorporation of slow biomass diffusion through the biofilm and transport into the planktonic stool population provided a reasonable mechanism to ensure that biomass generation would be balanced by biomass removal such that steady-state solutions could be obtained for mature biofilms.
The nutrient transport equations had the form,
N i t = j = 1 n = 3 v i , j X j + D N , i 2 N i z 2
where N i ( z , t ) is the local concentration of nutrient i (glucose, methionine, serine, tryptophan), v i , j ( z , t ) is the uptake flux (mmol/gDW/h) of nutrient i by species j calculated from the metabolic reconstruction, D N , i is a nutrient diffusion coefficient and n = 3 is the number of species. Boundary conditions were imposed such that unconsumed nutrients could be removed from either boundary,
D N , i N i ( 0 , t ) z = k N , i [ N b , i ( 0 ) N i ( 0 , t ) ] , D N , i N i ( L , t ) z = k N , i [ N b , i ( L ) N i ( L , t ) ]
where k N , i is a nutrient mass transfer coefficient, and N b , i ( 0 ) and N b , i ( L ) are bulk concentrations of nutrient i, which were assumed to be zero at both boundaries for simplicity.
The byproduct transport equations and boundary conditions had a similar form,
P i t = j = 1 n = 3 v i , j X j + D P , i 2 P i z 2
D P , i P i ( 0 , t ) z = k P , i [ P b , i ( 0 ) P i ( 0 , t ) ] , D P , i P i ( L , t ) z = k P , i [ P b , i ( L ) P i ( L , t ) ]
where P i ( z , t ) is the local concentration (mmol/L) of byproduct i (acetate, butyrate, CO2, ethanol, formate, lactate, propionate, succinate), D P , i is a byproduct diffusion coefficient, k P , i is a byproduct mass transfer coefficient, P b , i ( 0 ) and P b , i ( L ) are bulk concentrations of byproduct i, which were assumed to be zero at both boundaries for simplicity. The exchange flux v i , j ( z , t ) (mmol/gDW/h) of product i from species j was positive if the byproduct was secreted and negative if the byproduct was consumed.
Each species was allowed to consume glucose, the three amino acids and the eight metabolic byproducts to maximized its growth rate. Uptake kinetics for each nutrient and byproduct were assumed to follow Michaelis–Menten kinetics:
v i = v m a x , i S i K m , i + S i
where S i ( z , t ) is the local extracellular concentration (mmol/L) of substrate i (includes nutrients and byproducts) and v m a x , i and K m , i are Michaelis–Menten constants. The calculated local uptake rates v i ( z , t ) (mmol/gDW/h) were imposed as transport bounds in the linear program used to solve the metabolic reconstructions. Butyrate uptake was excluded for B. thetaiotaomicron and ethanol and propionate uptakes were excluded from F. prausnitzii because the associated reconstructions lacked the necessary exchange fluxes.

4.2. Model Parameterization and Solution

Nominal parameter values utilized in the multispecies biofilm model (1)–(7) are shown in Table 1. We used order-of-magnitude estimates of most parameters due to the lack of relevant data in the literature. For the same reason, we generally assigned the same parameter values to each species and to each metabolite rather than attempt to determine species and metabolite specific values. The biofilm thickness L and the nutrient/byproduct diffusion coefficients D N and D P were chosen within published ranges [13,69]. Nutrients were supplied at the biofilm–stool interface ( z = 0 ) and removed from the intestine–biofilm interface ( z = L ) assuming zero bulk concentrations N b ( L ) . The stool nutrient concentrations N b ( 0 ) and the nutrient mass transfer coefficients k N were tuned to achieve sufficient nutrient levels within the biofilm to sustain growth. Byproducts were removed from both interfaces assuming zero bulk concentrations P b ( 0 ) and P b ( L ) . The byproduct mass transfer coefficients k P were tuned to achieve organic acid and SCFA concentrations within published ranges [54].
The biomass diffusion coefficients were specified to be approximately four orders-of-magnitude less than the metabolite values to reflect very slow movement of cells towards the biofilm–stool boundary due to unmodeled biofilm expansion. Biomass was removed at this boundary assuming negligible planktonic biomass concentrations X b ( 0 ) to model a continuous erosion mechanism [68]. The biomass mass transfer coefficients k X ( 0 ) were tuned such that steady-state, mature biofilms would have biomass concentrations within published ranges [13]. Due to the lack of experimentally determined values for B. thetaiotaomicron and F. prausnitzii, glucose and amino acid maximum uptake rates v m a x reported for E. coli [70] were used for all three species. All byproducts were assumed to have the same v m a x values as glucose. Furthermore, all nutrients and byproducts were assumed to have the same Michaelis–Menten constants K m as reported for glucose uptake in E. coli [70]. Planktonic experiments could be conducted to estimate these uptake kinetic parameters, although different parameter values may be appropriate under biofilm conditions. Each dynamic simulation was performed with an initial condition corresponding to a steady-state solution with spatially homogeneous biomass concentrations X ( z , 0 ) and spatially varying nutrient concentrations N ( z , 0 ) and byproduct concentrations P ( z , 0 ) consistent with the specified X ( z , 0 ) . For each simulation, we found that the final solution was independent of the initial condition for all initial conditions investigated.
The parameterized biofilm model consisted of a coupled set of nonlinear partial differential equations (PDEs) with embedded linear programs (LPs). Following our previously published approach [66,67], the spatial domain was discretized to convert each PDE into a large set of coupled ordinary differential equations (ODEs). Both diffusion terms and first-order derivatives required to implement boundary conditions were approximated by second-order central difference formulas. Spatial discretization was performed with N = 25 node points to achieve a suitable compromise between model complexity and numerical efficiency. The discretized model consisted of 375 nonlinear ODEs describing the time evolution of the biomass, nutrient and byproduct concentrations at the node points.
The ODE model with embedded LPs was solved using the MATLAB code DFBAlab [71]. To overcome the possibility of alternative optima in the LP problems, the DFBAlab algorithm uses lexicographic optimization to achieve unique exchange fluxes and ensure a well defined dynamical model. We specified the lexicographic optimization objectives as shown in Table 2. The primary objective for each species was maximum growth, while the lower level objectives were ordered according to the following rules: (1) secretion of experimentally observed byproducts: B. thetaiotaomicron (acetate, propionate, succinate, CO2) [60], F. prausnitzii (butyrate, formate, lactate, CO2) [61], E. coli (acetate, ethanol, formate, lactate, succinate, CO2) [62]; (2) uptake of putative cross-fed byproducts: B. thetaiotaomicron (ethanol, formate, lactate), F. prausnitzii (acetate, succinate), E. coli (butyrate, propionate); and (3) uptake of supplied nutrients (glucose, methionine, serine, tryptophan). All objectives were specified as maximization, which translated to maximization of secretion fluxes due to their positivity and minimization of uptake fluxes due to their negativity. In some cases, the objectives within a particular group were ordered to generate specific byproduct uptake and secretion patterns. For B. thetaiotaomicron, succinate secretion was placed above propionate secretion to obtain a mixture of these two byproducts instead of only propionate and lactate was placed as the highest ranked byproduct uptake so lactate uptake was observed. For F. prausnitzii, lactate was placed as the highest ranked secretion so lactate secretion was observed. The B. thetaiotaomicron model had only 11 objectives due to the lack of butyrate uptake, while the F. prausnitzii model had only 10 objectives due to the lack of ethanol and propionate uptakes.
Due to the use of lexicographic optimization, 36 LPs were solved at each node point. Therefore, the complete discretized model consisted of 375 ODEs and 900 LPs. We used Gurobi 6.0 for LP solution, the stiff MATLAB solver ode15s for ODE integration and DFBAlab running in MATLAB 8.5 (R2015a). DFBAlab is freely available for both education and nonprofit research purposes from https://yoric.mit.edu/dfbalab. The MATLAB simulation codes for the multispecies biofilm model can be downloaded from www.ecs.umass.edu/che/henson_group/downloads.html.

Supplementary Materials

The following are available online at www.mdpi.com/2227-9717/5/1/13/s1. Figure S1: Time profiles predicted in the middle of the multispecies biofilm without byproduct crossfeeding. Units are g/L for biomass, h−1 for growth rates and mmol/L for the byproducts. Figure S2: Steady-state spatial profiles predicted by two species biofilm models. (A) B. thetaiotaomicronF. prausnitzii biofilm. (B) B. thetaiotaomicronE. coli biofilm. (C) F. prausnitziiE. coli biofilm. Units are g/L for biomass and h−1 for growth. Figure S3: Effect of the bulk nutrient concentrations on the abundance of each species and the total biomass concentration averaged across the biofilm. Glc denotes glucose and AA denotes each amino acid. Figure S4: Effect of the F. prausnitzii maximum succinate uptake rate vmax on (A) species abundances and (B) acetate, propionate and butyrate levels and the total SCFA concentration. Figure S5: Effect of the B. thetaiotaomicron maximum ethanol uptake rate vmax on (A) species abundances and (B) acetate, propionate and butyrate levels and the total SCFA concentration.

Acknowledgments

The authors wish to thank Prof. Ines Thiele (University of Luxemborg) for providing the Bacteroides thetaiotaomicron and Faecalibacterium prausnitzii metabolic reconstructions and Prof. Paul Barton and Jose Gomez (MIT) for providing assistance with the DFBAlab code. The authors wish to acknowledge NIH (Award U01EB019416) and NSF (Award CBET 1511346) for partial financial support of this research. Funds from these grants were used to cover the costs to publish in open access. This work was supported in part by a Fellowship from the University of Massachusetts to Poonam Phalak as part of a NIH funded Training Program (National Research Service Award T32 GM108556).

Author Contributions

M.A.H. conceived the study. M.A.H. and P.P. developed the model and the model solution method. M.A.H. and P.P. performed the simulations and analyzed the results. M.A.H. and P.P. prepared the manuscript. All authors read and approved the final manuscript.

Conflicts of Interest

The authors declare no conflict of interest.

Abbreviations

The following abbreviations are used in this manuscript:
AAAmino acid
AceAcetate
BTB. thetaiotaomicron
ButButyrate
FBAFlux balance analysis
ECE. coli
EthEthanol
FPF. prausnitzii
FrmFormate
GlcGlucose
LacLactate
LPLinear program
MetMethionine
OAOrganic acid
ODEOrdinary differential equation
PDEPartial differential equation
PrpPropionate
SerSerine
SFCAShort chain fatty acid
SucSuccinate
TrpTryptophan

References

  1. Stoodley, P.; Sauer, K.; Davies, D.; Costerton, J.W. Biofilms as complex differentiated communities. Annu. Rev. Microbiol. 2002, 56, 187–209. [Google Scholar] [CrossRef] [PubMed]
  2. Stewart, P.S.; Franklin, M.J. Physiological heterogeneity in biofilms. Nat. Rev. Microbiol. 2008, 6, 199–210. [Google Scholar] [CrossRef] [PubMed]
  3. Bernstein, H.C.; Carlson, R.P. Microbial consortia engineering for cellular factories: In vitro to in silico systems. Comput. Struct. Biotechnol. J. 2012, 3, e201210017. [Google Scholar] [CrossRef] [PubMed]
  4. Ackermann, M. A functional perspective on phenotypic heterogeneity in microorganisms. Nat. Rev. Microbiol. 2015, 13, 497–508. [Google Scholar] [CrossRef] [PubMed]
  5. Hall-Stoodley, L.; Costerton, J.W.; Stoodley, P. Bacterial biofilms: From the natural environment to infectious diseases. Nat. Rev. Microbiol. 2004, 2, 95–108. [Google Scholar] [CrossRef] [PubMed]
  6. Costello, E.K.; Lauber, C.L.; Hamady, M.; Fierer, N.; Gordon, J.I.; Knight, R. Bacterial community variation in human body habitats across space and time. Science 2009, 326, 1694–1697. [Google Scholar] [CrossRef] [PubMed]
  7. Faust, K.; Raes, J. Microbial interactions: From networks to models. Nat. Rev. Microbiol. 2012, 10, 538–550. [Google Scholar] [CrossRef] [PubMed]
  8. Hol, F.J.; Galajda, P.; Woolthuis, R.G.; Dekker, C.; Keymer, J.E. The idiosyncrasy of spatial structure in bacterial competition. BMC Res. Notes 2015, 8, 245. [Google Scholar] [CrossRef] [PubMed]
  9. Kovács, Á.T. Impact of spatial distribution on the development of mutualism in microbes. Front. Microbiol. 2014, 5, 649. [Google Scholar] [CrossRef] [PubMed]
  10. Tolker-Nielsen, T.; Molin, S. Spatial organization of microbial biofilm communities. Microb. Ecol. 2000, 40, 75–84. [Google Scholar] [PubMed]
  11. Burmølle, M.; Ren, D.; Bjarnsholt, T.; Sørensen, S.J. Interactions in multispecies biofilms: Do they actually matter? Trends Microbiol. 2014, 22, 84–91. [Google Scholar] [CrossRef] [PubMed]
  12. Mazumdar, V.; Amar, S.; Segrè, D. Metabolic proximity in the order of colonization of a microbial community. PLoS ONE 2013, 8, e77617. [Google Scholar] [CrossRef] [PubMed]
  13. Stewart, P.S. A review of experimental measurements of effective diffusive permeabilities and effective diffusion coefficients in biofilms. Biotechnol. Bioeng. 1998, 59, 261–272. [Google Scholar] [CrossRef]
  14. Woods, J.; Boegli, L.; Kirker, K.R.; Agostinho, A.M.; Durch, A.M.; deLancey Pulcini, E.; Stewart, P.S.; James, G.A. Development and application of a polymicrobial, in vitro, wound biofilm model. J. Appl. Microbiol. 2012, 112, 998–1006. [Google Scholar] [CrossRef] [PubMed]
  15. Zuroff, T.R.; Bernstein, H.; Lloyd-Randolfi, J.; Jimenez-Taracido, L.; Stewart, P.S.; Carlson, R.P. Robustness analysis of culturing perturbations on Escherichia coli colony biofilm beta-lactam and aminoglycoside antibiotic tolerance. BMC Microbiol. 2010, 10, 185. [Google Scholar] [CrossRef] [PubMed]
  16. Anderl, J.N.; Franklin, M.J.; Stewart, P.S. Role of antibiotic penetration limitation in Klebsiella pneumoniae biofilm resistance to ampicillin and ciprofloxacin. Antimicrob. Agents Chemother. 2000, 44, 1818–1824. [Google Scholar] [CrossRef] [PubMed]
  17. Cockburn, D.W.; Koropatkin, N.M. Polysaccharide degradation by the intestinal microbiota and its influence on human health and disease. J. Mol. Biol. 2016, 428, 3230–3252. [Google Scholar] [CrossRef] [PubMed]
  18. Seth, E.C.; Taga, M.E. Nutrient cross-feeding in the microbial world. Front. Microbiol. 2014, 5, 350. [Google Scholar] [CrossRef] [PubMed]
  19. Pande, S.; Merker, H.; Bohl, K.; Reichelt, M.; Schuster, S.; De Figueiredo, L.F.; Kaleta, C.; Kost, C. Fitness and stability of obligate cross-feeding interactions that emerge upon gene loss in bacteria. ISME J. 2014, 8, 953–962. [Google Scholar] [CrossRef] [PubMed]
  20. Woloszynek, S.; Pastor, S.; Mell, J.; Nandi, N.; Sokhansanj, B.; Rosen, G. Engineering Human Microbiota: Influencing Cellular and Community Dynamics for Therapeutic Applications. Int. Rev. Cell Mol. Biol. 2016, 324, 67–124. [Google Scholar] [PubMed]
  21. Poltak, S.R.; Cooper, V.S. Ecological succession in long-term experimentally evolved biofilms produces synergistic communities. ISME J. 2011, 5, 369–378. [Google Scholar] [CrossRef] [PubMed]
  22. Wintermute, E.H.; Silver, P.A. Dynamics in the mixed microbial concourse. Genes Dev. 2010, 24, 2603–2614. [Google Scholar] [CrossRef] [PubMed]
  23. Villa, F.; Pitts, B.; Lauchnor, E.; Cappitelli, F.; Stewart, P.S. Development of a laboratory model of a phototroph-heterotroph mixed-species biofilm at the stone/air interface. Front. Microbiol. 2015, 6, 1251. [Google Scholar] [CrossRef] [PubMed]
  24. Pande, S.; Kaftan, F.; Lang, S.; Svatoš, A.; Germerodt, S.; Kost, C. Privatization of cooperative benefits stabilizes mutualistic cross-feeding interactions in spatially structured environments. ISME J. 2016, 10, 1413–1423. [Google Scholar] [CrossRef] [PubMed]
  25. Human Microbiome Project Consortium. A framework for human microbiome research. Nature 2012, 486, 215–221. [Google Scholar] [Green Version]
  26. Thompson, J.A.; Oliveira, R.A.; Xavier, K.B. Chemical conversations in the gut microbiota. Gut Microbes 2016, 7, 163–170. [Google Scholar] [CrossRef] [PubMed]
  27. Fischbach, M.A.; Sonnenburg, J.L. Eating for two: How metabolism establishes interspecies interactions in the gut. Cell Host Microbe 2011, 10, 336–347. [Google Scholar] [CrossRef] [PubMed]
  28. Morrison, D.J.; Preston, T. Formation of short chain fatty acids by the gut microbiota and their impact on human metabolism. Gut Microbes 2016, 7, 189–200. [Google Scholar] [CrossRef] [PubMed]
  29. Honda, K.; Littman, D.R. The microbiota in adaptive immune homeostasis and disease. Nature 2016, 535, 75–84. [Google Scholar] [CrossRef] [PubMed]
  30. Gur, T.L.; Bailey, M.T. Effects of stress on commensal microbes and immune system activity. In Microbial Endocrinology: Interkingdom Signaling in Infectious Disease and Health; Springer: New York, NY, USA, 2016; pp. 289–300. [Google Scholar]
  31. Theriot, C.M.; Young, V.B. Interactions between the gastrointestinal microbiome and Clostridium difficile. Annu. Rew. Microbiol. 2015, 69, 445–461. [Google Scholar] [CrossRef] [PubMed]
  32. Ahmed, I.; Roy, B.C.; Khan, S.A.; Septer, S.; Umar, S. Microbiome, Metabolome and Inflammatory Bowel Disease. Microorganisms 2016, 4, 20. [Google Scholar] [CrossRef] [PubMed]
  33. yri, S.F.; Muzes, G.; Sipos, F. Dysbiotic gut microbiome: A key element of Crohn’s disease. Comp. Immunol. Microbiol. Infect. Dis. 2015, 43, 36–49. [Google Scholar] [CrossRef] [PubMed]
  34. John, G.K.; Mullin, G.E. The gut microbiome and obesity. Curr. Oncol. Rep. 2016, 18, 1–7. [Google Scholar] [CrossRef] [PubMed]
  35. Arora, T.; Bäckhed, F. The gut microbiota and metabolic disease: Current understanding and future perspectives. J. Intern. Med. 2016, 280, 339–349. [Google Scholar] [CrossRef] [PubMed]
  36. Koopen, A.M.; Groen, A.K.; Nieuwdorp, M. Human microbiome as therapeutic intervention target to reduce cardiovascular disease risk. Curr. Opin. Lipidol. 2016, 27, 615–622. [Google Scholar] [CrossRef] [PubMed]
  37. Rosenbaum, J.T.; Asquith, M.J. The microbiome: A revolution in treatment for rheumatic diseases? Curr. Rheumatol. Rep. 2016, 18, 62. [Google Scholar] [CrossRef] [PubMed]
  38. Manzat-Saplacan, R.M.; Mircea, P.A.; Balacescu, L.; Chira, R.I.; Berindan-Neagoe, I.; Balacescu, O. Can we change our microbiome to prevent colorectal cancer development? Acta Oncol. 2015, 54, 1085–1095. [Google Scholar] [CrossRef] [PubMed]
  39. Dash, S.; Clarke, G.; Berk, M.; Jacka, F.N. The gut microbiome and diet in psychiatry: Focus on depression. Curr. Opin. Psychiatry 2015, 28, 1–6. [Google Scholar] [CrossRef] [PubMed]
  40. Frank, D.N.; Amand, A.L.S.; Feldman, R.A.; Boedeker, E.C.; Harpaz, N.; Pace, N.R. Molecular-phylogenetic characterization of microbial community imbalances in human inflammatory bowel diseases. Proc. Natl. Acad. Sci. USA 2007, 104, 13780–13785. [Google Scholar] [CrossRef] [PubMed]
  41. Byrne, C.; Chambers, E.; Morrison, D.; Frost, G. The role of short chain fatty acids in appetite regulation and energy homeostasis. Int. J. Obes. 2015, 39, 1331–1338. [Google Scholar] [CrossRef] [PubMed]
  42. Schloissnig, S.; Arumugam, M.; Sunagawa, S.; Mitreva, M.; Tap, J.; Zhu, A.; Waller, A.; Mende, D.R.; Kultima, J.R.; Martin, J.; et al. Genomic variation landscape of the human gut microbiome. Nature 2013, 493, 45–50. [Google Scholar] [CrossRef] [PubMed] [Green Version]
  43. Shreiner, A.B.; Kao, J.Y.; Young, V.B. The gut microbiome in health and in disease. Curr. Opin. Gastroenterol. 2015, 31, 69. [Google Scholar] [CrossRef] [PubMed]
  44. Lawley, T.D.; Clare, S.; Walker, A.W.; Stares, M.D.; Connor, T.R.; Raisen, C.; Goulding, D.; Rad, R.; Schreiber, F.; Brandt, C.; et al. Targeted restoration of the intestinal microbiota with a simple, defined bacteriotherapy resolves relapsing Clostridium difficile disease in mice. PLoS Pathog. 2012, 8, e1002995. [Google Scholar] [CrossRef] [PubMed] [Green Version]
  45. Seekatz, A.M.; Young, V.B. Clostridium difficile and the microbiota. J. Clin. Investig. 2014, 124, 4182–4189. [Google Scholar] [CrossRef] [PubMed]
  46. Lozupone, C.A.; Stombaugh, J.I.; Gordon, J.I.; Jansson, J.K.; Knight, R. Diversity, stability and resilience of the human gut microbiota. Nature 2012, 489, 220–230. [Google Scholar] [CrossRef] [PubMed]
  47. Coyte, K.Z.; Schluter, J.; Foster, K.R. The ecology of the microbiome: Networks, competition, and stability. Science 2015, 350, 663–666. [Google Scholar] [CrossRef] [PubMed]
  48. Estrela, S.; Brown, S.P. Metabolic and demographic feedbacks shape the emergent spatial structure and function of microbial communities. PLoS Comput. Biol. 2013, 9, e1003398. [Google Scholar] [CrossRef] [PubMed]
  49. Brenner, K.; You, L.; Arnold, F.H. Engineering microbial consortia: A new frontier in synthetic biology. Trends Biotechnol. 2008, 26, 483–489. [Google Scholar] [CrossRef] [PubMed]
  50. De Roy, K.; Marzorati, M.; Van den Abbeele, P.; Van de Wiele, T.; Boon, N. Synthetic microbial ecosystems: An exciting tool to understand and apply microbial communities. Environ. Microbiol. 2014, 16, 1472–1481. [Google Scholar] [CrossRef] [PubMed] [Green Version]
  51. Shong, J.; Diaz, M.R.J.; Collins, C.H. Towards synthetic microbial consortia for bioprocessing. Curr. Opin. Biotechnol. 2012, 23, 798–802. [Google Scholar] [CrossRef] [PubMed]
  52. Jagmann, N.; Philipp, B. Reprint of design of synthetic microbial communities for biotechnological production processes. J. Biotechnol. 2014, 192, 293–301. [Google Scholar] [CrossRef] [PubMed]
  53. Spor, A.; Koren, O.; Ley, R. Unravelling the effects of the environment and host genotype on the gut microbiome. Nat. Rev. Microbiol. 2011, 9, 279–290. [Google Scholar] [CrossRef] [PubMed]
  54. Den Besten, G.; van Eunen, K.; Groen, A.K.; Venema, K.; Reijngoud, D.J.; Bakker, B.M. The role of short-chain fatty acids in the interplay between diet, gut microbiota, and host energy metabolism. J. Lipid Res. 2013, 54, 2325–2340. [Google Scholar] [CrossRef] [PubMed]
  55. Kim, H.J.; Boedicker, J.Q.; Choi, J.W.; Ismagilov, R.F. Defined spatial structure stabilizes a synthetic multispecies bacterial community. Proc. Natl. Acad. Sci. USA 2008, 105, 18188–18193. [Google Scholar] [CrossRef] [PubMed]
  56. Hoek, T.A.; Axelrod, K.; Biancalani, T.; Yurtsev, E.A.; Liu, J.; Gore, J. Resource availability modulates the cooperative and competitive nature of a microbial cross-feeding mutualism. PLoS Biol. 2016, 14, e1002540. [Google Scholar] [CrossRef] [PubMed]
  57. Ouwerkerk, J.P.; de Vos, W.M.; Belzer, C. Glycobiome: Bacteria and mucus at the epithelial interface. Best Pract. Res. Clin. Gastroenterol. 2013, 27, 25–38. [Google Scholar] [CrossRef] [PubMed]
  58. Macfarlane, S.; Dillon, J. Microbial biofilms in the human gastrointestinal tract. J. Appl. Microbiol. 2007, 102, 1187–1196. [Google Scholar] [CrossRef] [PubMed]
  59. Donelli, G.; Vuotto, C.; Cardines, R.; Mastrantonio, P. Biofilm-growing intestinal anaerobic bacteria. FEMS Immunol. Med. Microbiol. 2012, 65, 318–325. [Google Scholar] [CrossRef] [PubMed]
  60. Heinken, A.; Sahoo, S.; Fleming, R.M.; Thiele, I. Systems-level characterization of a host-microbe metabolic symbiosis in the mammalian gut. Gut Microbes 2013, 4, 28–40. [Google Scholar] [CrossRef] [PubMed]
  61. Heinken, A.; Khan, M.T.; Paglia, G.; Rodionov, D.A.; Harmsen, H.J.; Thiele, I. Functional metabolic map of Faecalibacterium prausnitzii, a beneficial human gut microbe. J. Bacteriol. 2014, 196, 3289–3302. [Google Scholar] [CrossRef] [PubMed]
  62. Baumler, D.J.; Peplinski, R.G.; Reed, J.L.; Glasner, J.D.; Perna, N.T. The evolution of metabolic networks of E. coli. BMC Syst. Biol. 2011, 5, 182. [Google Scholar] [CrossRef] [PubMed]
  63. Choi, K.R.; Shin, J.H.; Cho, J.S.; Yang, D.; Lee, S.Y. Systems Metabolic Engineering of Escherichia coli. EcoSal Plus 2016, 7. [Google Scholar] [CrossRef] [PubMed]
  64. Mimee, M.; Tucker, A.C.; Voigt, C.A.; Lu, T.K. Programming a human commensal bacterium, Bacteroides thetaiotaomicron, to sense and respond to stimuli in the murine gut microbiota. Cell Syst. 2015, 1, 62–71. [Google Scholar] [CrossRef] [PubMed]
  65. Lloyd-Price, J.; Abu-Ali, G.; Huttenhower, C. The healthy human microbiome. Genome Med. 2016, 8, 51. [Google Scholar] [CrossRef] [PubMed]
  66. Chen, J.; Gomez, J.A.; Höffner, K.; Phalak, P.; Barton, P.I.; Henson, M.A. Spatiotemporal modeling of microbial metabolism. BMC Syst. Biol. 2016, 10, 21. [Google Scholar] [CrossRef] [PubMed]
  67. Phalak, P.; Chen, J.; Carlson, R.P.; Henson, M.A. Metabolic modeling of a chronic wound biofilm consortium predicts spatial partitioning of bacterial species. BMC Syst. Biol. 2016, 10, 90. [Google Scholar] [CrossRef] [PubMed]
  68. Horn, H.; Lackner, S. Modeling of biofilm systems: A review. In Productive Biofilms; Springer: New York, NY, USA, 2014; pp. 53–76. [Google Scholar]
  69. Stewart, P.S. Diffusion in biofilms. J. Bacteriol. 2003, 185, 1485–1491. [Google Scholar] [CrossRef] [PubMed]
  70. Meadows, A.L.; Karnik, R.; Lam, H.; Forestell, S.; Snedecor, B. Application of dynamic flux balance analysis to an industrial Escherichia coli fermentation. Metab. Eng. 2010, 12, 150–160. [Google Scholar] [CrossRef] [PubMed]
  71. Gomez, J.A.; Hoffner, K.; Barton, P.I. DFBAlab: A fast and reliable MATLAB code for dynamic flux balance analysis. BMC Bioinform. 2014, 15, 409. [Google Scholar] [CrossRef] [PubMed]
Figure 1. Secreted byproducts predicted by metabolic reconstructions and biofilm metabolic models of the three individual species. The same byproducts were predicted for planktonic and biofilm growth with the exception of B. thetaiotaomicron, for which CO2 was produced only planktonically and succinate was produced only in the biofilm.
Processes 05 00013 g001
Figure 2. Steady-state spatial profiles predicted by single species biofilm models. Units are g/L for biomass, h−1 for growth rate and mmol/L for the other variables. Species: BT denotes B. thetaiotaomicron, FP denotes F. prausnitzii and EC denotes E. coli.
Processes 05 00013 g002
Figure 3. Time profiles predicted in the middle of the multispecies biofilm with byproduct cross feeding. (A) Biomass, nutrient and byproduct concentrations. Units are g/L for biomass and mmol/L for the nutrients and byproducts; (B) Species growth, uptake and secretion rates. Units are h−1 for the growth rate and mmol/gDW/h for the other rates. Uptake rates are negative and secretion rates are positive. Amino acids: Met denotes methionine, Ser denotes serine and Trp denotes tryptophan. Byproducts: Ace denotes acetate, But denotes butyrate, Eth denotes ethanol, Frm denotes formate, Lac denotes lactate, Prp denotes propionate and Suc denotes succinate.
Processes 05 00013 g003
Figure 4. Byproduct cross-feeding patterns identified from the species uptake and secretion fluxes in Figure 3B. Formate cross feeding has been omitted due to its small magnitude and duration.
Processes 05 00013 g004
Figure 5. Steady-state spatial profiles predicted by the multispecies biofilm model with reduced E. coli ATP maintenance. (A) Biomass and byproduct concentrations. Units are g/L for biomass and mmol/L for the byproducts; (B) Species growth rates and byproduct uptake and secretion rates. Units are h−1 for growth rates and mmol/gDW/h for the other rates.
Processes 05 00013 g005
Figure 6. Steady-state biomass concentration (left) and growth rate (right) spatial profiles predicted with different cross-feeding relationships. Each row represents a different cross-feeding pattern. Row 1: Scenario 1. The same results were obtained for scenario 8. Row 2: Scenario 2. The same results were obtained for scenarios 3 and 6. Row 3: Scenario 4. Row 4: Scenario 5. Row 5: Scenario 7. Row 6: Scenario 9. Units are g/L for biomass and h−1 for growth rates. The average species abundances across the biofilm are shown for each case.
Processes 05 00013 g006
Figure 7. Effect of key cross-feeding relationships on community stability. Solid lines represent relationships required for stability: F. prausnitzii consumption of succinate produced by B. thetaiotaomicron, F. prausnitzii consumption of acetate produced by either B. thetaiotaomicron or E. coli, and B. thetaiotaomicron consumption of ethanol produced by E. coli. Dashed lines represent relationships that are not required for stability but may impact species abundances.
Processes 05 00013 g007
Figure 8. Effect of the biofilm thickness L on the adundance of each species and the total biomass concentration averaged across the biofilm.
Processes 05 00013 g008
Figure 9. Effect of the F. prausnitzii maximum acetate uptake rate v m a x on (A) species abundances and (B) acetate, propionate and butyrate levels and the total SCFA concentration.
Processes 05 00013 g009
Figure 10. Schematic representation of the multispecies biofilm. Nutrients diffuse into the biofilm at the biofilm–stool boundary and unconsumed nutrients diffuse out of the biofilm at the intestine–biofilm boundary. Short-chair fatty acids (SCFAs) and organic acids (OAs) synthesized by the three bacteria diffuse through the biofilm and are removed at both boundaries. Biomass slowly diffuses through biofilm and is removed at the biofilm–stool boundary according to a continuous erosion mechanism.
Processes 05 00013 g010
Table 1. Nominal parameter values for the multispecies biofilm model. For parameters that vary at the two biofilm boundaries, “0” denotes the biofilm–stool interface and ”L” denotes the intestine–biofilm interface.
SymbolParameterValueUnitsSource
LBiofilm thickness40μm[13]
D X Biomass diffusion coefficients1 × 10−10cm2/sSpecified
k X ( 0 ) Biomass mass transfer coefficients1 × 10−7cm/sSpecified
X b ( 0 ) Biomass bulk concentrations0g/LSpecified
D N Nutrient diffusion coefficients2 × 10−6cm2/s[69]
k N Nutrient mass transfer coefficients2 × 10−4cm/sSpecified
N b ( 0 ) Glucose bulk concentration5mmol/LSpecified
Amino acid bulk concentrations0.5mmol/LSpecified
N b ( L ) Glucose bulk concentration0mmol/LSpecified
Amino acid bulk concentrations0mmol/LSpecified
D P Byproduct diffusion coefficients2 × 10−6cm2/s[69]
k P Byproduct mass transfer coefficients5 × 10−6cm/sSpecified
P b ( 0 ) Byproduct bulk concentrations0mmol/LSpecified
P b ( L ) Byproduct bulk concentrations0mmol/LSpecified
v m a x Glucose maximum uptake rate10mmol/gDW/h[70]
Amino acid maximum uptake rates1mmol/gDW/h[70]
Byproduct maximum uptake rates10mmol/gDW/hSpecified
K m Michaelis–Menten constants0.5mmol/L[70]
X ( z , 0 ) Initial biomass concentrations10g/LSpecified
Table 2. Lexicographic optimization objectives.
LevelB. thetaiotaomicronF. prausnitziiE. coli
1BiomassBiomassBiomass
2AcetateLactateAcetate
3SuccinateButyrateEthanol
4PropionateFormateFormate
5CO2CO2Lactate
6LactateAcetateSuccinate
7EthanolSuccinateCO2
8FormateGlucoseButyrate
9GlucoseMethioninePropionate
10MethionineSerineGlucose
11SerineTryptophanMethionine
12TryptophanNot specifiedSerine
13Not specifiedNot specifiedTryptophan

