
Abstract
Capping completes the closure of parenteral drug products in the final packaging container and is critical in maintaining an integral seal to ensure product quality. Residual seal force (RSF) is considered the sole quantifiable attribute for measuring seal “goodness” and potentially enables nonsubjective, consistent setting of cappers across manufacturing sites. However, the consistency and reliability of RSF measurement and data have been scarcely reported, and the relationship between RSF and container closure integrity (CCI) remains poorly understood.
Here, we present a large data set generated from a commercial capper and the results from a laboratory capper of glass vials and rubber stoppers with aluminum caps. All RSF values exhibited significant variability. We evaluated four potential sources of variability: the capper, the RSF tester, the time-dependent nature of RSF, and the components. We determined that the capper, the tester, and the time-dependent nature are not main sources. Dimensional tolerances of the packaging components were the root cause for the container closure system (CCS) configurations tested in this study.
This study correlated RSF with CCI (via helium leakage), although CCI is not sensitive to RSF; CCI was maintained even for loosely capped vials with no measurable RSF. This was attributed to the stopper's two sealing surfaces: the valve seal and the land seal. A methodology capable of differentiating the two seals' functions demonstrated that vials with only the valve seal always passed leakage testing for a selected CCS configuration in this study, while vials with only the land seal failed CCI at low RSF values. This observation allows proposal of a low RSF limit that is safe even when the valve seal is defective. Simplified statistical analysis of commercial capping data, with the input of sample size, allowed the relationship between RSF's low limit and an allowable failing rate to be established. Overall, despite the inherent variability of RSF, this study shows that it is a feasible parameter for capping process quantification and demonstrates the potential of RSF measurement in capper setup.
LAY ABSTRACT: Pharmaceutical vials are typically closed off with an elastomeric stopper that is secured onto the vial with an aluminum crimp cap (or seal) such that the entire assembly is meant to protect the vial's contents from external contamination. Therefore, the capping process is critical for ensuring container closure integrity. Characterizing the effectiveness of a seal in a nonsubjective and quantifiable manner is challenging. In this communication, we report the evaluation of residual seal force measurements (the compression force that the crimp cap exerts on the stopper) to evaluate capping for a large set of samples generated on both an at-scale commercial capper and a benchtop laboratory capper. We propose a test methodology, based on a statistical approach, for establishing permissible lower residual force limits that would provide a high degree of confidence to the capping process. This is a useful tool for consistent capper setup and capping process quantification.
- Residual seal force
- RSF
- Vial capping
- Container closure integrity
- CCI
- Primary packaging components
- Helium leakage
- Vial
- Stopper
- Crimp cap
1. Introduction
Parenteral drug products need to be integrally sealed in container closure systems to ensure product quality and patient safety. A commonly used container closure system for vial products includes three primary packaging components that are or may be in direct contact with the drug: a glass vial, a rubber stopper, and an aluminum crimp cap.
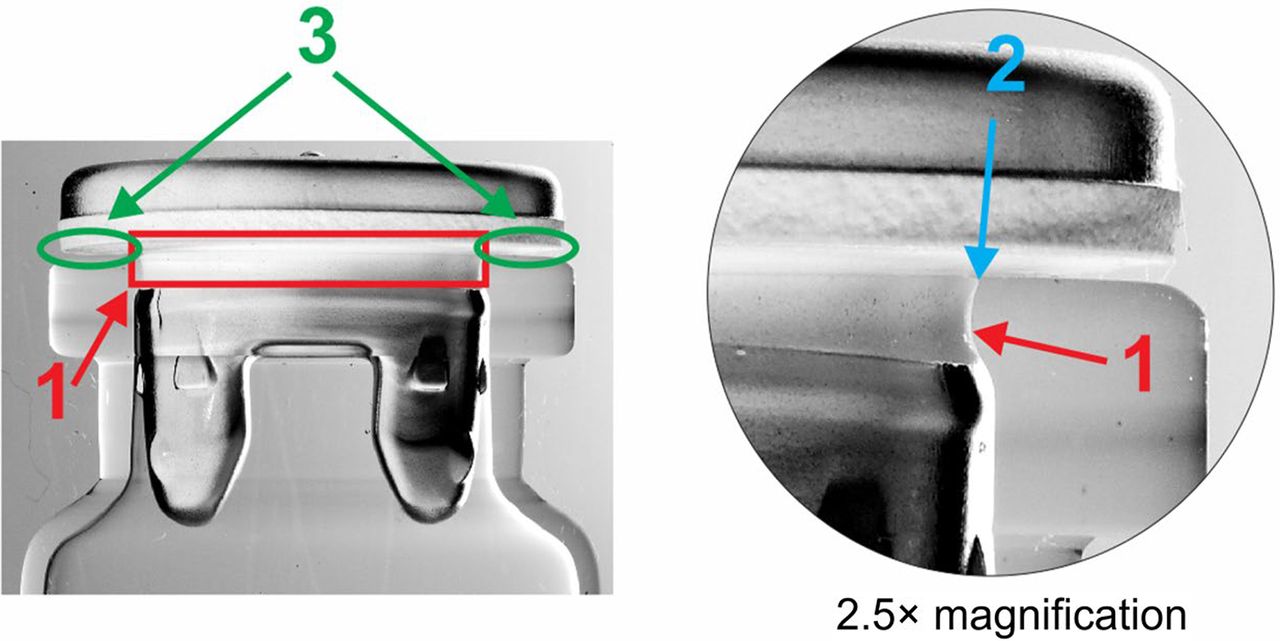
The fit between the stopper and the vial is critical in maintaining an integral seal prior to the capping process. Morton (1) reported that the valve seal on the stopper (shown in Figure 1 as sealing area 1) provides the primary sealing surface for the vial-stopper system. This sealing function is present in both serum and lyophilization stoppers but is particularly important for lyophilized products. Upon completion of a lyophilization run, fully stoppered but uncapped vials must be able to maintain the prescribed level of vacuum prior to being unloaded from the freeze-dryer. Although the valve seal can offer protection in a clean-room manufacturing environment, it may not be sufficiently robust to endure changes in environmental conditions, i.e., temperature, pressure, and vibration, associated with handling and transportation of the product. Thus, the vial's other sealing surfaces are needed to complement the function of the valve seal and to ensure container closure integrity (CCI) throughout the product life cycle.

The sealing areas of a vial-stopper system: (1) valve, (2) transition, and (3) land sealing surfaces of the configuration.
Application of an aluminum crimp cap (with or without a round, plastic, flip-off button that covers the injection site of the vial) will form additional sealing areas in both the transition and the land seal regions (1) (shown in Figure 1 as sealing areas 2 and 3, respectively) by maintaining a compressive force on the elastomeric stopper against the vial finish. These sealing surfaces provide a vial-stopper assembly with a robust and redundant protection in the event of minor defects, which potentially compromises one or more of the sealing surfaces. A robust land seal is known to be particularly important for a capped vial with minor glass imperfections (1). The extent of compression that the stopper experiences after crimp capping can be measured as the residual seal force (RSF) (2⇓⇓–5).
Currently, only qualitative visualization methods are available to assess the fit between a stopper and a vial (6). There is a need to develop a nonsubjective method that can quantify the capping process in the manufacturing setting to ensure CCI. RSF appears to be the sole quantifiable parameter that can help ensure the consistency of the crimp capping process. Recently, several RSF-related studies were published and explored (a) how capping affected RSF and CCI (7); (b) key capping parameters that greatly influenced RSF (8); (c) the correlation between RSF, torque moment (turning of the aluminum crimp cap), and button flip-off removal force (9); and (d) the time- and temperature-dependent nature of RSF and its impact on CCI (10⇓–12). Overall, these studies suggested that RSF measurement is a convenient quantitative method that may enable standardizing crimp seal quality across various capping equipment. However, a large set of manufacturing-scale RSF data has not yet been published, and their variability is unknown. Because recognizing RSF variability would allow reasonable and meaningful RSF limits to be set for capping operations, this study presented a large set of manufacturing data to help dissect the source of variability.
The ultimate goal of capping is to achieve long-lasting CCI of the container closure system. Thus, the relationship between RSF and CCI should be understood to allow the use of the RSF tester during routine commercial manufacturing. Visual and manual inspection of the container for cosmetic defects on the crimp, incomplete crimps, and loose caps (easily rotated manually) is currently performed in the good manufacturing practices (GMP) setting to infer the establishment of CCI. There is, however, no direct evidence suggesting that these defects will compromise CCI. For example, the turning of the aluminum cap can be a quantifiable parameter via torque moment measurement using a torque meter, but it is typically checked manually, resulting in no quantitative readout. Previous studies have correlated vial torque moment to RSF (9); however, vial torque moment's relation to CCI has not been studied. Correlating RSF to helium leakage (He-leak), the most sensitive physical CCI (pCCI) method, has proven to be challenging. A study in 2010 was able to show a correlation between RSF and CCI by demonstrating that vials with lower RSF values resulted in a higher rate of CCI failure (measured by high-voltage leak detection) (12, 13), while more recent studies have shown that all vials pass He-leak testing regardless of RSF (7). This poor correlation of CCI to RSF may be due to recent improvements in design and fabrication of primary packaging components, resulting in superior sealing characteristics (i.e., the valve, land, and transition seals) of a container closure system (CCS). Our study presents another attempt to correlate RSF with CCI.
Currently, there is no high-throughput in-line RSF measurement equipment available. Therefore, in practice, it is possible to conduct measurements only on a relatively small number of vials. To be a feasible tool for capper setup in a manufacturing environment, acceptable RSF ranges must be defined. For this, it is first necessary to understand the variability of RSF measurements. This study dissected possible sources of variability in RSF measurements by studying the capping process, the RSF tester measurement process, time dependence, and the components.
By recognizing the inherent variability of RSF measurement, quantifying the capping process became feasible in this study. Furthermore, this investigation provided scientific insights into the relationship between RSF and CCI. Based on these understandings, a simplified statistical model has been used to establish statistically acceptable lower RSF limits. This is a first-pass attempt at a nonsubjective methodology for quantifying the capping process.
2. Materials and Methods
2.1. Primary Packaging Components
Materials used in this study are specific to Roche and have tolerances (not disclosed) that are tighter than off-the-shelf components based on International Organization for Standardization (ISO) specifications. Roche components have been developed and refined over many years and are extensively tested before use as part of our raw material release process to ensure specification compliance. Furthermore, the stopper pop-up issues have been eliminated, thanks to both vial and stopper designed with proper interference fit tolerance, a no-pop ring feature on the stopper that engages into the vial's blowback and prevents stopper movement once the stopper is fully seated.
The primary packaging components used in laboratory capping included 20 mL type 1 glass vials (Schott Schweiz AG, St. Gallen, Switzerland), 20 mm D777-1 serum and lyophilization rubber stoppers (Daikyo Seiko, Tokyo, Japan) in a ready-to-sterilize format, and 20 mm aluminum seals with plastic flip-off buttons (West Pharmaceutical Services, Inc., Exton, PA, USA). The vials were washed and depyrogenated prior to use; all other components were used as received.
Glass vials of three sizes (2, 15, and 20 mL; Schott Schweiz AG) and stoppers of two sizes (13 and 20 mm; Daikyo Seiko) were used in commercial capping studies. Details of the vial configurations are provided in Table I.
Configurations of Vials and Statistical Data Generated from a Commercial Capper
These commercial capping studies were part of GMP manufacturing validation and media fill runs, in which vials were tested for RSF after being capped with target capping parameter settings.
The vials used for RSF testing included 1439 vials from the 2 mL media fill run (configuration 1), 1142 vials from the 15 mL media fill run (configuration 2), and 1340 vials from the 20 mL media fill run (configuration 3). Some empty vials were capped in a validation campaign and were also used for RSF testing, including 1104 15 mL vials (configuration 4), 1000 20 mL vials (configuration 5), and 1001 20 mL vials (configuration 6).
These vials were capped with 13 or 20 mm D777-1 serum or lyophilization rubber stoppers (Daikyo Seiko) and 13 or 20 mm aluminum seals with plastic flip-off buttons.
2.2. Vial Capping
2.2.1. Commercial Capper:
Vials were capped with a GMP manufacturing capper (Model RVB4090, Bausch & Stroebel, Ilshofen, Germany), which has a capping rate of 24,000 vials/h. Its capping head (carousel) features 16 stations, where each station is equipped with an individual turntable, plunger, and capping plate. Flat capping plates were used.
2.2.2 Laboratory Capper:
Laboratory-prepared vials were capped using an Integra Laboratory Crimper (Genesis Packaging Technologies, Exton, PA, USA). Two capping parameters were investigated: capping precompression force and capping plate-plunger distance. Other capping parameters, such as capping plate geometry and angle, capping plate travel distance, and rotational speed of the plates, were held constant. The definition and function of these capping parameters were previously described (8).
2.3. RSF Measurements
RSF was measured using automated RSF testers (Genesis Packaging Technologies). Testing was conducted as per a previously described protocol (2, 3, 5, 7), except the removal of the flip-off button prior to each measurement. All RSF measurements, except the impact of RSF over time, were performed between 24 hours and 21 days post capping using the two lowest (111 N and 156 N) force levels to account for the variation due to the time-dependent nature of RSF.
2.3.1. Vial and RSF Tester Orientation Study:
Forty vials were labeled, capped, and randomly divided into two even groups, Group 1 and Group 2 (20 vials each). Vials in Group 2 were marked with a line using a standard permanent marker. All capped vials were held for 24 h prior to the first RSF measurement. Subsequent measurements were performed with a minimum of 1 h separation. During each measurement, vials in Group 1 were randomly oriented on the RSF tester base plate, whereas the orientation of vials in Group 2 was fixed, i.e., the vials were oriented in the same position by aligning the line marks between the vial and the RSF tester base plate.
2.3.2. Custom Spring Fixture:
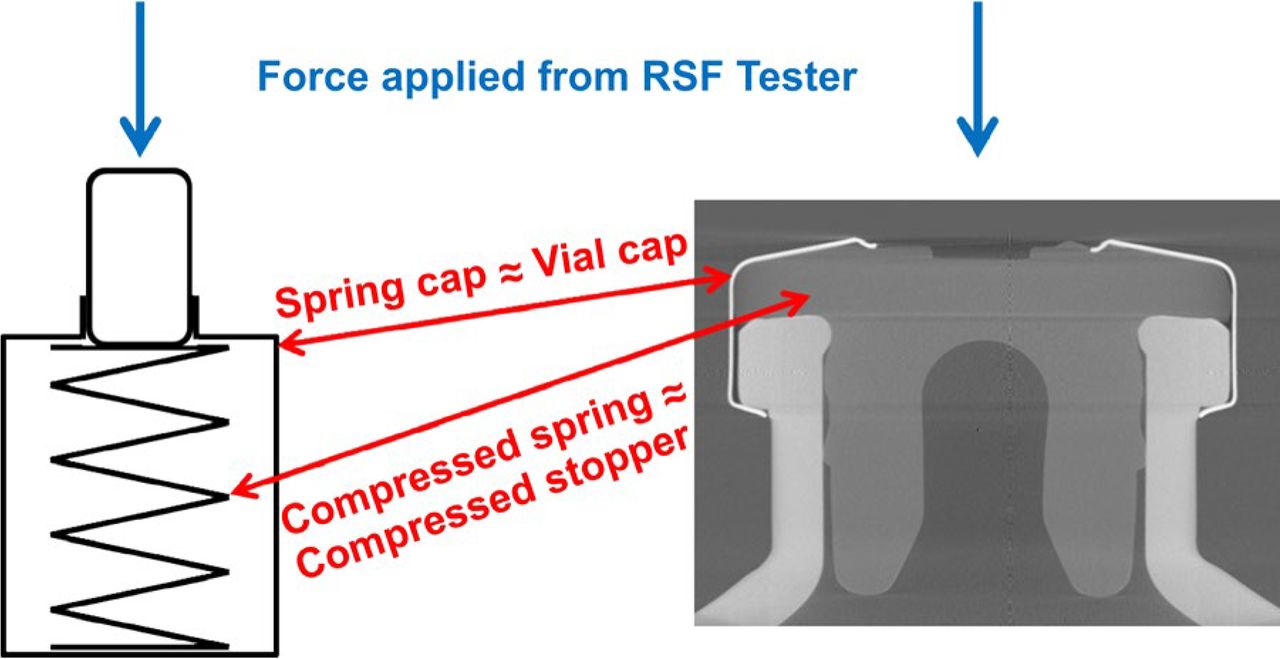
A custom-made precompressed spring fixture (CSF) designed to provide a constant force was used to assess the variability of the RSF tester. A schematic of the CSF is shown in Figure 2.
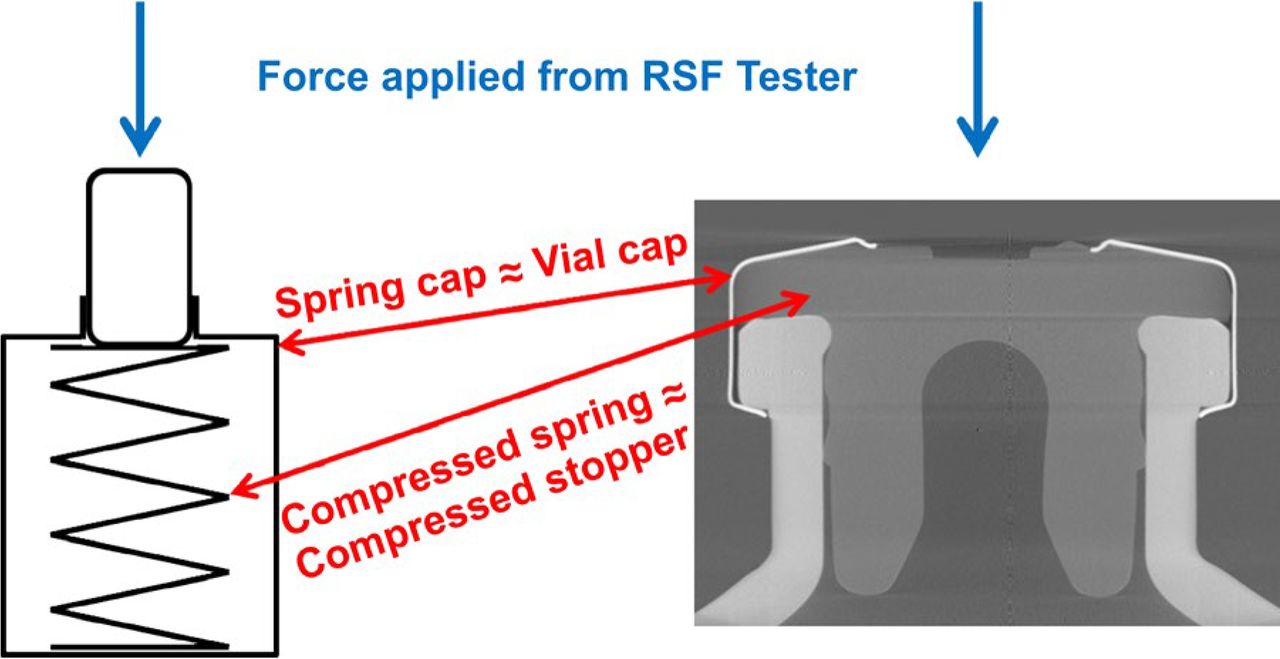
Schematic of the custom-made compressed spring fixture.
2.4. pCCI via He-Leak
A previously published procedure (7, 11) was modified for ease of use and applied in this study. Helium was purged into the capped vial through a slit at the heel of the vial, cut with a diamond cutting wheel. Potential He-leak from the capped area was detected using an ASM340 mass spectrometric He-leak detector (Pfeiffer Vacuum, Asslar, Germany). The leak rate cut-off for CCI failure was set to ≥1.0 × 10⁻⁷ mbar L/s. There were two controls in this test. The positive control featured the creation of an artificial leak by inserting a 100 μm diameter stainless steel wire along the sealing surfaces of the capped vial (14). The negative control was an intact vial (i.e., no opening was cut at the bottom of the vial).
2.5. Vial Sealing Surface Studies
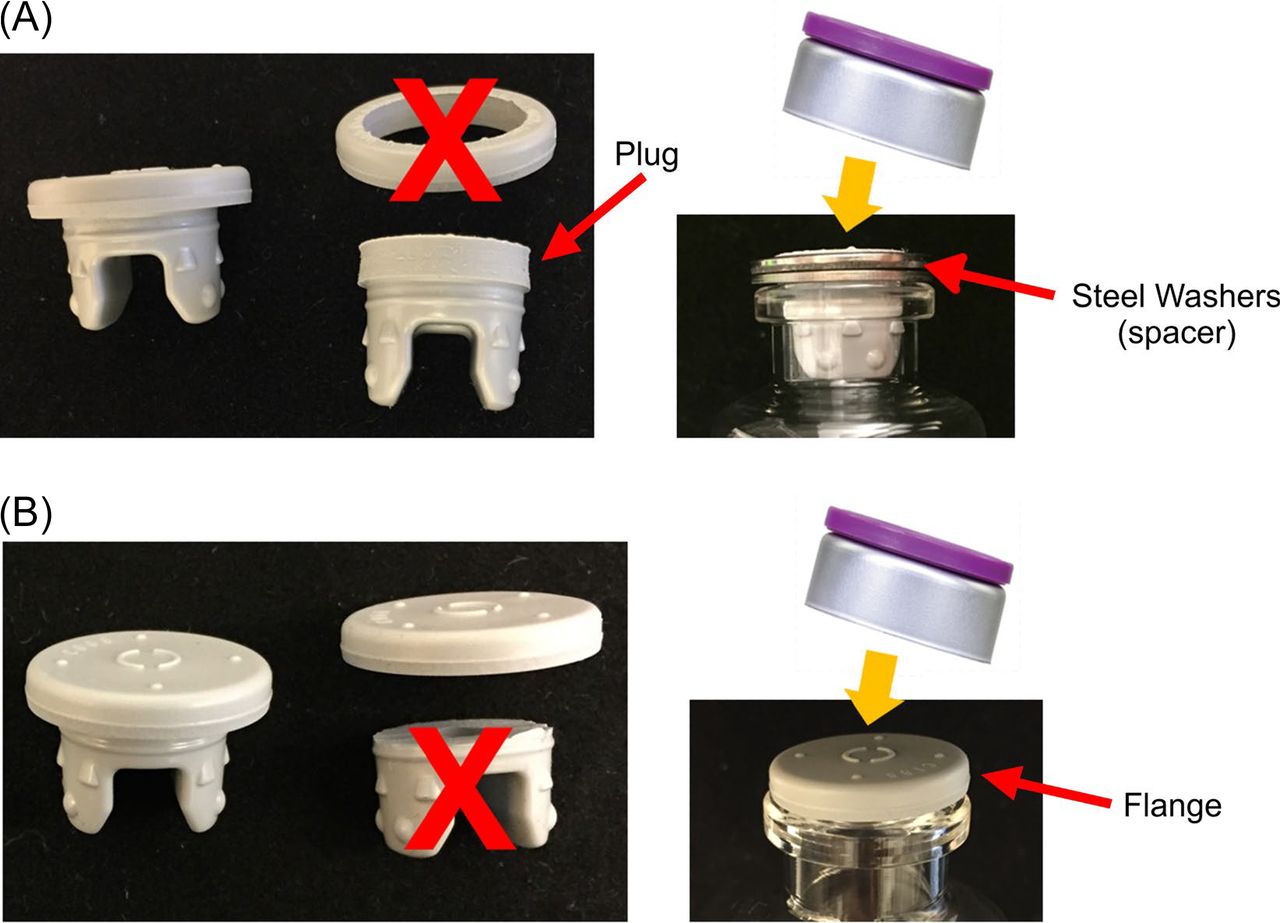
Rubber stoppers were sectioned, as shown in Figure 3, to allow assessing the individual contribution of the valve seal (Figure 3A) and land seal (Figure 3B) to the overall integrity of the stoppered and capped vials.

Modified stoppers used in (A) valve seal and (B) land seal studies.
2.5.1. Valve Seal Studies:
The plug of the lyophilization stopper was punched out from the flange using a No. 149, 14 mm diameter Arch Punch (C.S. Osborne & Co., Harrison, NJ, USA). The plug was inserted into a vial. Two stainless steel washers (1.5 mm thickness × 14 mm inner diameter × 20 mm outer diameter) were placed around each plug at the top of the vial (Figure 3A) as spacers (in place of the flange) during capping to prevent the plug from being displaced when initial compression was applied.
2.5.2. Land Seal Studies:
Serum and lyophilization stoppers were cut using a custom fixture and a sharp blade to separate the plug from the flange. The flange was positioned at the top center of the vial for capping (Figure 3B).
2.6. Statistical Approach for RSF Limit Determination
The approach used a capability assessment calculating a 95%/99% lower-bound tolerance interval (95/99 LBTI) to ensure no more than the first percentile of the vials was lower than the preset RSF limit during the capping machine setup. The LBTI could be calculated based on the RSF distribution of the manufacturing data of a certain vial configuration. For preliminary assessment of this method, the manufacturing data were assumed to be from a normal distribution based on the mean and standard deviation of an ideal manufacturing data set.
Computer simulations were performed, using R software (version 3.2.0 or higher; R Foundation for Statistical Computing, Vienna, Austria). Five thousand simulation cycles were performed for various sample sizes. In each simulation, samples were randomly drawn from the normal distribution, and calculations were performed to determine the number of simulation cycles that failed the 95/99 LBTI requirement.
3. Results and Discussion
3.1. Overview of RSF Data and Understanding Sources of Its Variability
To enable RSF measurements as a viable tool for capping quantification, a large amount of RSF data, particularly from manufacturing-scale studies, is needed to assess reproducibility and variability of the measurements. Because the RSF measurement is a destructive test per our protocol (removal of the plastic flip-off button is required), it is only feasible to test a small number of samples, e.g., during capper setup. The variability of the RSF measurement is therefore an important factor in determining the number of vials that is statistically representative of the entire batch. RSF data for this purpose have not been reported in the literature.
3.1.1. RSF Data Generated From a Commercial Capper:
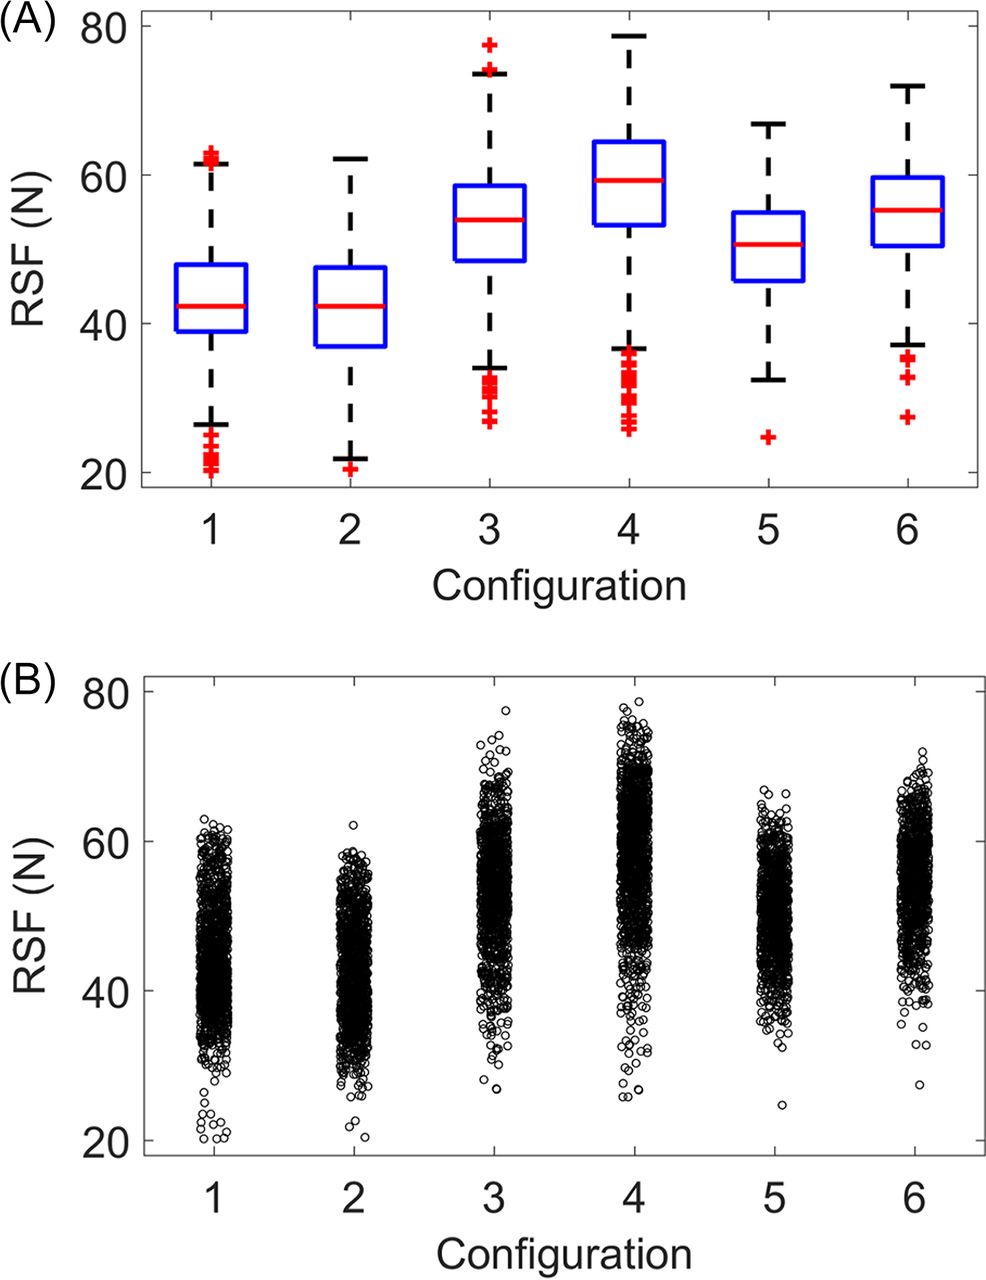
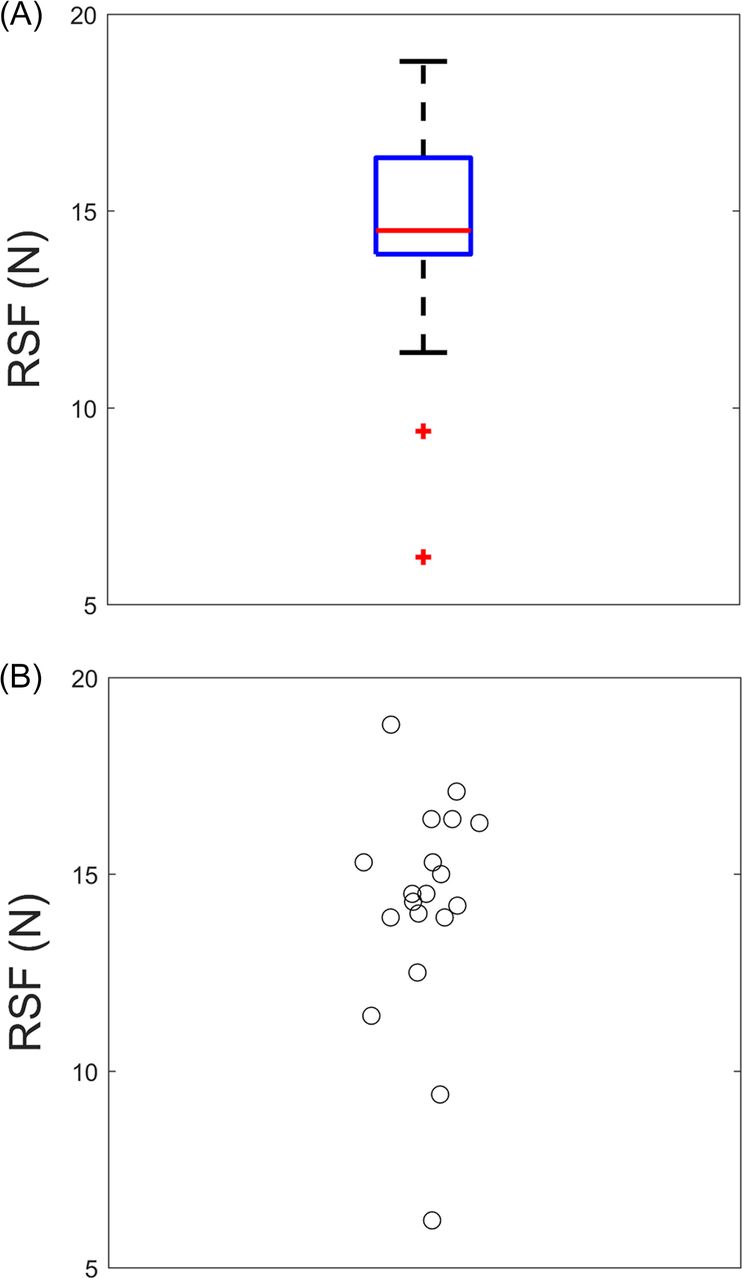
A commercial capper was used to cap six different vial configurations, varying in vial size, stopper size, and stopper type (Table I). The same stopper rubber formulation was used for all configurations. At minimum, 1000 vials were tested in each configuration. Table I lists the mean, percent relative standard deviation (%RSD), and maximum/minimum RSF values measured on the various configurations from the commercial capper. These measurements are graphically presented in Figure 4 as box and scatter plots.

RSF values generated from a commercial capper for six different vial configurations: (A) box plot and (B) scatter plot. All vials of a specific configuration were crimp sealed in the same run.
Highly variable RSF values within and between configurations were observed; %RSD of each configuration fell in the range of 12.2% and 16.7%. The difference between the minimum and maximum RSF values for each configuration ranged from 41.7 N to 52.8 N; the maximum RSF value of several configurations was three times more than the minimum. This level of intra-batch variation (i.e., variability observed between vials of the same configuration) was unexpected and might be attributed to three sources: the capping process, the performance of the RSF tester, and inherent component variability. The root cause is assessed in later sections.
3.1.2. Repeatability of RSF Data Generated from a Commercial Capper:
An additional experiment was performed based on the RSF data generated from a commercial capper (Table I) to assess repeatability of the measurements and operator-to-operator variation. Ten vials were randomly selected from Configuration 4, and the RSF was measured three times by each of three operators. Figure 5 summarizes the results of this experiment.
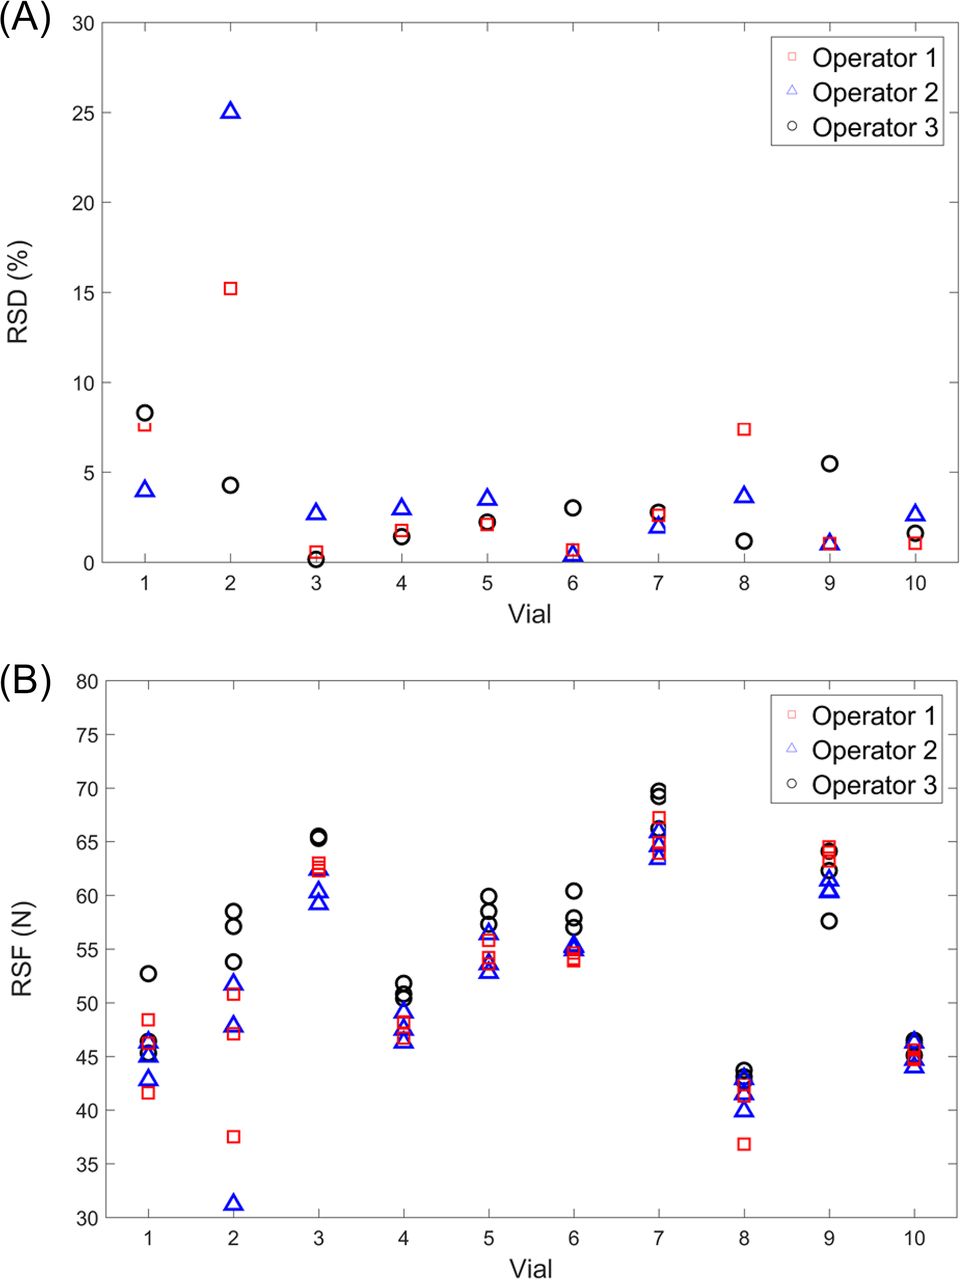
Repeatability and reproducibility of RSF values: (A) %RSD of 10 vials measured by three different operators; (B) each individual RSF measurement of 10 vials by three different operators.
All vials, except Vial #2, showed RSF values with %RSDs below 10% (Figure 5A). For Vial #2, a wide range of RSF values, from 31.2 N to 58.5 N, was observed (Figure 5B), and %RSD for each operator was 4.3%, 15.2%, and 25.0% (Figure 5A). Thus, intravial variation (variability observed between multiple measurements of the same vial) was also demonstrated in RSF measurement and should be further evaluated (see RSF Variability Caused by the RSF Tester).
3.1.3. RSF Variability Caused by the Capping Process:
RSF variation due to the capping operation was evaluated using the Integra Laboratory Crimper, which incorporates a load cell to accurately apply specified compression forces regardless of slight variations in component heights. The crimping head has three spinning discs for tucking the aluminum skirt under the vial flange. This mechanism of capping resembles one of the primary manufacturing capping technologies and is considered superior to other laboratory cappers based on the jaw-style crimper (15).
Thirty vials were capped to assess the variability. All measured RSF values had a mean of 56.6 ± 6.3 N and %RSD = 11.1%. This level of variability is comparable to that generated by the commercial capper, though with a slightly lower %RSD, which might be attributed to the Integra Laboratory Crimper single capper head, whereas the commercial capper has multiple capper heads. Nonetheless, the RSF data suggested that the Integra Laboratory Crimper is appropriate for RSF variation evaluation.
Mathaes et al. (8) thoroughly described the relevant process parameters associated with the capping process, and they identified the capping plate-plunger distance (CP-PD) as most critical. In our study, we evaluated the impact of three parameters on RSF measurement variation: (a) CP-PD, (b) roller axis travel distance, and (c) initial compression force. The Integra Laboratory Crimper was modified to allow a CP-PD adjustability with a precision of ± 0.005 mm, a substantial improvement over the original factory precision of ± 0.013 mm. With this small tolerance, CP-PD is an unlikely source of the observed RSF variation.
To test if the tolerances in roller axis travel distance would influence RSF, a univariate study was performed in which all parameters were held constant except for the roller axis travel distance. The travel distance has a vendor-specified standard deviation of 0.18 mm. Thus, targets of 13.8 mm, 14.0 mm, and 14.2 mm were set such that any two data sets were at least one standard deviation away from each other. Figure 6 shows the resulting RSF data in a bar graph and a box plot. The means, standard deviations, and %RSDs of RSFs for roller axis targets of 13.8 mm, 14.0 mm, and 14.2 mm are 58.3 ± 7.1 N (%RSD = 12.2%), 59.2 ± 6.6 N (%RSD = 11.1%), and 60.2 ± 6.4 N (%RSD = 10.7%), respectively. The results suggest that these three data sets are statistically similar and that the roller axis travel distance does not greatly influence RSF.
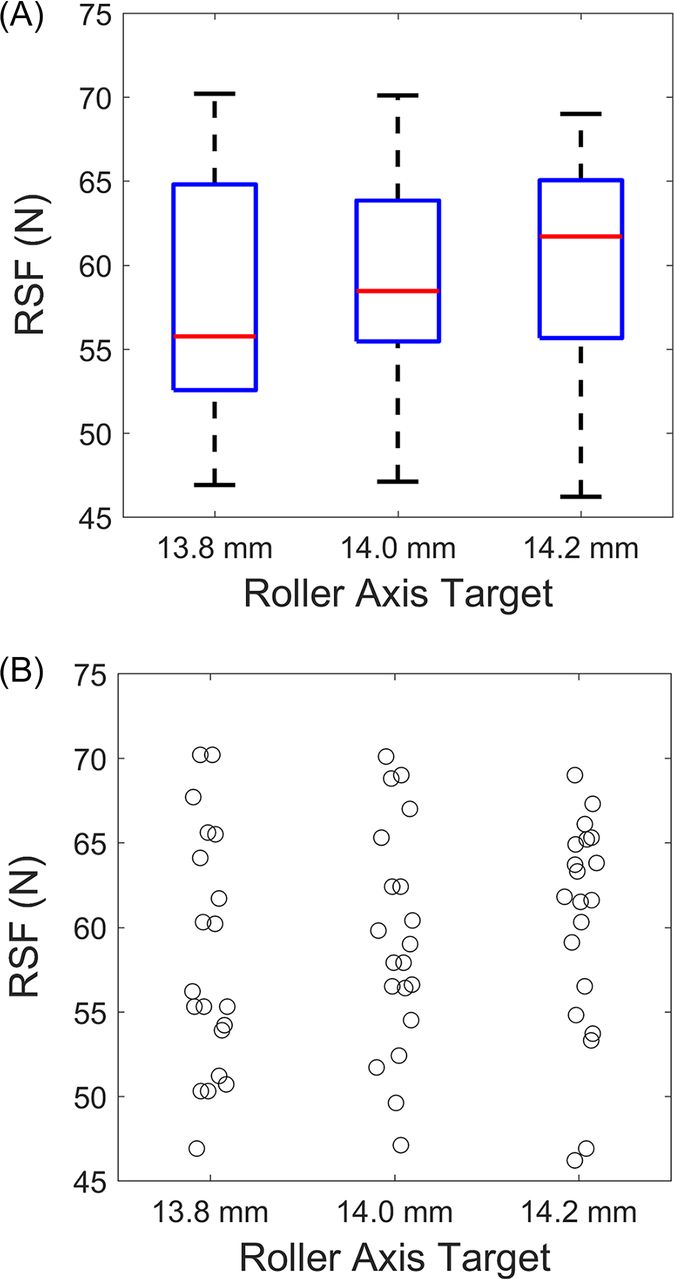
Influence of roller axis travel distance on RSF: (A) box plot of three different roller axis targets shows no variation between the data sets and (B) scatter plot of three different roller axis targets.
Finally, a digital force gauge was used to assess if the initial compression forces applied by the Integra Laboratory Crimper were consistent. Three initial compression force targets of 44.5 N, 66.7 N, and 89.0 N were tested. These targets spanned a wide range allowed by the laboratory capper. There were very minor differences (i.e., a %RSD of <1% for all RSF values) in initial compression forces across the ranges studied, confirming that these changes are not likely to be a major contributor to the observed variability in vial RSF values. This is consistent with the conclusion reported by Mathaes et al. (8), who had performed a univariate study evaluating the influence of initial compression forces of a commercial capper and found little influence on RSF. Overall, the capping process is unlikely the major contributor to the variability observed in RSF values.
3.1.4. RSF Variability Caused by the RSF Tester:
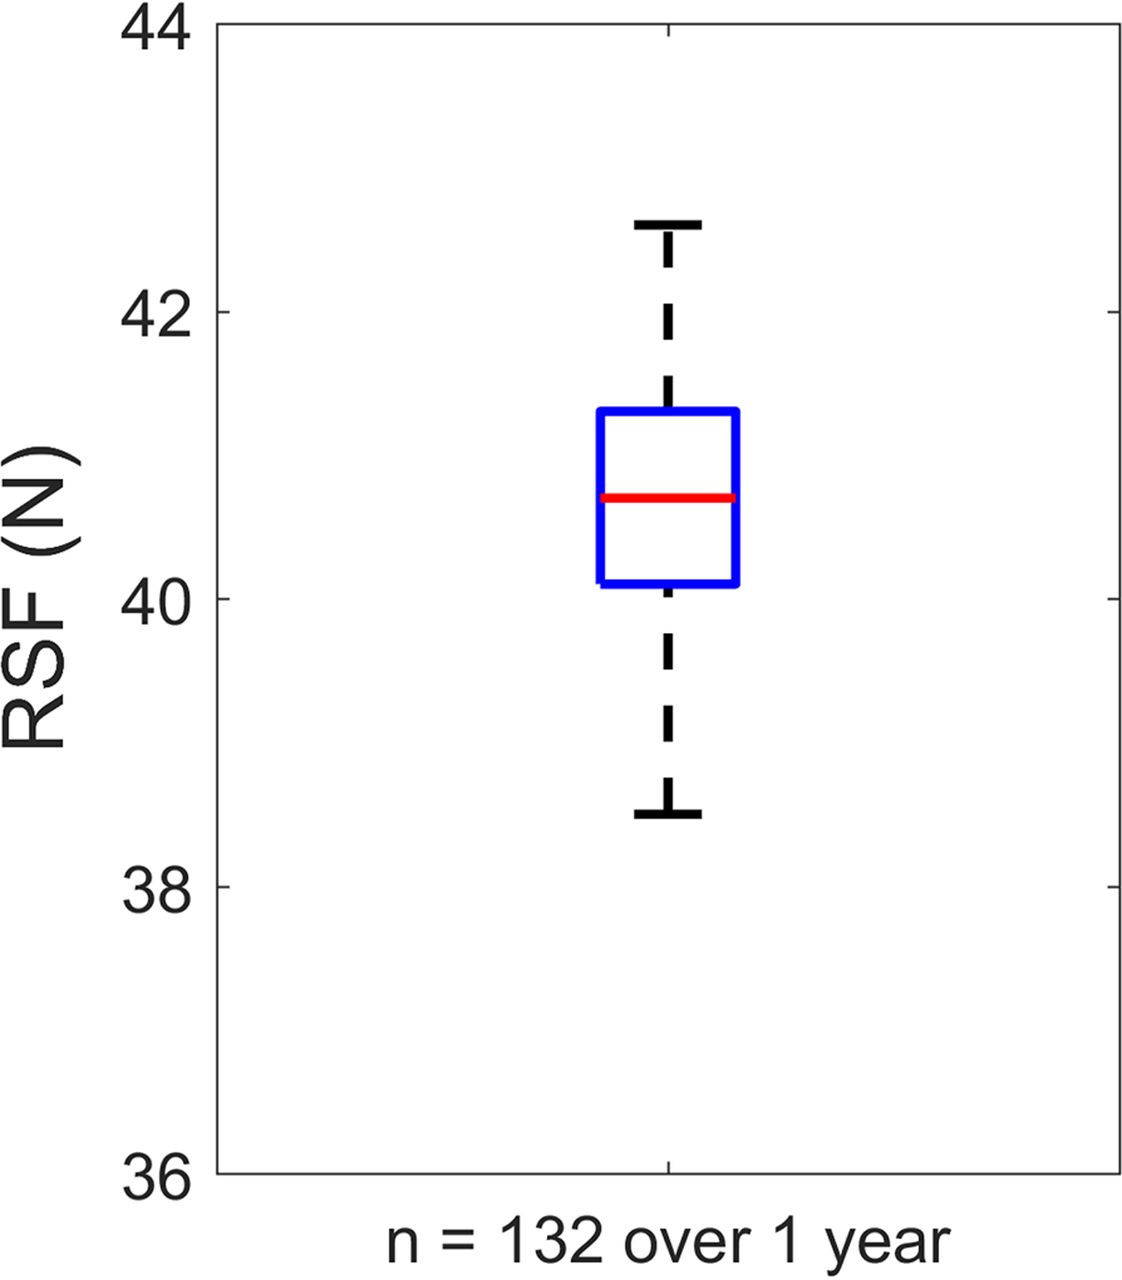
The RSF tester uses an internal mathematical algorithm for determining an RSF value from applied force versus distance data it collects as part of a measurement sequence. To evaluate the performance of the RSF tester, we designed and fabricated a CSF (Figure 2). The CSF provides a force versus distance curve similar to that of a capped vial but with a defined spring precompressed in a fixture with fixed dimensions, thereby allowing the performance/variation of the RSF tester to be assessed. In the ideal situation, the CSF and the RSF tester would generate identical RSF values in every measurement.
The repeatability of the CSF to produce our target RSF of approximately 40 N is illustrated in a scatter plot (Figure 7) for the RSF values measured 132 times over the course of one year. The minimum and maximum measured values were 38.5 N and 42.6 N, respectively. The spring fixture has a %RSD of 2.1%, and there was no change in spring performance over time. A minor variation was seen in RSF values, which was, however, well below the degree observed in vials. It suggested that the RSF tester, while possibly a contributing factor, may not be the main cause of the observed variability in RSF data from vials generated from the commercial capper.

Custom-made compressed spring fixture measured on the RSF tester 132 times during one year displays little variation.
3.1.5. RSF Variability Caused by the Time-Dependent Factor (of the Elastomer):
It has been previously reported that RSF values may be time-dependent (2, 10, 11, 12); this effect is caused by the stress–strain relaxation of a stopper under compression (2). A time-course study was performed to assess the time-dependent nature of RSF with our selected CCS. Twenty vials were capped and measured for RSF after 1 min, 10 min, 90 min, 1 day, 7 days, and 21 days post capping. Results are summarized in Table II. For this specific CCS, stress–strain relaxation of the stopper occurred primarily within the first few minutes. RSF decreased by only 1.9 N between 10 min and 1 day and by 1.6 N between 1 day and 21 days. Based on these results, RSF measurement performed 1 day after capping should not contribute to RSF variation owing to the stopper rubber's stress–strain relaxation. However, the same conclusion may not be necessarily applicable to other CCSs.
Statistical Data Generated for 20 Vials from the RSF Time Course
3.1.6. RSF Variability Caused by Primary Packaging Components:
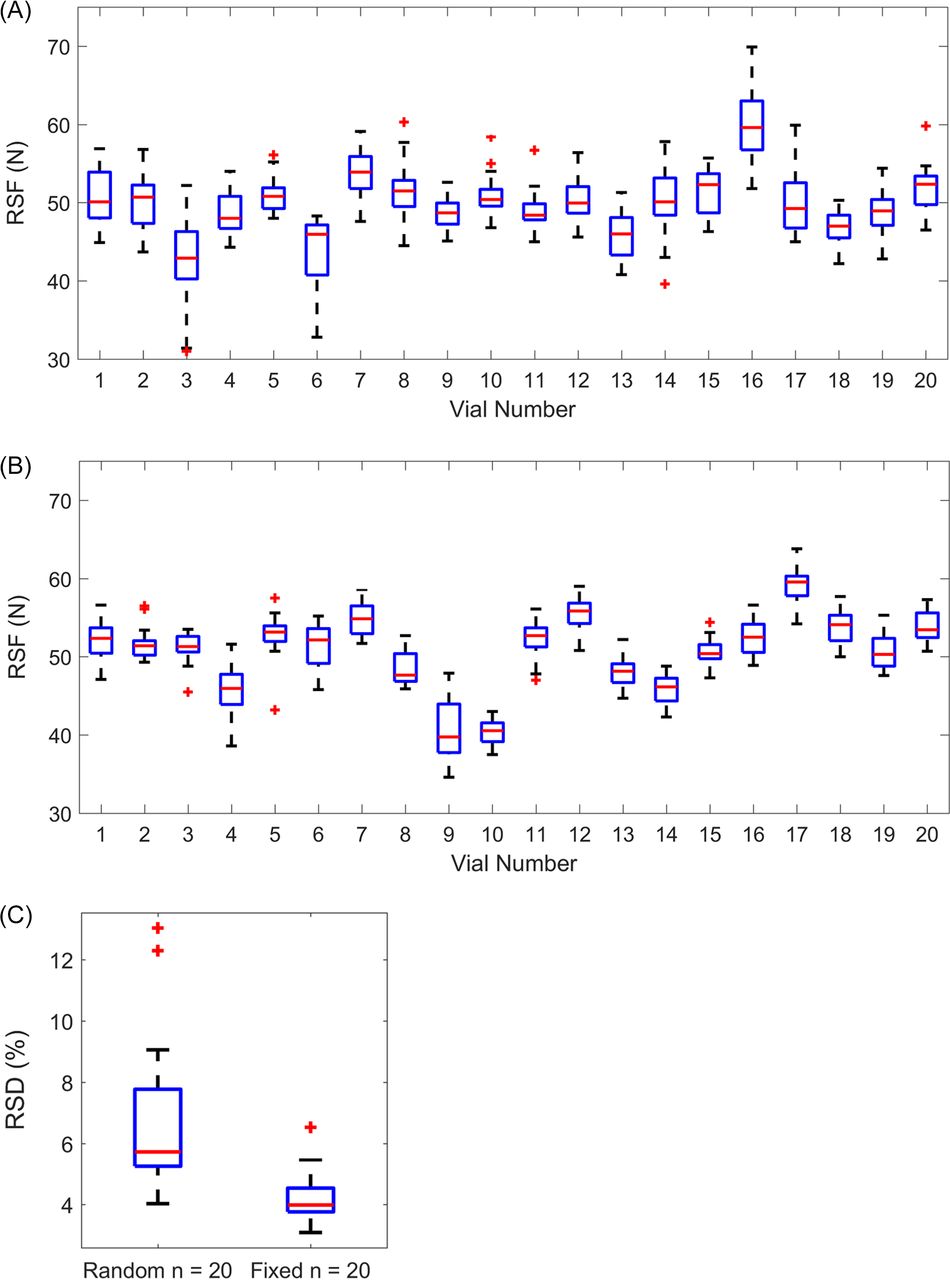
Manufacturing of primary packaging components allows some tolerances to specifications. This study evaluated whether these tolerances would cause RSF measurement variation. Briefly, the effect of vial placement on the RSF tester was assessed by measuring vials in both random (Group 1) and fixed (Group 2) orientations. If vials and stoppers exhibit sufficient tolerances/offsets in dimensions and uniformity, it can be hypothesized that vials in the random oriented group will exhibit greater intravial variation compared to the group with fixed orientation.
Each group contained 20 vials, and the RSF of each vial was measured 20 times. The results of these measurements are shown in Figure 8. The RSF values are summarized as box plots in random orientation (Figure 8A) and fixed orientation (Figure 8B). The %RSD for each vial is plotted in its respective group as a box plot (Figure 8C). Approximately half of the randomly oriented vials showed statistically greater variation than vials with fixed orientation. This suggested that the randomly oriented vials generally display more intravial variability, which might not be noted in a single measurement.

Effect of vial placement on RSF measurement: (A) Group 1, randomly oriented vials display greater variation compared with (B) Group 2, fixed orientation of vials when measured on the RSF tester as seen in (C) box plot of the %RSD plotted for each vial.
In addition, Vial #3 in the randomly oriented group most noticeably showed the worst variability compared with the other vials. Of the 20 RSF measurements on Vial #3 (Table III), the difference between the maximum RSF (52.2 N) and the minimum (31.0 N) was 21.2 N. This level of variation also occurred in the repeatability study using the commercial capper (see RSF Data Generated from a Commercial Capper) where one of the 10 vials (Vial #2 in Figure 5B) also showed a large difference of 20.3 N between the minimum and maximum RSF values. The likely cause for the large differences in RSF values for these vials is the inherent variations of the primary packaging components (e.g., general component dimensions, flatness and uniformity of the sealing surfaces, shape uniformity of the aluminum skirt). These variations can lead to slight differences in the way the components fit together when assembled. For example, if the cap is larger than the optimum diameter, it may not be placed perfectly centered over the stopper and vial, resulting in a nonuniform compression of the stopper across the top surface after crimping. Measuring the same vial multiple times where the position of the vial is not fixed can result in vastly different RSF values when the offset of components is at an extreme. When the offset is not at an extreme (most of the time), the degree of intravial variability will not be as noticeable; this is seen in about half of the random oriented vials, as they are indistinguishable compared to the fixed oriented vials. It is also important to note that the randomly oriented data set closely resembles what would be observed in commercial manufacturing, and the variation must be considered when setting RSF limits. Finally, this variation is a function of the components used; some vial configurations may exhibit more or less variation than what is reported herein.
Individual RSF Measurements from Vial #3 in the Randomly Oriented Group
3.2. Relationship between RSF and Physical Container Closure Integrity (pCCI)
The ultimate goal of capping is to achieve CCI. Thus, the relationship between RSF and CCI should be understood. He-leak is currently the most sensitive method of assessing pCCI. The ability to correlate RSF to He-leak would provide guidance on setting acceptable RSF limits. Intuitively, low RSFs may correlate with high failure rates of He-leak. For verification, 20 vials were capped at low RSF (less than 20 N) and tested for He-leak. The box plot and scatter plot of the RSF data (Figure 9) show that all vials passed the He-leak test (i.e., having a leak rate <1.0 × 10⁻⁷ mbar L/s). This is not a surprising outcome. In theory, components (stopper and glass vial) with an optimal fit can achieve CCI even without capping (i.e., only the insertion of the stopper), while components having suboptimal fit may fail CCI when capped at low RSF (13). Thus, components with optimal fit need to be made suboptimal to demonstrate whether CCI can be affected by RSF. The valve seal on the stopper (Figure 1) provides the primary sealing surface of an uncapped vial-stopper system (1). In this study, stopper fit was made suboptimal by purposely damaging the stopper, which allowed the function of the valve seal and land seal to be assessed separately.

He-leak testing: (A) box plot and (B) scatter plot of RSF values for vials capped under very low compression; all vials passed He-leak testing.
3.2.1. Valve Seal:
The valve seal, provided by the plug of the stopper, was isolated by cutting off the land seal area (i.e., the flange) from a lyophilization stopper. A stainless-steel spacer was inserted in the top of the plug to prevent the plug from being dislodged during capping (Figure 3A). Vials in this configuration do not have an RSF because they lack the land seal. Twenty vials of this configuration were tested by the He-leak. All vials showed a leak rate <1.0 × 10⁻⁷ mbar L/s (passed the test). This data set confirmed that for lyophilization stoppers, the valve seal is the primary sealing area for CCI even when the stopper is not under measurable compression (RSF value of 0 N). The valve seal is extremely important for lyophilized products, as the seal can maintain vacuum in the vial and prevent contamination prior to crimp capping. Therefore, stoppers with well-fitting valve seals would hinder the identification of the correlation between RSF and CCI.
3.2.2. Land Seal:
The land seal, provided by the flange of the stopper, was isolated by cutting off the plug from a lyophilization stopper (Figure 3B). This essentially transformed the stopper into a line seal.
One hundred vials (without the valve seal) were capped with RSFs ranging from 6.2 N to 26.6 N and tested for the He-leak. Forty-five of these vials failed the test with a leak rate >1.0 × 10⁻⁷ mbar L/s. Figure 10 (plotting of increasing RSF with He-leak pass/fail data) displayed a correlation between RSF and He-leak: the lower the RSF, the more likely the vial would leak. All vials with an RSF <10.2 N failed the He-leak test, while all vials with RSF >20.1 N passed the CCI test.
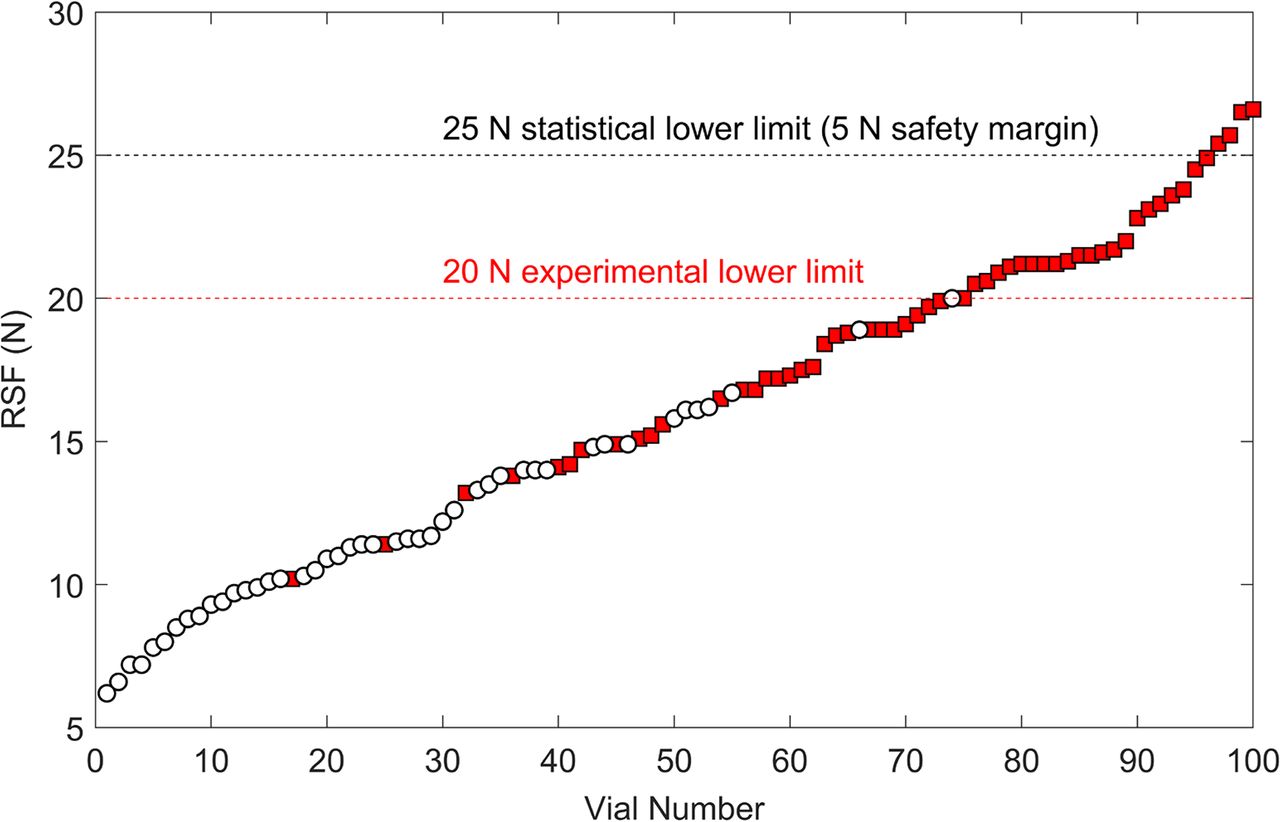
Correlation of RSF and CCI: 100 vials with only the land seal display an RSF to CCI correlation with 20 N as the experimental lower limit and 25 N as the statistical lower limit. Circles represent individual vials that fail He-leak testing and squares represent individual vials that pass He-leak testing.
The lowest RSF value where all vials passed the He-leak test provides scientific justification for setting a lower limit during capper setup and is one of the main objectives of this study. This limit would allow every vial to produce a robust land seal, which can ensure CCI even if there are poor valve seals owing to minor stopper/vial defects. Many factors may affect the selection of the lower limit, as described in Statistical Approach to Test a Lower RSF Limit. In addition, this limit will depend on the primary packaging components and needs to be established for each configuration. Each configuration has its own format of sealing area. Examples of these formats are as follows: serum versus lyophilization stopper, 13 mm versus 20 mm stopper, different stopper geometries and formulations, different vial flange geometries, and different cap geometries. An upper RSF limit is also important for CCI. Capping with excessive RSF, i.e., over-compressing, could result in various cosmetic defects. These defects, while not always affecting CCI, would cause yield loss and should be avoided. The scientific approach to select an upper RSF limit is out of the scope of the present study.
3.3. Statistical Approach to Test a Lower RSF Limit
The RSF tester is not an inline testing tool because it lacks high-throughput capability. Also, RSF measurement is a destructive method. Thus, the value of an RSF tester may lie in facilitating the setup of capping equipment before the capping operation begins. Because RSF measurements are inherently variable, a statistical approach designed to enable capper setup by measuring RSFs of a small sample of vials against a low RSF limit as an acceptance criterion was proposed. This approach considered four factors: (a) the statistical distribution of manufacturing RSF data of a desired configuration; (b) the lower RSF limit based on the correlation of RSF to CCI; (c) the vial sample size tested during capper setup; and (d) the acceptable rate of failing the 95/99 LBTI.
Although a low percentage of vials having an RSF below the acceptable limit in a manufacturing lot is allowed, the probability of these vials failing CCI is extremely low. As discussed earlier, vials with RSFs below the limit only represent a possible failure in the land seal, while a compromised CCI requires the failure of both the land and valve seals.
Currently, there is no harmonized approach for capper setup. Each manufacturing site may have its own internal procedure to set up capping parameters based on quantitative assessment and inspection of capped vials. During qualification of the capper and establishing capping parameters, CCI testing is also performed; however, there is no quantitative and little statistical justification that the capped vials are representative of the entire batch. The approach proposed here allows the operator to adjust the capper during the equipment setup phase to produce vials with increased RSF mean value for a small test sample set. As a result, this might decrease the rate of possible CCI failures, ensuring the whole distribution is shifted higher (possibly at the risk of increasing the number of cosmetic defects at the higher end of the RSF distribution).
A simulation study consisting of 5000 iterations was performed on the RSF data generated from the commercial capper (Figure 11). For simplicity, the simulation was executed assuming a normal distribution. We acknowledge that assuming a normal distribution may not be representative and the type of distribution will be configuration dependent, it is done here for demonstration of the overall methodology. Each iteration began by drawing samples of a given sample size (10, 20, 30, 40, 50, or 100) from the distribution, followed by calculating the 95/99 LBTI with 25 N as the low RSF limit (based on the RSF/CCI correlation shown in Figure 10). The involved statistical parameters for simulation are summarized in Table IV. The outcome of the simulation revealed the relationship between sample size and the failure rate (Table V). For example, for the smallest sample size (i.e., 10 vials), the failure rate is high (42.73%), whereas the failure rate is much lower (<0.02%) if 100 vials (the largest sample size) are selected.
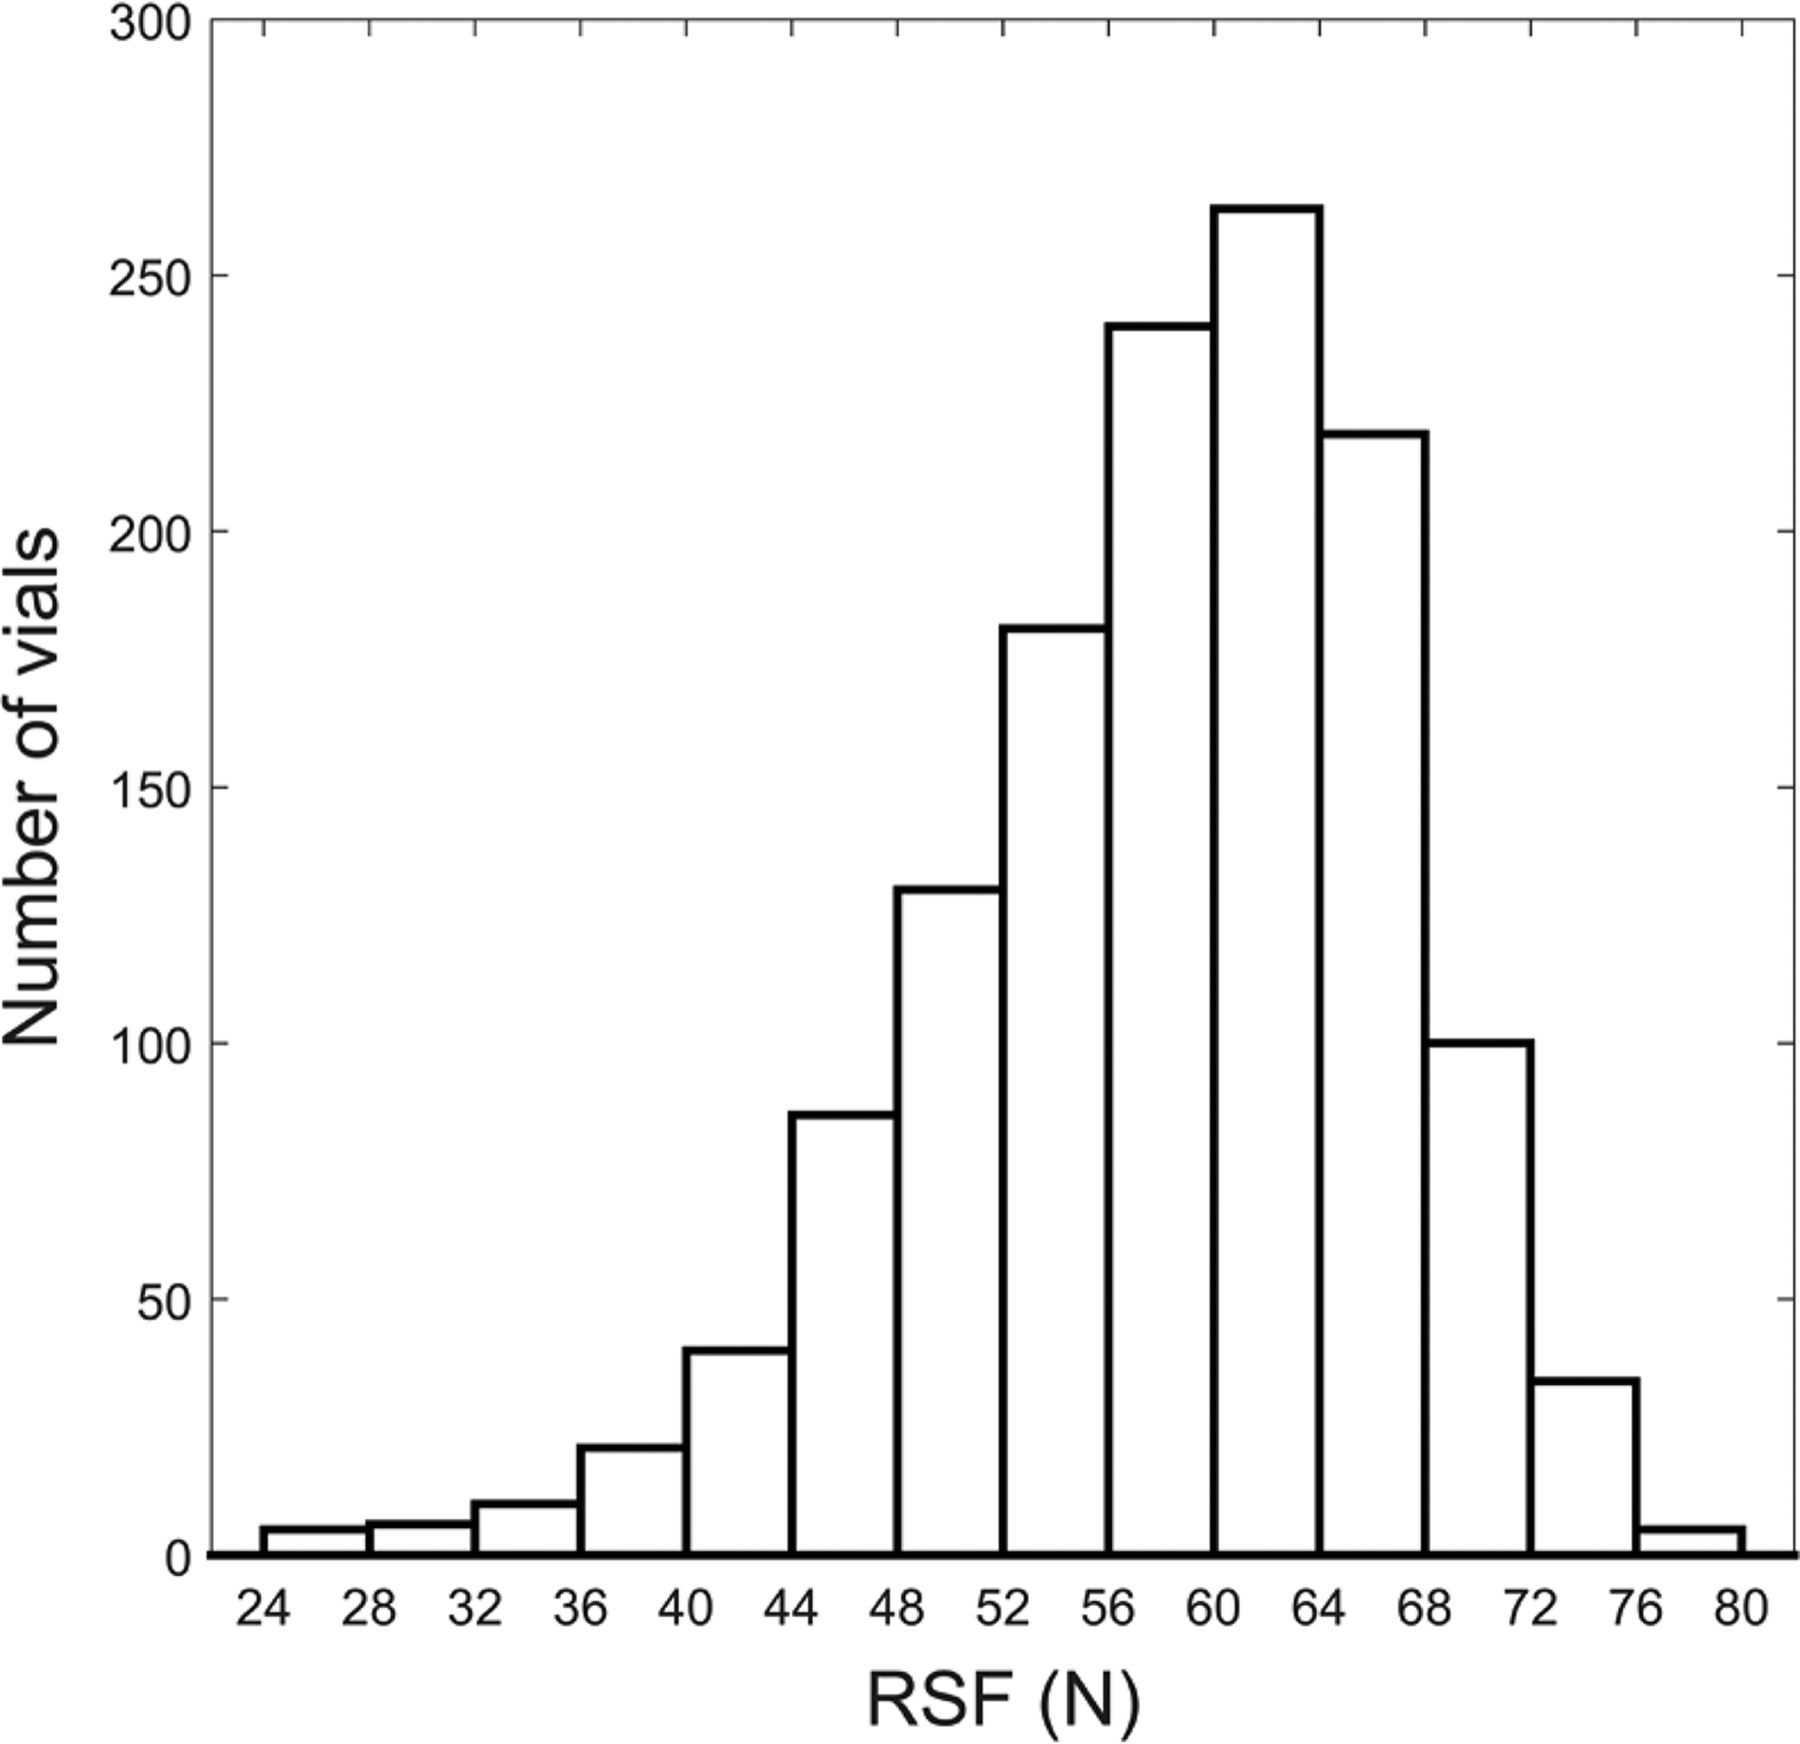
Histogram presentation of RSF values from Configuration 4 commercial capper.
Simulation Parameters Using RSF Data Generated from the Commercial Capper (Configuration 4)
Data from Simulations
The selection of sample size for capper setup is the choice of risk taking. During capper setup, capping parameters are established through an iterative process. Vials of the predetermined sample size are capped and their RSFs are measured. If the 95/99 LBTI for these RSF values is less than the RSF setup limit (e.g., the calculated 95/99 LBTI was 23.15 N, which is less than the RSF limit of 25 N), capping parameters will be adjusted to target for a greater RSF. The process repeats until the 95/99 LBTI value exceeds 25 N. With this approach, a quantifiable capping process is established with a high level of confidence that all capped vials will achieve CCI.
The described approach represents a simplified case, primarily because it assumes that manufacturing RSF data are normally distributed. This simplified model was intended to demonstrate the approach of setting a lower RSF limit. Factors not considered in this study included (a) RSF tester measurement variability; (b) the effect of a capper with multiple capper heads; (c) the impact of the design of different commercial cappers; and (d) the time at which RSF is measured after capping. Taking these factors into consideration will further enhance the confidence of prediction and will be addressed in future studies.
4. Conclusions
RSF proves to be the sole quantifiable output that can aid capper setup, but measured RSF values from both laboratory and at-scale cappers produce samples that exhibit a substantial spread. This scatter could be attributed primarily to inherent component variability with additional contributions from the variation of the RSF tester, the impact of time-dependent nature, and capper instrument performance. A correlation between RSF and CCI was demonstrated in modified stoppers where only the land seal was present. From this correlation, a lower RSF limit could be established via a statistical analysis covering all worst cases. This study provides insights into developing a practical and meaningful method to set RSF low limits for capper setup based on a direct correlation to CCI.
Conflict of Interest Declaration
The authors declare that they have no competing interests.
Acknowledgments
The authors would like to thank Roger Asselta and Vince Paolizzi of Genesis Packaging Technologies for their technical expertise on the Integra Laboratory Crimper and the RSF tester, as well as Genentech's Device Development Group for the support in computed tomography imaging.
- © PDA, Inc. 2019


Jump to section
Related Articles
Cited By...
- A Container Closure Integrity Test Method for Vials Stored at Cryogenic Conditions Using Headspace Oxygen Analysis
- Container Closure Integrity of Vial Primary Packaging Systems under Frozen Storage Conditions: A Case Study
- Container Closure Integrity Test Method Development on Vials Stored at -80{degrees}C Using Headspace Carbon Dioxide Analysis
- A New Integrated Modeling Approach with Case Studies for Gas Transmission of Container Closure Headspace
- Quantifying the Vial-Capping Process: Reexamination Using Micro-Computed Tomography
- Long-Term Study of Container Closure Integrity of Rubber-Glass Vial Systems by Multiple Methods
- Time Temperature Superposition Evaluation and Modeling for Container Closure System's Seal Performance at Low Temperatures
- Balancing Container Closure Integrity and Aesthetics for a Robust Aseptic or Sterile Vial Packaging System