
Abstract
This paper presents a useful method using total organic carbon analyzers employing both combustion and wet oxidation for validating equipment cleaning procedures and verifying cleaning in a pharmaceutical pilot plant. The results are compared with those obtained using high-performance liquid chromatography. The study summarizes the initial steps that should be taken into account and focuses particularly on the solutions to some of the most critical considerations (e.g., glass material, detection and quantification limits, recovery). Also described are the calculation of control limits and the good results obtained.
1. Introduction
Cleaning is one of the critical processes in pharmaceutical manufacturing. Equipment contamination may come from any of the materials that have been in contact with the equipment surfaces. It is critical to avoid carryover of trace amounts of either active or other materials from one batch to another in order to avoid cross-contamination of the subsequent product. For that reason, equipment used in pharmaceutical manufacturing must be cleaned meticulously (1, 2), and the cleaning procedure used must be validated (3–5). In the specific case of a pharmaceutical pilot plant (6–8), the fulfilment of current good manufacturing practices (cGMPs) can be difficult, as the processes carried out in the plant will differ considerably from those used in industrial production. In a pilot plant active product ingredient (API) differs for each project, a combination of different pieces of pilot equipment is used for the same dosage form, the equipment uses variable loads for the equipment, the formulation of a single product still in the development phase may change, complex samples may exist for which no specific analytical method is yet available, and speed and efficiency are necessary in the development of new formulations for new products. So, it seems useful to do a cleaning verification prior to work as it ensures a degree of safety even if the cleaning method has been previously validated.
Besides using officially recognized analytical methods in the cleaning, validation studies (9) are of particular importance in pilot plants due to the specific working conditions and risks presented.
Total organic carbon (TOC) is suitable for use in the validation of cleaning procedures applied in pilot plants but also can be used to demonstrate the efficacy of the cleaning procedure just before equipment operation. TOC analysis is a non-specific method for analytical assessment in the validation of cleaning procedures in the pharmaceutical industry. Table I shows a summary (10) of standard analytical methods and offers a comparison of the different methods based on three parameters: specificity, sensitivity, and cost.
General Reference: Analytical Methods in Cleaning Validation (10)
One advantage of TOC over these traditional analytical methods is its larger spectrum, since it can detect any residue containing organic carbon (this is ideal for detecting residues following pharmaceutical cleaning processes). In addition, TOC analysis is a very sensitive method that can detect analytes in parts per billion(11–13). One of the first studies to apply TOC analysis to cleaning validation was published in 1990 by Baffi et al. (14). This study is notable for its validation of the TOC method (the authors verified linearity, accuracy, recovery, and the precision of measurements of the possible contaminants) and for determining a detection limit of 0.1 ppm and a quantification limit of 0.5 ppm, which were required to demonstrate the absence of trace levels of biopharmaceutical residues. Many subsequent studies have demonstrated the broad application of this analytical technique to pharmaceutical validation (10, 15–18).
On the other hand, TOC is a rapid technique that can be used to analyze and control the equipment prior to operation, thus ensuring no cross-contamination between one product and the next (19). Due to the complexity of the formulations used in a pilot plant, it is preferable to analyze the residues present after cleaning as a whole, rather than attempting to identify single components (12). TOC analysis can help to detect residues that are not identified by high-performance liquid chromatography (HPLC) (detergents, cross-contamination, etc.). This paper describes the preparatory phases of the study and presents the validation results for a piece of equipment in a pilot plant, establishing the required specification of TOC load prior to operation.
1.1. Characteristics of the Equipment Used in the Study
The present study used Shimadzu TOC analyzers, models TOC-VCSN and TOC-VWP, both of which were employed in the analysis of liquid samples (Table II lists the manufacturer's specifications).
-
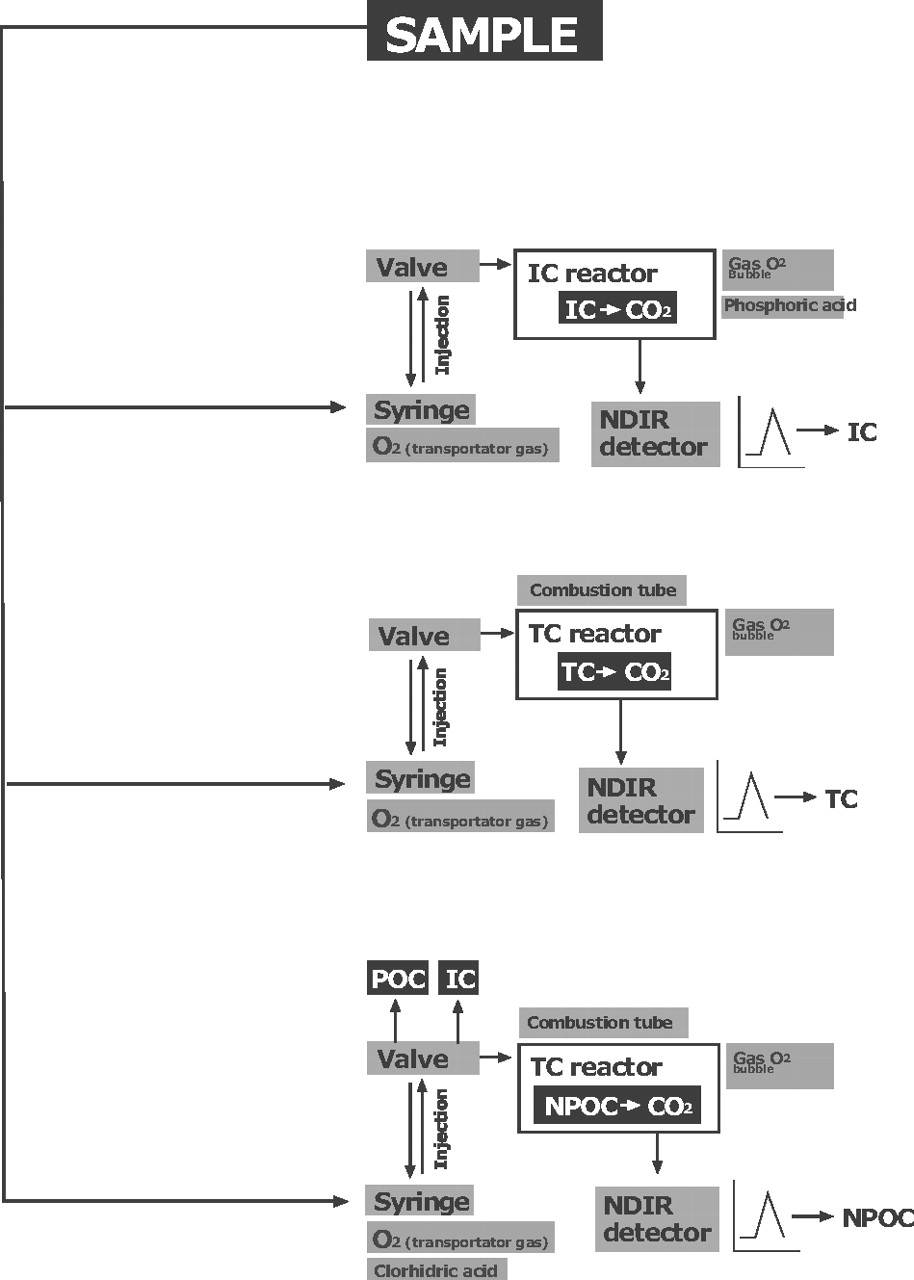
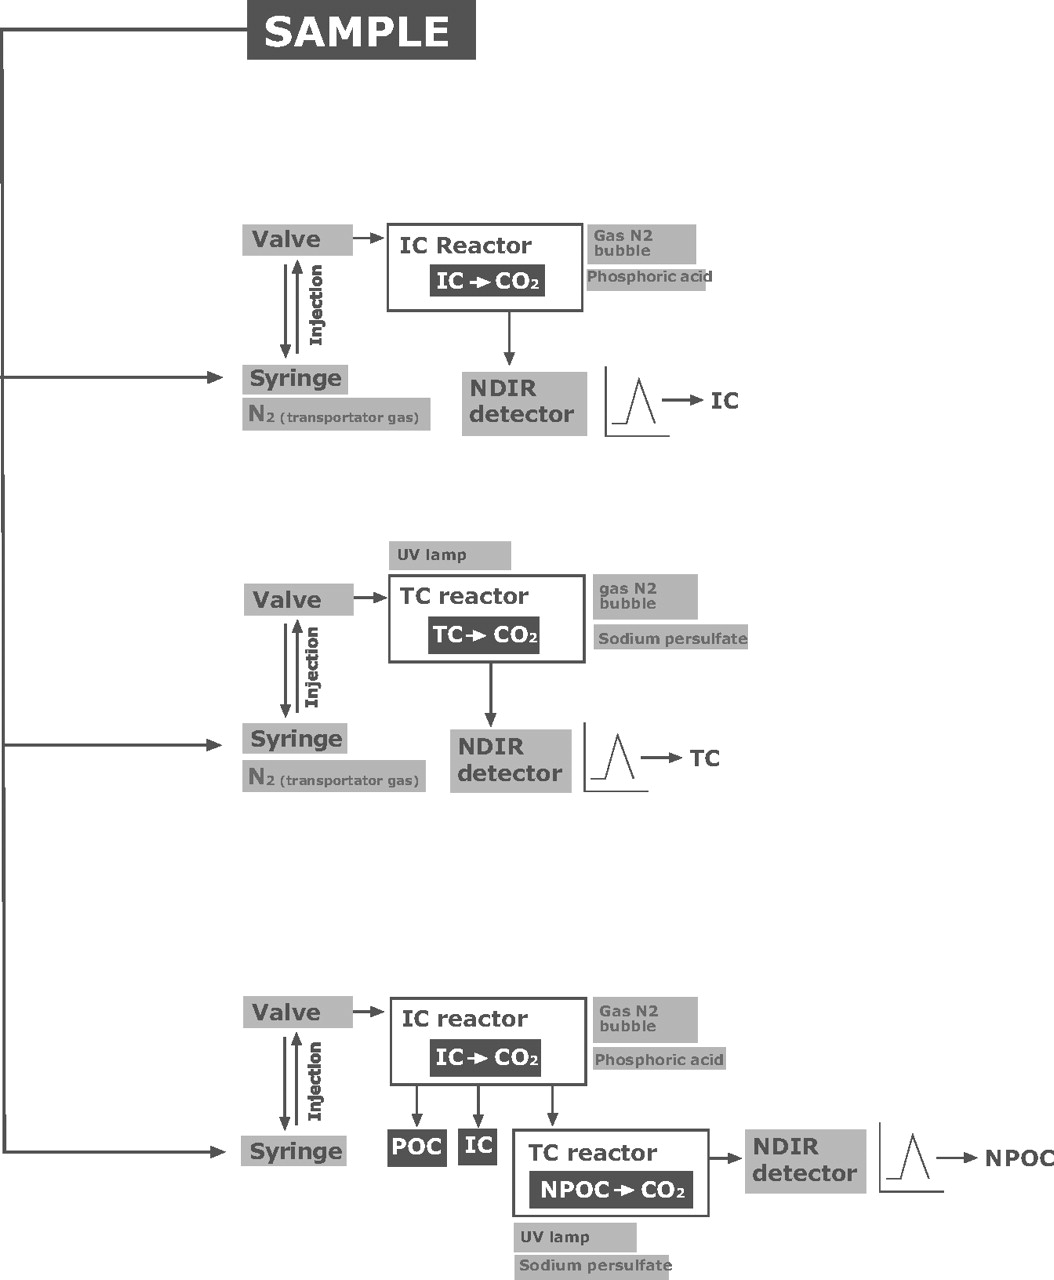
TOC-VCSN: combustion catalytic oxidation/NDIR method
This analyzer uses high-temperature combustion (catalytically aided platinum at 680 °C) as the oxidation method (20). Figure 1 illustrates how the device determines the presence of three possible types of types of carbon (C).
-
TOC-VWP: wet oxidation/NDIR method
This analyzer uses wet chemical oxidation combining sodium persulphate and UV radiation as the oxidation method (21). Figure 2 illustrates the three possible types of carbon that the device can determine.
Equipment Specifications Given by the Supplier

TOC VCSN utilities scheme.

TOC-VWP utilities scheme.
1.2. Significance of TOC Measurements
TOC analysers can, in a single sample, independently measure the amounts of three types of carbon: total carbon (TC), total organic carbon (TOC), and inorganic carbon (IC). Also, TOC can be distinguished between purgable carbon (POC) and non-purgable carbon (NPOC). So, the relation is TC = TOC + IC, and TOC = NPOC + POC.
Of the three measurements taken by the TOC analyzers, it is assumed in cleaning validation in the pharmaceutical industry that the TOC load is equivalent to the NPOC, since the POC represents volatile compounds such as organic solvents that are almost negligible if the cleaning is carried out in accordance with the standard operating procedures (SOPs). This greatly simplifies the analysis of routine sample readings such as those taken in this study.
2. Previous Considerations
When considering the use of TOC analysis for cleaning validation, first it is important to resolve certain problems that could affect later validation results. The following steps should therefore be considered before proceeding to the validation itself:
-
Qualification of the TOC equipment, according to the pharmacopeia
-
Selection of the prior treatment (cleaning) of the glass material
-
Calculation of the precision of the TOC analyzer
-
Linearity of the method: calibration lines
-
Selection of the contaminant to monitor
-
Calculation of acceptance limit for residues in the prototype
-
Validation of the TOC method for determining detergent and API residues
-
Calculation of the recovery and the accuracy of API A′ at the acceptance limit
Finally, in the established validation method it is particularly important to use the appropriate type of swab with low carbon content (10, 22). The three types of analyzer (TOC-VCSN, TOC-VWP, and HPLC) take readings from the same residue samples obtained during the equipment validation procedure in order to determine the functionality and equivalence of the three analytical methods.
2.1. Qualification of the TOC Equipment
Qualification is based on the pre-use test given in the pharmacopeia in order to verify that the equipment functions correctly. The suitability of the system or TOC equipment is determined according to the methods described in the Real Farmacopea Española (RFE), 3rd ed. (23) and the United States Pharmacopoeia USP30 NF25 (24), through the analysis of a solution prepared with a substance that oxidizes with difficulty (1,4-benzoquinone) and through comparison with another substance that oxidizes easily (sucrose). If the analyzer functions correctly it should oxidize both substances equally and the differences between the two analyses should be comparatively small.
The system is suitable if the efficiency of the response is no less than 85% and no more than 115% of the theoretical response.
2.2. Treatment of the Glass Material Prior to Use in the TOC Analysis
According to USP30 NF25 (24), there must be an efficient cleaning system to remove organic material from the glass material used in determining the TOC. The three standard systems are (23) the following:
-
Chromic mixture (must be handled with care)
-
Dilute nitric acid
-
Alkaline detergent
As a general rule it is advisable to work with laboratory glass material that is dedicated exclusively to TOC analysis. It is also important to rinse the glass material with highly purified water several times prior to use. In this case, the effects of treatment with a chromic mixture and washing with an alkaline detergent were compared to determine the most suitable option.
2.3. Precision of the TOC Analyzer
This parameter expresses the degree of concordance (degree of dispersion) between a series of measurements obtained from a single, homogeneous sample under predefined conditions. The parameter is determined using the repeatability method (25) by calculating the relative standard deviation (RSD) of ten aliquots of a standard sample containing 1 ppm C.
According to the AOAC (American Association of Official Analytical Chemists) (26), the limits for the RSD are established according to the concentration of the substance in the sample to be validated. In the present study a RSD of up to 8% is accepted for concentrations of 1 ppm.
2.4. Calibration Curves
For cleaning validation using TOC analysis, calibration curves must be made utilizing specific standards with exactly known carbon content (16, 17). Two calibration curves were prepared: (a) one for the calculation of TC and NPOC, with a standard solution of potassium hydrogen phthalate, and (b) another for the calculation of IC, with a standard solution of sodium hydrogen carbonate and anhydrous sodium carbonate.
The curves were prepared using the working concentration from the cleaning validation, so it was advisable to use seven points that range between 0.05 and 5 ppm. Curves from 5 to10 ppm were also prepared in case the samples contained higher levels of C (these are not shown in the study as they were not used).
The detection limit (DL) and the quantification limit (QL) were obtained from the calibration lines. These limits were calculated using the ICH method (27), which is based on the standard deviation of the response and the slope of the calibration line. The average SD was calculated for the areas corresponding to concentrations of between 0.05 and 5 ppm of carbon. To obtain the method's noise level, the average SD was then divided by the slope of the calibration line. This was multiplied by 3 to obtain the DL and by 10 to obtain the QL. After obtaining the theoretical values of DL and QL, five single samples were prepared for the two levels to experimentally demonstrate that the two limits correspond to the DL and QL proposed before.
2.5. Monitored Contaminant (28)
The worst-case criterion is applied to select the contaminant with the lowest solubility in water (therefore the most difficult to clean) and/or the lowest daily therapeutic dose (TD) (therefore the most active or toxic) as the prototype.
A cleaning validation check sheet (listing each API used in the pilot plant) was prepared for each piece of equipment analyzed. When new APIs pass through the equipment they must be analyzed if they represent a new worst-case scenario with respect to those already included in the checklist. If this is the case, the acceptance limit must be recalculated; if the new API does not constitute a worst case, the established limit remains valid. The checklist can be designed as an Excel spreadsheet to facilitate the calculations.
2.6. Acceptable Residue Limit of the Prototype
If the equipment is cleaned after production of product A and then used to produce product B, the contaminant limit (active ingredient or excipients of A, residual detergent, or degradation product) subsequently applied to B must meet the basic organoleptic criterion and the calculated general acceptance limit (2, 29, 30).
-
Organoleptic criterion: absence of visible contamination (6, 31, 32) (4–20 μg/cm2) when viewed with visible or UV light. Absence of unusual odours.
-
General criterion: the limit will be the lowest value obtained from the two methods described below.
Method using the fraction F (safety) of the therapeutic or toxic dose of contaminant A′: the volume of contaminant present in the daily therapeutic dose of product B that will subsequently be produced by the equipment must be lower than a predetermined fraction of the therapeutic dose (TD) or toxic dose of the contaminant. Product B refers to the final product containing API B′ and its corresponding excipients. The patient takes a given quantity of product B (e.g., 900 mg in tablet form, which contains 500 mg of the API aspirin). However, the contamination due to API A′ is diluted in the 900 mg of final product. In this case, the worst possible case should be chosen as product B, which will be the smallest batch size, since the residue of A′ would be concentrated in B.
In practice, F takes values of between 0.001 and 0.025—see Table III (8, 33). F = 0.001 indicates that one-thousandth of the TD of the API of contaminant A′ is the maximum amount that can pass into the TD of product B. The three security factors of ten in the fraction 0.001 represent three considerations: the first is due to the fact that drugs are usually inactive at 0.1 of their TD; the second is a prevention factor (to ensure inactivity); and the third is due to the robustness required in any cleaning validation.
Security Factors of Different Pharmaceutical Forms (9, 33)
An example of the required equation would be
 where DT A′ min is the therapeutic dose or toxic dose minimum of the API A′, and DT max product B is the daily maximum dose of the product B.
Criterion based on the presence of trace amounts (ppm): Traditionally, an upper limit (34) between 1 to 10 ppm of the contaminant A in product B was considered appropriate. However, in ordinary cleaning and batch production, accepted limits can be 100–1000 times higher, and when using very active products the limits can be 10–100 times lower. If TOC analysis is used for cleaning validation, the chemical limits have to be converted into their equivalent TOC values (35), as these will obviously be lower. This general limit can then be transformed into the specific limit according to the sampling method used in the cleaning validation.
2.6.1. Rinse Water Validation Method:
This is the method chosen for equipment that is difficult to disassemble or with areas that are difficult to reach (pipes, dispensers, etc.) because it encompasses all of the surfaces of a piece of machinery. It is usually a direct analysis (36) performed through a small number of steps when the volume of solvent can be easily measured. The major disadvantages of this method are as follows: it does not remove strongly adhered residues, the residue is diluted to a certain extent, some of the rinse liquid may be lost, the type of solvent (solubility, safety, etc.) and the quantity used can affect the outcome, the distribution of the contamination in the equipment is not known, the use of non-aqueous solvents can cause problems, and, finally, not all types of equipment can be validated using this method because some cannot retain the rinse water (in the present study, which uses a Glatt coating pan, this validation method cannot be applied).
Finally, when using this method the equipment should be cleaned according to the approved SOP and then submerged in or rinsed with fresh rinse water, from which the samples for analysis should be extracted. It is recommended that the recovery of the method be calculated, even though this step was previously omitted for soluble APIs. The formula used to calculate the acceptance limit is as follows:
 where ppm A′ (rinse liquid) = maximum ppm A′ in B, N = mg A′/mL (limit of active ingredient/mL), V = volume of rinse liquid (l), and Wmin = minimum weight of a batch (kg) or weight of the smallest batch that can be produced by the equipment used.
2.6.2. Surface Sampling Validation Method:
This is a direct, reproducible method. It is useful when the contamination is assumed to be homogeneous and can be extrapolated to the total surface area of the equipment. However, if only the most inaccessible points of the equipment are sampled (hot points or critical points) and the results are extrapolated to the total surface area of the piece of equipment analyzed (worst-case scenario of uniform contamination), it may be necessary to modify the cleaning method, which complicates the cleaning method and its validation. It is important to record what will be sampled, the points in the piece of equipment from which samples will be taken (accessible and inaccessible points such joints, cracks, waste pipes, etc.), and the material of the surfaces at these points. This should ensure a more accurate extrapolation of the total contamination and will avoid unnecessary “extra cleaning efforts”. It is also necessary to take into account the auxiliary equipment that comes into contact with the product, such as filters, utensils, etc.
The amount of contaminant found in the dispensers (critical points that can potentially cause selective contamination) will be released entirely into the first units produced (worst-case selective contamination scenario). A special sampling material is required (brush or swab) which must be as inert as possible and should determine the percentage recovery of the method. Possible contamination and/or interference with the contaminant should also be considered. The solvent is selected taking into account the solubility of the contaminant, the nature of the contamination, the type of surface, and the sampling material. The analytical method always includes pre-treatment of samples, which includes dissolution, filtration, extraction, etc.
It is essential to calculate the recovery factor in order to correct the values obtained when analyzing the samples. In biotechnology, recoveries of around 15–20% are acceptable. The U.S. Food and Drug Administration (FDA) accepts >50%, although in practice it requires the percentage to be in the range of from 70 to 100% (37, 38). The RSD of the samples should be below 10% in all cases.
The surface area of the sample should be considered (normally 25 cm2); it should ensure that the percentage recovery is sufficiently high that the analytical methods can evaluate the products. If the DL and QL of the method are low, the surface area will have to be increased.
The following formula is used to determine the acceptance limits applied to the surface sampling:
 where ppmA′ (sup) = maximum ppmA′ in B, M = microg A′/cm2 (limit of the active ingredient/cm2), S = surface area of the equipment in cm2, R = average analyte recovery (%), and Pmin = minimum weight of a batch (kg) or weight of the smallest batch that can be produced by the equipment used.
2.7. Validation of the TOC Method for Determining Detergent and API Residues
TOC curves are used to demonstrate the linearity of the possible contaminants (detergents and APIs) between the concentration of the contaminant and the quantity of carbon in ppm C to establish the limitations of the analyzer and of the method (13, 39). It is therefore assumed that any carbon residue is indicative of existing contamination, irrespective of its source.
2.8. Recovery of API A′ and Accuracy of the Method
This test verifies the percentage recovery of the method as recorded in the analysis, which is then applied to the results of the cleaning validation of the Glatt coating pan. First this is done by loading a stainless steel plate (40 cm2) that has been washed with low-TOC water (five rinses) and then spiked with the standard API A′ solutions. The plate is then left to dry for 2 h in normal conditions but “protected” in a thermostatized oven at 25 ± 2 °C exclusively for the TOC test.
Three concentrations of API A′ (5.70 ppm, 2.87 ppm, and 1.43 ppm) were prepared, which were then pipetted onto separate stainless steel plates. In addition, a fourth plate without the standard solution was used as a blank. A sample was taken from the pipetted plates using a premoistened swab which is placed in a 100-mL flask. The resulting solution was read by the TOC and HPLC analyzers, and recovery of three standards were calculated using the following equation:
 Finally, the test was repeated for the acceptance limit of A′ in the final solution (based on the knowledge that the surface area of the equipment to be sampled will be approximately 400 cm2 and the flask has a volume of 100 mL), and the maximum permissible concentration of the solution was calculated. The plates were pipetted in triplicate (samples 1, 2, and 3).
In addition, three other samples at the same concentrations of API A′ (5.70 ppm, 2.87 ppm, and 1.43 ppm) were prepared, which were then quantified directly in the three analysers. The method's accuracy was calculated by comparing the results with the real concentrations of the solutions.
3. Comparative Analysis of Residues in TOC-VCSN, TOC-VWP, and HPLC Equipment
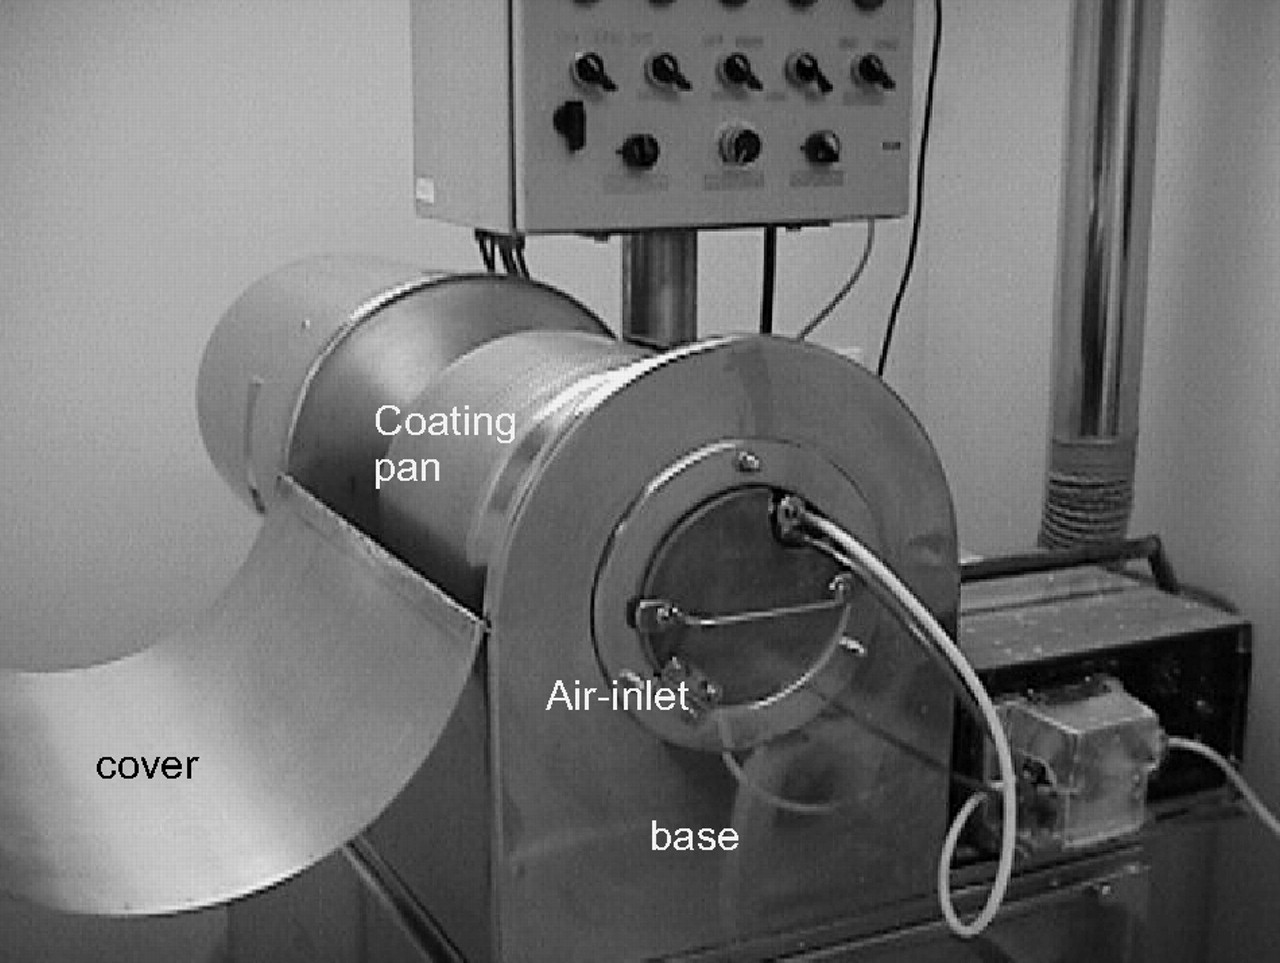
The two TOC methods were compared with the HPLC method for validating the cleaning of the Glatt coating pan in the pharmaceutical pilot plant of the University of Barcelona to determine the comparative functionality of the three methods. The validation consists of determining the results of three cleaning cycles. Due to the characteristics of the equipment (Figure 3), only the surface sampling validation method can be used.

Glatt coating machine, with its parts marked.
Consequently, once the equipment had been cleaned following use with the monitored prototype product or worst case, samples were taken from areas of approximately 400 cm2 with the preselected swab. The swab was ultrasonicated for five minutes in a calibrated flask containing 100 mL of highly purified water. The resulting solution was filtered through a 0.45-μm Millipore Millex-HV Hydrophilic PVDF filter that will retain any possible insoluble residues, and readings were then taken with the TOC and HPLC analyzers.
The TOC analyzer detects all contaminants containing carbon, so that any residue containing carbon will be assumed to be the prototype contaminant; this gives an acceptance limit similar to that produced by the HPLC technique.
4. Results
The results for each of the pre-operation tests carried out in the study (explained in Section 2) and the results of the comparative analytical study described in Section 3 are reported.
4.1. Qualification of TOC Equipment
As can be seen in Table IV, the two units meet the oxidation efficiency requirements, where the wet oxidation equipment (TOC_VWP) is more efficient (103.6%) than the combustion unit (TOC_VCSN, 111.8%).
TOC Equipment Qualification Results
4.2. Previous Treatment of Glass Material
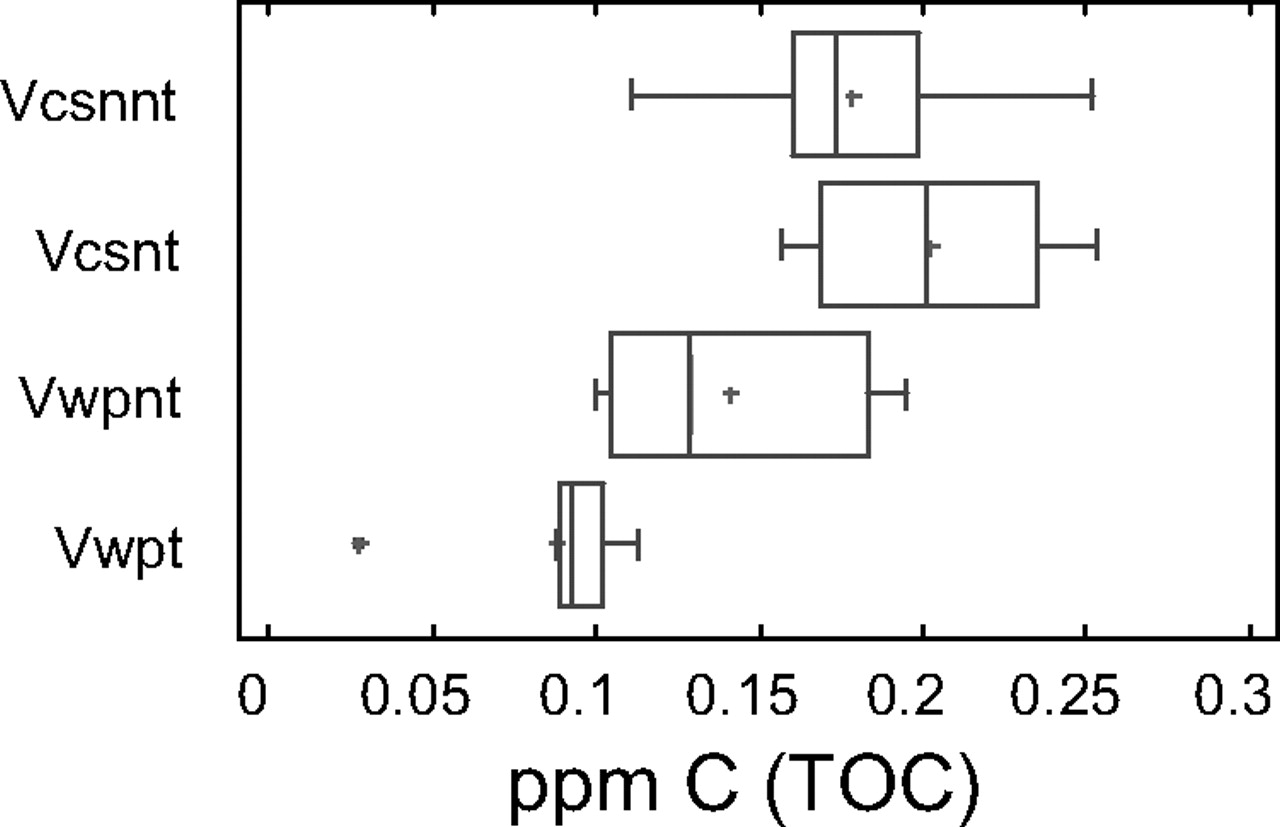
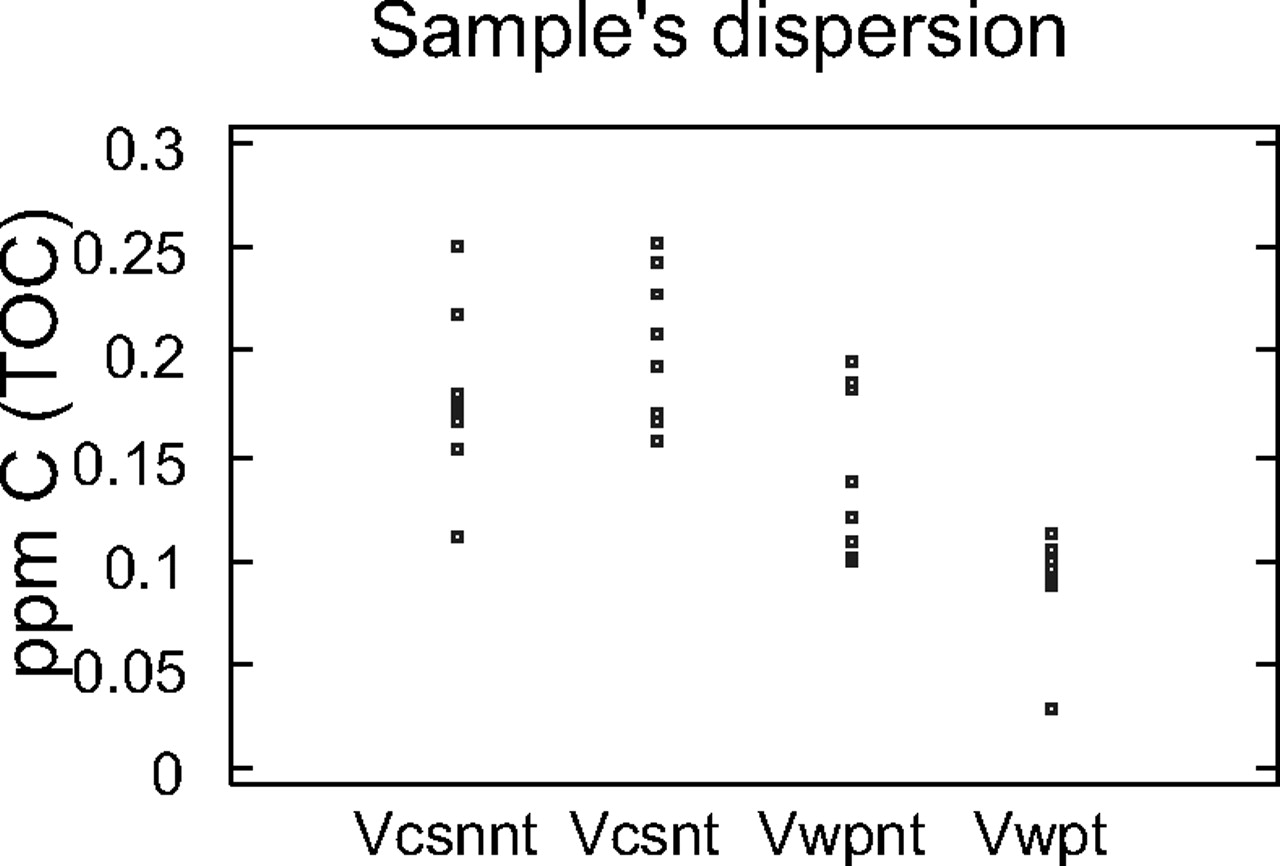
The NPOC of the high-purity water was determined in the eight flasks treated with chromic mixture and in the eight untreated flasks washed with basic detergent (Figures 4 and 5). As can be seen in Figure 4, there are no statistically significant differences between three groups, while a statistically significant difference can be seen for the sample coming from flasks treated and analysed using wet oxidation.

TOC-VCSN and TOC-WP distribution using box and moustaches graph. Vcsnnt: No-treated flask analysed by combustion Vcsnt: Treated flask analysed by combustion Vwpnt: No-treated flask analysed by wet oxidation Vwpt: Treated flask analysed by wet oxidation

TOC-VCSN and TOC-WP dispersion graphic.
From Figure 5, it can be also observed that the treatment reduced the amount of C in the flask and the difference among flasks in the group. In spite of this advantage, due to the delicate handling required by chromic mixture, it is advisable to use material designed exclusively for TOC analysis and prior to use to wash the material with an alkaline detergent and rinse it four times with water with low TOC content.
4.3. Precision of the TOC Analyzer
To calculate this value, a standard solution was prepared which contained 1 ppm C (with standard phthalate solution for TOC) and ten readings were taken. The results can be seen in Table V. The RSD is 6.5% for the combustion TOC and 4.6% for the wet combustion TOC, both of which are below the RSD indicated by the AOAC for concentrations of 1 ppm (8%), which indicates that the two analyzers are sufficiently precise.
Obtained Results To Prove Precision
4.4. Phthalate TOC/API A′ HPLC Lines
The three curves were read in the three different systems. Results are shown in Table VI, along with the detection and quantification limits. It can be seen that the background noise is greater for TOC than for HPLC, as TOC detects all types of carbon compound whereas HPLC detects only one compound.
Results of the Quantification and Identification Limits and Lineality of the Three Methods
After obtaining the theoretical values of DL and QL, five single samples were prepared for the two levels. For the first sample, the DL values describing precision were above the established limit (10% Eurachem method), and for the QL the RSD was below this limit, since we obtained 8.15% for combustion TOC, 7.55% for wet TOC, and 4.13% for HPLC.
4.5. Monitored Contaminant
The aim of the study is to validate the cleaning of a production unit with a total surface area of 3433.9 cm2 and a theoretical capacity of 0.8 kg. The list of technical specifications will help to determine the indicator API of the validation (Table VII), which takes into account the API that had passed through the unit for the previous product and the detergent used in the cleaning process.
Glatt Coating Machine: Evaluation for the Limit of Residues
According to the reference consulted (28), the monitored contaminant will be the substance with the smallest therapeutic dose (TD) or LD50 (lethal dose in the case of the detergent components), and which has the lowest degree of solubility in water. The indicator prototype selected for the validation was API A′.
4.6. Acceptance Limit of Prototype
As described above, first the general limit is calculated and then the limit for validation is determined using rinses water or the surface sampling method.
1) Acceptance limit calculation
This is calculated using the therapeutic fraction criterion (see the following formula); if it is lower than the maximum dose limit of 10 ppm (organoleptic method), the lower of them is chosen:
 Since the 10 ppm limit is lower than the calculated therapeutic fraction limit (25 ppm), it is considered that there can be a maximum of 10μg of API A′ in 1 g of the quantitative formula of B.
Using TOC, API A′ contains 57.34% carbon, which means that the limit will be
2) Calculation of the acceptance limit for surface sampling method
The formula used to calculate the surface limit is given in Subsection 2.6.2. So, if the maximum total amount is 5.73 ppm C for the piece of equipment, the limit can be calculated for cm2. In this case, M = 2.33 mg/cm2 of API A′ or 1.34 mg/cm2 of C. The latter limit, taken from the TOC analysis results, means that all organic residues are assimilated as API A′, thus the strictest possible limit is applied.
The limit is not calculated for the rinse water method because this is not suitable for the type of equipment validated in this study (see Figure 3).
4.7. Validation of the TOC Method for Determining Detergent and API Residues
In all cases a satisfactory curve with at least 5–7 points is obtained. The determination coefficients r2 are shown in Table VI. These results confirm the linear detection of the possible contaminants using both the TOC and HPLC techniques.
4.8. Recovery of API A′
It is observed that recovery at high concentrations (5.7 ppm C) is greater in TOC than in HPLC, whereas HPLC provides greater recovery at lower concentrations (1.43 ppm C; see Table VIII). It was found that at low TOC concentrations the TOC amount of the sampling devices can influence measurement error because at low levels the percent influence is more important than in higher levels of TOC.
Recovery in Three Levels of the API A′
The API A′ solution, which will be pipetted onto the plate, is prepared as a solution with the concentration of the acceptance limit of A′ in the final solution, which is calculated as follows:
 The solution is prepared and the procedure is repeated three times. The results are shown in the last lines of Table VIII. For swab recovery of A′ at the surface acceptance limit, a general value of 70% is acceptable for each of the three methods.
In addition, accuracy was calculated with the three standard solutions prepared in the three levels assayed. The results are displayed in Table VIII, showing an acceptable accuracy in all the cases.
4.9. Cleaning Validation Results for the Glatt Pan
The cleaning of the coating pan is validated by sampling the internal surface that comes into contact with the prototype product. The parts of the equipment that did not come into direct contact are also considered, such as the base air inlet and the cover of the Glatt coating pan (Figure 3), because these areas also provide a risk of cross-contamination. The acceptance limits are calculated independently according to the respective surface areas.
Table IX shows the TOC results and the equivalent HPLC results for the three cleaning validation cycles. The results are adjusted (by 70% recovery) to obtain real values of the contamination recorded.
TOC and HPLC Cleaning Validation Results
The cleaning of the coating pan is therefore validated, as the results are within the established limits.
5. Discussion and Conclusion
Table X summarizes the findings of the study by comparing the three techniques used to validate the procedures for cleaning equipment in the pilot plant. It was proved that the analytical method is very practical and suited for use in a pilot plant, as TOC analysis prior to operation provides further security by adding an extra component to the verification of the cleanness of the production line.
Summary of Difficulties and Advantages of the Three Methods
From the comparative study it can be concluded that the TOC-VWP shows lesser variability of results and a lower DL than does the TOC-VCSN, making it more suitable as an analytical method for cleaning validation due to its higher sensitivity (because it is expected that a low load of TOC is present in the samples, thus it can be used to analyze samples from devices containing certified low amounts of TOC). The two TOC analyzers are suitable for interpreting the results in the limit tests and provide accurate measurements.
Comparison between the TOC and HPLC analytical methods reveals TOC analysis to be more practical than HPLC, as it does not require the preparatory stages prior to validation according to the API under analysis and is also faster. As well for a pilot plant, TOC analysis can serve as a general equipment cleaning indicator for products that have no specific validated cleaning procedures. Because the technique is specific to the active ingredient concerned, less variability is observed with HPLC than with the two TOC methods (2.23%). In addition, TOC analysis cannot be used for organic solvents and is only applicable to water-soluble samples (so that it must sometimes be supplemented by specific methods such as HPLC analysis or performed for solid samples, requiring thorough cleaning of all material in order to minimize interference), which is not the case of HPLC analysis.
HPLC is a specific and accurate method; however, TOC is generally much faster. The major savings in time and associated cost gained by using TOC are due to the speed of method development and analysis. Method development is an iterative process involving running a sample and checking results. Because samples are run quickly and analysis results are obtained within seconds when using TOC, method optimization is reached faster than when using the slower HPLC method. After method development and optimization, time savings are obtained in the analysis a company runs regarding the ongoing monitoring of its cleaning methods.
Finally, the following working guidelines are suggested in the implementation of a validation cleaning plan followed by cleaning verification for day-to-day routine analysis, using TOC analysis:
-
The cleaning procedure for each piece of equipment in the pilot plant should be validated, individual records detailing the APIs that have been passed through the equipment should be compiled, and residue acceptance limits calculated, as presented in Table VII.
-
A TOC limit should be established for each piece of equipment validated.
-
A technical schema of the equipment should be utilized to enable rapid evaluation and calculation of new acceptance limits according to the characteristics of the new APIs used.
-
The pilot plant equipment should be evaluated prior to use by taking a swab from the critical point of the unit (as marked in the working sheet, Table VII) and performing an analysis in the TOC analyser (taking only 10–15 min).
This analysis of cleaning verification prior to the equipment's use is advised because equipment in a pilot plant is often inactive for long periods, which means that the effect of previous cleaning will have diminished and the equipment must usually be cleaned again. Furthermore, in clinical batch production that follows this procedure, there is no need to follow the standard practice of producing a placebo batch (in order to remove possible contaminants) immediately prior to production of the pilot batch.
6. Acknowedgements
The equipment used for the study was ceded by IZASA S.A. (Barcelona, Spain).
Footnotes
- © PDA, Inc. 2009


