
Abstract
The newly updated FDA Guidance for Industry on Process Validation: General Principles and Practices ushers in a life cycle approach to process validation. While the guidance no longer considers the use of traditional three-batch validation appropriate, it does not prescribe the number of validation batches for a prospective validation protocol, nor does it provide specific methods to determine it. This potentially could leave manufacturers in a quandary. In this paper, I develop a Bayesian method to address the issue. By combining process knowledge gained from Stage 1 Process Design (PD) with expected outcomes of Stage 2 Process Performance Qualification (PPQ), the number of validation batches for PPQ is determined to provide a high level of assurance that the process will consistently produce future batches meeting quality standards. Several examples based on simulated data are presented to illustrate the use of the Bayesian method in helping manufacturers make risk-based decisions for Stage 2 PPQ, and they highlight the advantages of the method over traditional Frequentist approaches. The discussions in the paper lend support for a life cycle and risk-based approach to process validation recommended in the new FDA guidance.
LAY ABSTRACT: The newly updated FDA Guidance for Industry on Process Validation: General Principles and Practices ushers in a life cycle approach to process validation. While the guidance no longer considers the use of traditional three-batch validation appropriate, it does not prescribe the number of validation batches for a prospective validation protocol, nor does it provide specific methods to determine it. This potentially could leave manufacturers in a quandary. In this paper, I develop a Bayesian method to address the issue. By combining process knowledge gained from Stage 1 Process Design (PD) with expected outcomes of Stage 2 Process Performance Qualification (PPQ), the number of validation batches for PPQ is determined to provide a high level of assurance that the process will consistently produce future batches meeting quality standards. Several examples based on simulated data are presented to illustrate the use of the Bayesian method in helping manufacturers make risk-based decisions for Stage 2 PPQ, and THEY highlight the advantages of the method over traditional Frequentist approaches. The discussions in the paper lend support for a life cycle and risk-based approach to process validation recommended in the new FDA guidance.
Introduction
In January 2011, the U.S. Food and Drug Administration (FDA) published the long-awaited FDA Guidance for Industry on Process Validation: General Principles and Practices (1). The guidance represents a significant shift of regulatory requirements from the traditional “test to compliance” at the end of process development to the current “quality by design” throughout the life cycle of the product and process. Process validation is no longer a set of documented evidences demonstrating consistency of the process in producing several consecutive batches of commercial-scale product that meet pre-specified specifications. Instead, it is a science and risk-based development paradigm that yields product quality through designing the process so that it is capable of consistently producing acceptable quality products within commercial manufacturing conditions. The approach is most apparent in the new regulatory definition for process validation: “the collection and evaluation of data, from the process design through commercial production, which establishes scientific evidence that a process is capable of consistently delivering quality” (1). The new guidance approaches process validation in three stages:
Stage 1—Process Design (PD): The commercial manufacturing process is defined during this stage based on knowledge gained through development and scale-up activities.
Stage 2—Process Performance Qualification (PPQ): During this stage, the PD is evaluated to determine whether the process is capable of reproducible commercial manufacturing.
Stage 3—Continued Process Verification: Ongoing assurance is gained during routine production that the process remains in a state of control (1).
The new process validation guideline aligns activities at each of the three stages with the other existing guidelines, including ICH Q8(R2) Pharmaceutical Development, 2006; ICH Q9 Quality Risk Management, 2007; ICH Q10 Pharmaceutical Quality Systems, 2007; ICH Q11 Concept Paper, 2011 (2⇓⇓–5). These encourage the use of modern pharmaceutical development concepts, quality risk management, and quality systems at all stages of the manufacturing process life cycle.
By and large, the new process validation guidance has been received favorably by the industry, as it allows manufacturers to demonstrate the performance of the manufacturing process, using not only data from commercial-scale studies including process qualification, but also those from laboratory- and pilot-scale experiments conducted during the process design stage. However, this guidance also brings about some new challenges. At the top of the list is determination of the number of validation batches for Stage 2 PPQ, using process knowledge obtained from Stage 1 PD. Ever since the FDA published its original guidelines on General Principles of Validation in 1987 (6), three-batch validation has been widely viewed as industry best practice in the past 25 years. However the three-batch-validation rule lacks in scientific basis. It is conceivable that when data from Stage 1 suggest that the process is robust and that the process variations are well understood and under control, Stage 2 PPQ is more likely to succeed. Under those circumstances, an extended Stage 2 PPQ with numerous batches might add little benefit than what is already gleaned from Stage 1 PD. On the other hand, if the process demonstrates inconsistent performance or large variations that are difficult to control during Stage 1, its passing three-batch PPQ acceptance criteria does not necessarily imply that it will provide a high level of assurance that batches produced in the future will consistently meet pre-specified specifications. As a result, determination of the number of batches required for Stage 2 PPQ needs to take into account knowledge and understanding of the process gained from Stage 1, including process capability, sources of variations, in-process control, quality attributes, or validation parameters used to characterize product quality, as well as practical limitations in manufacturing the number of batches sufficient for PPQ within a period of time.
While the new guidance no longer endorses the one-size-fits-all approach, it does not prescribe the number of validation batches for PPQ; the burden is on the manufacturers to make a rational proposal, in light of data collected during Stage 1 PD and expected outcomes of Stage 2 PPQ. However, how to combine data from both stages can be challenging. In statistics, there are two types of inferences; one is called Bayesian and the other Frequentist. Through application of Bayes' rule (7), the former provides a framework for combining new data with prior beliefs to calculate a posterior probability regarding parameters or random variables about which statistical inference is to be made. In the context of process validation, data concerning process performance during Stage 1 constitute prior beliefs while data collected from Stage 2 PPQ are new evidences. One example of the prior belief is that the probability for batches produced during Stage 1 to pass specifications varies according to certain statistical distribution. This is often true because raw materials, reagents, experimental conditions, and production scale change during early process development. When combined through the Bayes' rule, the prior beliefs and new evidence result in an updated estimate to the probability for future batches produced after PPQ to meet quality standards, producing a more sensible estimate of the number of validation batches required for PPQ. By contrast, Frequentist methods rely on an assumption that the true probability for batches to meet quality standards is a parameter that does not change. As a result, they rely on data such as those from Stage 2 PPQ collected under the same manufacturing conditions to make inference about the parameters of interest, having limited means to incorporate prior beliefs or data from Stage 1 with those from Stage 2 PPQ.
In this paper, I introduce a Bayesian method to determine the number of validation batches required for Stage 2 PPQ. Process performance data from Stage 1 are modeled through beta error distributions and combined with expected outcomes of Stage 2 PPQ to derive posterior probability for future batches to meet specifications. The number of batches is determined such that the posterior probability exceeds a pre-specified level. For the purpose of comparison, a Frequentist method is also introduced. Several examples based on simulated data are presented to illustrate the use of the Bayesian method in helping manufacturers make risk-based decisions for Stage 2 PPQ, and these examples highlight the advantages of the method over the Frequentist approach. The discussions in the paper lend support for a life cycle and risk-based approach to process validation recommended in the new FDA guidance.
Number of Validation Batches
Stage 2 PPQ of the new guidance is analogous to the traditional process validation. It is aimed at confirming the process design and demonstrating that the commercial manufacturing process is fit for its intended use. Per the guidance, a written process PPQ protocol should be developed to include manufacturing conditions, sampling plan, tests to be performed, and their respective acceptance criteria. The protocol should also include pre-specified criteria to judge if the ability of the process to consistently produce quality product is supported by scientific evidence generated from the PPQ study. As product quality assurance is dependent on the number of batches tested, it is crucial to determine the number based on robust statistical methods and scientific justification.
In this paper, quality assurance is defined as the posterior probability for the test results of critical quality attributes (CQAs), such as potency, of future batches to meet their respective specification. To simplify the introduction of our method, the discussion is focused on potency of the product, which is a CQA. n is used to denote the number of batches required for Stage 2 PPQ. The objective is that at the successful conclusion of PPQ, which implies that all n validation batches meet acceptance criteria, the posterior probability for the potency of a future batch to meet its potency specification exceeds a pre-determined level p0 (0 < p0 < 1). The method will be generalized to the case where the number of batches n is determined so that the pre-selected number p0 is exceeded by the posterior probability that there are at least k out of l (1 ≤ k ≤ l) future batches produced post-PPQ within a time period or commercial campaign meeting specifications.
Let xi, i = 1, … , n be random binary variables such that xi = 1 if the potency of batch i is within specification; otherwise xi = 0. Thus xi follow a Bernoulli distribution B(p) (7), satisfying

where “Pr” stands for probability, and p (0 ≤ p ≤ 1) is the probability for a batch to pass potency specification. Let x = (x1, … , xn). Thus x represent the potency test outcomes of n batches from the PPQ study. Let x̃ be the potency test outcome of a future batch. The number of batches n is chosen such that the posterior probability for the new batch manufactured after PPQ to meet the specification is no smaller than a pre-selected number p0. Typically p0 is chosen to be greater than or equal to 90%. Mathematically,

Estimation of the probability in eq 2 can be obtained through a Bayesian procedure described as follows. The method, first developed by Rev. Thomas Bayes, provides a general framework for making statistical inference based on newly collected experimental evidence and historical knowledge (8). The potency outcomes from PPQ x = (x1, … , xn) are the new data with xi being described by a Bernoulli distribution B(p). The unknown parameter p can be viewed as a random variable and modelled through a beta distribution B(α, β) (9). Potency data from historical performance of the process during Stage 1 PD can be used to estimate the parameters (α, β). Based on the Bayes Theorem (8), the posterior probability of p given the observed data x is a beta distribution B(α + m, β + n − m), where
is the total number batches used in PPQ study that are required to pass the potency specification. It can be readily shown (9)

In order for the PPQ to be deemed a success, it is required that all n validation batches pass potency specification. As a result, m = n, and

Combining eqs 2 and 5, the number of batches n providing at least p0100% probability for a future batch produced after Stage 2 PPQ to pass potency specification satisfies
Solving the above inequality results in

When p0 = 95%, eq 7 becomes

The parameters (α, β) can be estimated using historical data. Let y = (y1, … , yJ) denote the potency data of batches produced during Stage 1 PD, where yj is the percent of potency samples from batch j, j = 1, … , J, that meet specification. It is assumed that yj follow a beta distribution B(α, β). Let
be the sample mean and variance of y, respectively. Because the theoretical mean and variance of yj is given by

estimates (α̂, β̂) of (α, β) can be obtained by equating the sample mean and variance in eq 9 with the theoretical mean and variance in eq 10. With some algebraic manipulations, it can be shown that

Generalization of Bayesian Method
In this section, the method previously discussed is generalized to the case where the number of batches n for Stage 2 PPQ is determined so that the pre-selected number p0 (0 < p0 < 1) is exceeded by the posterior probability that there are at least k out of l (1 ≤ k ≤ l) future batches produced within a time period after Stage 2 PPQ meeting specifications. Let

where the probability in the right-hand side is given in eq 5. Let (x̃1, … , x̃l) be the test outcomes of the future l batches produced after Stage 2 PPQ. Define

Then ̃X is the total number of future batches that are produced after PPQ and that pass potency specification. Because x̃i, i = 1, … , l, following Bernoulli distribution B(p̃), ̃X|x has a binomial distribution Binomial(p̃, l). The number of validation batches n is chosen such that
Note that eq 14 is the same as eq 2 when k = l = 1. Thus the method discussed in this section is indeed a generalization of what is introduced in the previous section.
A Frequentist Approach
In order to understand the nature of the above Bayesian method and its benefits, it is of interest to introduce a Frequentist solution to the number of validation batches. One approach is to determine the number of validation batches n such that the one-sided lower prediction interval of X̃ is no smaller than the pre-selected integer k, the minimum number of batches out of l batches produced after PPQ that are required to pass specifications. An approximate prediction interval of X̃ can be obtained using the method by Hahn and Nelson (10). Let  , and
, and  . Let
. Let  . An estimate of ς2 is given by
  . Asymptotically we have

The resulting one-sided lower p0100% prediction limit of X̃ is given by

where zp0 is the p0100% percentile of the standard normal distribution. For the extreme case X = n, a continuity correction can be made to p̂ so that
 will be used in eqs 15 and 16. Such correction is common when approximating binomial distributions with normal distributions (11). Based on eq 16, the number of validation batches n is chosen such that

Examples
Several examples are presented in this section for the purposes of (1) illustrating the use of the Bayesian method, (2) explaining how the Bayesian method can be used to assist manufacturers to make risk-based decisions when designing Stage 2 PPQ study, and (3) highlighting the advantages of the Bayesian method over the Frequentist solution. The examples are based on simulated data.
Example 1: Determination of Number of Validation Batches
In this example, the Bayesian method is used to determine the number of validation batches n for Stage 2 PPQ. The number n is chosen so as to warrant that the posterior probability for a future batch produced after a successful Stage 2 PPQ to pass potency specification is no smaller than 95%. A successful Stage 2 PPQ is defined as that all n validation batches have passed specifications. The performance of a batch produced during Stage 1 under similar process conditions of Stage 2 PPQ is characterized by the percent, p, of samples from the batch that passed specifications. To account for uncertainty in p, it is assumed that p follows a beta distribution. Forty random numbers of p are simulated from B(25,1.5), representing performance history of the process during Stage 1 PD. The results are listed in Table I and used to estimate the underlying distribution B(25,1.5) which is the prior belief of batch performance, in terms of potency testing.
Simulated Potency Performance Data for 40 Batches
Using eq 11, we obtain α̂ = 28.4 and β̂ = 1.68. By eq 8, n satisfies

By eq 6, when n = 4, the posterior probability for a future batch produced after a successful Stage 2 PPQ to pass potency specification is

Therefore, 4 validation batches should be used for Stage 2 PPQ.
Example 2: Risk-based Decision Concerning Stage 2 PPQ
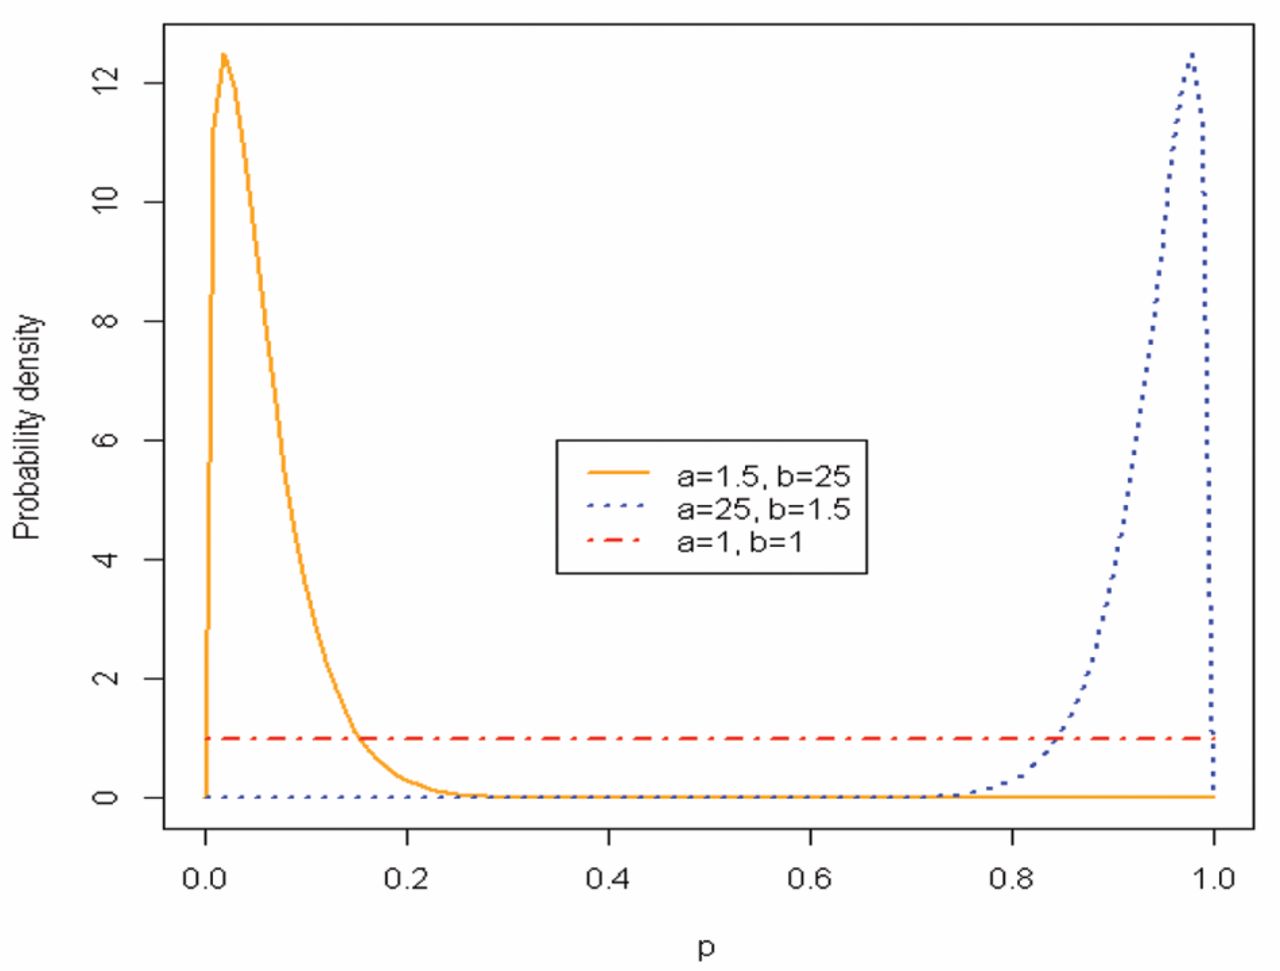
This example demonstrates how knowledge and understanding of the process from Stage 1 process development can be potentially used to help manufactures make risk-based decisions. We suppose that there are three processes whose batch performances from Stage 1 can be characterized by three beta distributions B(1.5, 25), B(25, 1.5), and B(1, 1). Figure 1 displays a plot of the three beta distributions. Using eq 7, the mean probability, standard deviation (SD) and mean ± SD range are calculated and listed in Table II.

Probability densities of B(2, 20), B(20, 2) and B(1, 1).
Summary Statistics of Three Beta Distributions Characterizing Performance Histories of Three Processes
As seen from the plot and table, distribution B(1.5, 25) describes a process of consistently poor performance history in Stage 1. On the average, only 5.7% of samples from a batch in Stage 1 passed potency specification with a narrow one SD range of 1.25–10.1%. By contrast, distribution B(25, 1.5) corresponds to a process that consistently produces batches of high quality during Stage 1 as evidenced by the fact that the mean percent of 94.3% of samples from a batch passing potency specification, with a narrow one SD range of 89.9–98.7%. B(1, 1) represents a process of inconsistent performance, as p is uniformly distributed between 0 and 1 and, on the average, samples from a batch produced in Stage 1 would have a coin-toss odds, 50%, to pass potency specification. If the three-batch-validation rule were used for Stage 2 PPQ, the posterior probability for a future batch produced after a successful Stage 2 PPQ to pass potency specification can be calculated. The results are listed in Table III.
Estimate of Posterior Probability for a Future Batch Produced after a Successful Stage 2 PPQ To Pass Potency Specification
The results in the table indicate that even if all three processes have passed their respective Stage PPQ with three validation batches, product quality assurance in terms of chance for a future batch to meet specification varies greatly among the three processes; the probabilities for a future batch to meet specification are 15.3%, 94.9%, and 80.0% for processes 1, 2, and 3, respectively. The manufacturer would end up rejecting batches produced from process 1 much more often than from processes 2 and 3, incurring unnecessary costs and delaying release of the product to the market. The results in Table III also suggest that a process such as process 2 that has demonstrated good performance during Stage 1 does not need many validation batches for PPQ because with three-batch-validation it already provides a higher degree assurance that a future batch post-Stage 2 PPQ would meet quality standards. In addition, the results suggest that knowledge gained from Stage 1, combined with PPQ results, would in general provide an improved estimate of the probability for the future batch post-Stage 2 to meet quality standards. For example, although a batch from process 3 produced in Stage 1 has an average probability of 50% to pass potency specification, the new evidence that three batches pass Stage PPQ helps provide an improved estimate of the probability, namely, 80%.
Under the same assumptions of prior distributions for the three processes, we estimate the number of validation batches n needed from each of the three processes so that all three processes will warrant the same level of quality assurance to a future batch after a successful Stage 2 PPQ. The quality assurance is defined as the posterior probability for the batch to meet potency specification is greater than or equal to 95%. The results are presented in Table IV.
Number of Validation Batches Needed To Ensure a Future Batch Produced After a Successful Stage 2 PPQ Has Over 95% Probability To Pass Potency Specification
The number n is estimated to be 480, 4, and 18 for processes 1, 2, and 3, respectively. So taking process 1 from Stage 1 to Stage 2 PPQ would be a risky decision, as 480 batches are needed for the PPQ and all of them need to pass pre-specified acceptance criteria—a very high bar to pass. However, process 2 with a track record of good performance shown during Stage 1 only needs 4 validation batches to confirm that it is fit for its intended purpose. The decision to move the process forward to Stage 2 PPQ is relatively risk-free. Process 3 demonstrates a variable performance during Stage 1 as evidenced by the fact that the percent of samples from a batch produced in Stage 1 meeting potency specification varies between 0 and 1, with an average of 50% and one SD range of 21.1–78.9%. Because of its inconsistent performance during Stage 1, process 3 Stage 2 PPQ requires moderately large number of batches (n = 18) to verify the true performance of the process.
Example 3: Comparison between Bayesian and Frequentist Methods
The number of validation batches n is determined using both the generalized Bayesian method and Frequentist approach for three processes discussed in Example 2. Once again it is assumed that the Stage 1 performance of the three processes can be characterized by three beta distributions B(1.5, 25), B(25, 1.5), and B(1, 1), respectively. It is also assumed that quality assurance for the future batches produced after Stage 2 PPQ means least 9 out of 10 future batches produced within a time period or year post-PPQ pass potency specification. For the Bayesian method, this translates into the statement that the posterior probability for at least 9 out of 10 future batches produced after a successful Stage 2 PPQ to pass potency specification is greater than or equal to 95%. By contrast, the equivalent quality assurance statement for the Frequentist method is that with 95% confidence, out of 10 future batches manufactured after a successful Stage 2 PPQ the number of batches that pass specification is greater than or equal to 9. In other words, the lower 95% prediction interval of the number of batches that are produced post-Stage 2 PPQ and that meet potency specification is greater than or equal to 9. Substituting k = 9, l = 10, p0 = 95%, (α, β) = (1.5, 25), (25, 1.5), and (1, 1) into eq 14, the number of validation batches n is determined for the three processes and the results are presented in Table V. Likewise, substituting k = 9, l = 10,  , and z0.95 = 1.65 into eq 18, we have

Number of Validation Batches Needed To Ensure at Least 9 Out of 10 Future Batches Produced After a Successful Stage 2 PPQ Have Over 95% Probability To Pass Potency Specification
In order for the above inequality to hold, n needs to be greater than or equal to 29.
It is worth noting that the number of validation batches n based on the Frequentist method remains the same for all three processes despite that fact that they have shown a drastic difference in performance during Stage 1. The Bayesian method, taking advantage of prior knowledge of the process performance from Stage 1, results in an estimate of n that is large for process 1, which has a poor history of performance as discussed in Example 2, and small for process 2, which shows a track record of good performance during Stage 1, and moderately large for process 3, which demonstrates variable performance in Stage 1. It is safe to conclude that estimates of the number of validation batches for Stage 2 PPQ based on the Bayesian method are consistent with the performance histories of the three processes. The results of the Bayesian method can be used to guide manufacturers to make risk-based decisions as to whether any of the three processes is ready for Stage 2 PPQ, and how likely the Stage 2 PPQ would be successful.
Discussion
Process validation is a good manufacturing practice requirement. Traditionally process validation was a compliance-driven event, aimed at demonstrating that the process is capable of manufacturing three consecutive, commercial-scale batches that pass acceptance testing. As little knowledge is used to identify critical quality attributes that affect product quality, safety, and efficacy, parameters chosen for validation may not be truly indicative of product quality. In addition, the three-validation-batch rule hardly has any scientific or statistical basis because it is conceivable that a process demonstrating good performance during an early development stage would need fewer batches for a perspective validation study and vice versa. As a result, an unnecessarily extended validation study might be designed for a good process, and a reduced validation study might be carried out for a process of poor performance history. The new FDA guidance on process validation recommends a life cycle and risk-based approach to process validation. On one hand, it lends manufacturers the freedom to use data generated from product and process life cycle to validate the process. On the other hand, it presents manufacturers with many new challenges, including determination of the number of validation batches for Stage 2 PPQ.
In this paper a Bayesian method is introduced to determine the number of validation batches required for Stage 2 PPQ. Through both conceptual discussions and simulated examples, I demonstrate the usefulness of the method in helping manufacturers make risk-based decisions so as to minimize the chances of either subjecting a process to Stage 2 PPQ that is unlikely to succeed or pass Stage 2 PPQ by chance for a process that is incapable of consistently producing commercial batches of desired qualities. In addition, the close-form solution of the number of validation batches for Stage 2 PPQ provided by the Bayesian method makes it easy to implement. However, several considerations must be taken into account when applying the method. First of all, process design is an evolving process, with the aim of building quality into the final product. A large amount of data is generated during Stage 1 PD under varying experimental conditions, some of which might not be close to the final manufacturing conditions. As a result, not all the data from Stage 1 PD are usable for Stage 2 PPQ. As the Bayesian method relies on data of historical batch performance to form prior beliefs, statistical tests for similarity or equivalence between data sets should be employed to select data from Stage 1 that were produced under similar conditions to those from Stage 2. Secondly, sometimes there are only a limited number of batches evaluated during Stage 1 PD. In such a case, one can either use multiple within-batch measurements to refine the analysis of limited data on batch-to-batch variation or take advantages of data from the development of similar processes so as to render better characterization of process performance during Stage 1 PD. For the Bayesian method proposed in this paper, both treatments would lead to better estimation of the parameters of beta distribution used to describe historical performance of the process under evaluation. Thirdly, to fully develop a compressive, risk-based solution to determine the number of batches for Stage 2 PPQ, other risk factors such as in-process alarm/control; number of batches that can be realistically produced within a time period to ensure timely regulatory filing; cost associated with Stage 2 PPQ; consumers' acceptable level of product quality; autocorrelation among measurements; criticality of validation parameters such as potency, quantitative, or qualitative nature of these parameters (binary or continuous); statistical capability; and others need to be brought to bear. Lastly, the Bayesian method proposed in this paper is an iterative process in which new evidence can be used to update the probability estimate for the future batches manufactured at any point or stage of process development. The updated probability becomes a new prior belief, and it can be further updated upon availability of data generated from new testing. As a result, it can be used repeatedly throughout the process validation to guide development and improvement efforts, taking a full advantage of newly available data.
Summary
By and large, today's drug product development has become more and more complex. Even if the process passes the traditional three-batch validation, there is little assurance that the future batches would meet quality standards. To mitigate such risk, it is crucial for the manufacturer to use knowledge of the process and product, including potential risks and limitations, to guide the design of the process and product and implement quality control measures throughout the development. In this paper, a Bayesian method is developed to determine the number of validation batches, using combined data from Stage 1 PD and Stage 2 PPQ. Both through conceptual discussions and simulated examples, the method is shown to be risk-based in that high performance in early stages during Stage 1 PD translates to fewer number of validation batches for Stage 2 PPQ study and vice versa. It is a useful tool for manufacturers who need to design Stage 2 PPQ in light of data from Stage 1 and expected outcomes from Stage 2. Also introduced in this paper is a Frequentist approach to the determination of number of validation batches for Stage 2 PPQ. Comparison between the Bayesian and Frequentist methods further highlights the importance of using a life cycle and risk-based approach to process validation recommended by the new FDA guidance. The Bayesian method presented in this paper represent an attempt at applying well developed statistical concepts, principles, and tools to determine the number of validation batches for Stage 2 PPQ. To facilitate the implementation of the new FDA guidance on process validation, more research efforts are needed to address other statistical issues in the guidance.
Acknowledgements
The author would like to thank the three referees for their invaluable comments and instructive suggestions, which help greatly improve the article.
- © PDA, Inc. 2013


