
Abstract
The vial capping process is a critical unit operation during drug product manufacturing, as it could possibly generate cosmetic defects or even affect container closure integrity. Yet there is significant variability in capping equipment and processes, and their relation to potential defects or container closure integrity has not been thoroughly studied. In this study we applied several methods—residual seal force tester, a self-developed system of a piezo force sensor measurement, and computed tomography—to characterize different container closure system combinations that had been sealed using different capping process parameter settings. Additionally, container closure integrity of these samples was measured using helium leakage (physical container closure integrity) and compared to characterization data. The different capping equipment settings lead to residual seal force values from 7 to 115 N. High residual seal force values were achieved with high capping pre-compression force and a short distance between the capping plate and plunge. The choice of container closure system influenced the obtained residual seal force values. The residual seal force tester and piezoelectric measurements showed similar trends. All vials passed physical container closure integrity testing, and no stopper rupture was seen with any of the settings applied, suggesting that container closure integrity was warranted for the studied container closure system with the chosen capping setting ranges.
LAY ABSTRACT: The vial capping process is a critical unit operation during drug product manufacturing, as it could possibly generate cosmetic defects or even affect container closure integrity. Yet there is significant variability in capping equipment and processes, and their relation to potential defects or container closure integrity has not been thoroughly studied. In this study we applied several methods—residual seal force tester, a self-developed system of a piezo force sensor measurement, and computed tomography—to characterize different container closure system combinations that had been sealed using different capping process parameter settings. The residual seal force tester can analyze a variety of different container closure systems independent of the capping equipment. An adequate and safe residual seal force range for each container closure system configuration can be established with the residual seal force tester and additional methods like computed tomography scans and leak testing. In the residual seal force range studied, the physical container closure integrity of the container closure system was warranted.
- Capping
- Residual seal force
- Container closure integrity
- Helium leakage
- Container closure system
- Stopper
- Vial
- Cap
- Seal
- Process control
Introduction
Parenteral pharmaceuticals are protected from external influences by appropriate container closure systems (CCSs). To date, the prevalent CCS configuration for parenteral drug products is the glass vial with a rubber stopper capped with an aluminum crimp cap (1). CCSs can be selected from a variety of vials, stoppers, and crimp caps, which need to be carefully chosen as a combination by the pharmaceutical manufacturer. These CCSs need to be qualified prior any human use of the drug product in order to ensure the suitability of the combination of the three primary packaging components. This includes the assessment of container closure integrity (CCI) of the combined CCS, considering its specifications and variances (e.g., dimensions). Any failure of CCI followed by microbial contamination, thus, insterility of the sterile parenteral product, can cause serious side effects in patients (2). In addition to providing a barrier against microorganisms, the CCS can provide some barrier options against gas, such as oxygen, or moisture. This can be of significance because some products, such as biologics, can be sensitive for oxygen (3) or moisture (4), requiring a protective (nitrogen) vial headspace (5).
CCI needs to be maintained not only in a given CCS, but needs to be ensured in context of the different unit operations that can and will occur for a drug product unit container, such as capping, as well as shipping. The vial capping is a potentially critical drug product manufacturing unit operation, as it can lead to cosmetic defects such as scratches on the vial neck and crimp cap, or possibly the loss of CCI. A robust capping process needs careful process design and qualification in order to minimize possible product impact. An important process parameter of capping is capping force. Large-scale capping equipment often translates the vial capping force from equipment pressure parameters. However, the capping process is in fact an interplay of different process parameters (e.g., capping plate height, capping plate shape, capping plate angle, speed of the turntables, etc.) and thus highly equipment-specific. Consequently, the capping force/pressure alone provides limited insight about the capping process.
To date, the correct adjustment of capping equipment in drug product manufacturing facilities are validated as follows: Firstly, final crimped vials are checked visually (100%) for any defects, such as lose crimp caps, scratches on the vial neck (possibly induced by the crimp cap), and defects on the crimp cap itself like scratches, wrinkles, or dints. Secondly, crimped vials are tested for sterility and often CCI during quality control stability.
Several guidelines are available detailing CCI testing (6, 7). CCI testing can be performed using microbial CCI (mCCI) tests and/or physical CCI (pCCI) tests. As an example for pCCI testing, a mass spectrometry–based helium leak test can be used as described elsewhere (8, 9). The mass spectrometry helium leak testing is considered sensitive for possible leaks and has proven a good correlation to mCCI testing (10, 11), though it is a destructive test.
However, while these measurements do ensure the quality of the product and provide assurance on CCI of the CCS under actual manufacturing conditions, some challenges exist. Visual inspections are subjective, highly operator-dependent, and demand extensive training (3). Some defects, such as dimpling of rubber stoppers, cannot easily being detected under the flip-off button. PCCI leak testing is indispensable to ensure CCI. However, this method provides no information about the actual capping process, the applied capping forces during the capping process, as well as the residual seal force (RSF) of the capped vial.
RSF is defined as the force exalted by a compressed rubber stopper against the vial sealing area (12). Therefore, RSF is an indicator for the seal tightness. The RSF tester allows the analysis of the RSF of a capped vial (12⇓⇓–15). The RSF tester is an ordinary stress-strain instrument. The system applies a compression force onto the capped vial over a distance and calculates the RSF out of the compression stress/distance plot. In contrast to the visual inspection and leak testing, the RSF tester needs only little training and allows a precise monitoring of the actual capping process, independent of actual capping equipment used, and it is able to capture all process parameters of the capping unit operation, not only the capping pressure.
Despite the potential of the RSF tester, there are yet no reports available that used a RSF tester to test a variety of capping conditions and a variety of CCSs, in connection with actual pCCI testing.
The goal of this study was to apply different capping parameters for various CCSs to further test RSF and characterize crimped units, visually and by computed tomography (CT) (16), and to correlate the RSF results to a newly developed method, the piezoelectric force measurement, as well as pCCI using helium leakage (11). We also wanted to understand possible limitations of the RSF tester, such as impact of the presence or absence of the flip-off button, and the impact of rubber stopper defects like rubber stopper deformation, dimpling, or rupture. CT and a device built in-house were also used to measure the rubber stopper compression after the vial capping process. The rubber stopper compression was correlated to the RSF values of the capped vial as well as pCCI.
Materials and Methods
Vials, Rubber Stopper, and Crimp Caps
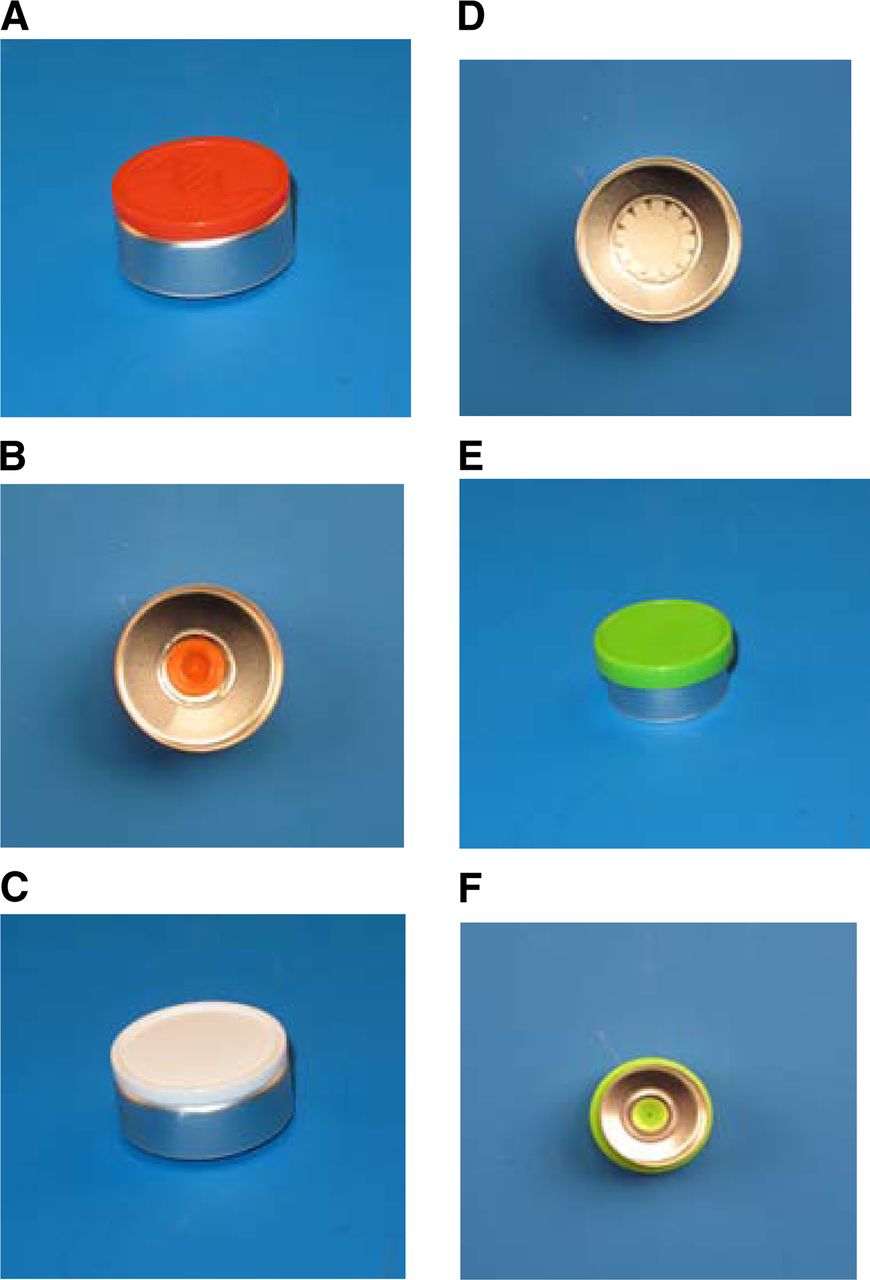
Type I glass vials (3 mL and 15 mL) were purchased from Schott Forma Vitrum AG (St. Gallen, Switzerland). The 3 mL vials had a flange outside diameter of 13 mm; the 15 mL vials had a flange outside diameter of 20 mm. Three different rubber stopper elastomer formulations and two different designs were investigated in this study: The Daikyo Seiko (Tokyo, Japan) 777-1 (D777) serum rubber stopper as well as the corresponding lyo rubber stopper, the Daikyo Seiko 713 (D713) serum rubber stopper, and the West (Exton, PA, USA) 4432-50 (W4432-50) serum and lyo rubber stopper. The flange height and Shore A hardness of the used rubber stoppers are summarized in Table I and Table II. The different vial and rubber stopper combinations were capped with crimp caps from Datwyler (Altdorf, Switzerland) or West. The 15 mL vials were capped with a Datwyler and a West crimp cap; the 3 mL vials were only capped with a West crimp cap (Figure 1). The thickness of the aluminum cap skirt of the 15 mL caps was 0.22 mm; the thickness of the aluminum cap skirt of the 3 mL caps was 0.2 mm. All materials were taken as received from the suppliers without further pre-treatment (such as washing or sterilization). The same batch of vials, stopper, and crimp caps were used for all experiments to exclude potential batch-to-batch variability.
Flange Height and the Elastomer Hardness of the Different Rubber Stoppers Used in Combination with 15 mL Vials
Flange Height and Elastomer Hardness of the Different Rubber Stoppers Used in Combination with the 3 mL Vials

The used crimp caps: (A, B): West crimp cap for 15 mL vials with pre-cut aluminum bridges connecting the flush flip-off button to the aluminum part. (C, D): Datwyler crimp cap for 15 mL vials with fingers connecting the flush flip-off button to the aluminum part. (E, F): West crimp cap for 3 mL vials with pre-cut bridges connecting the overhanging flip-off button to the aluminum part.
Vial Capping
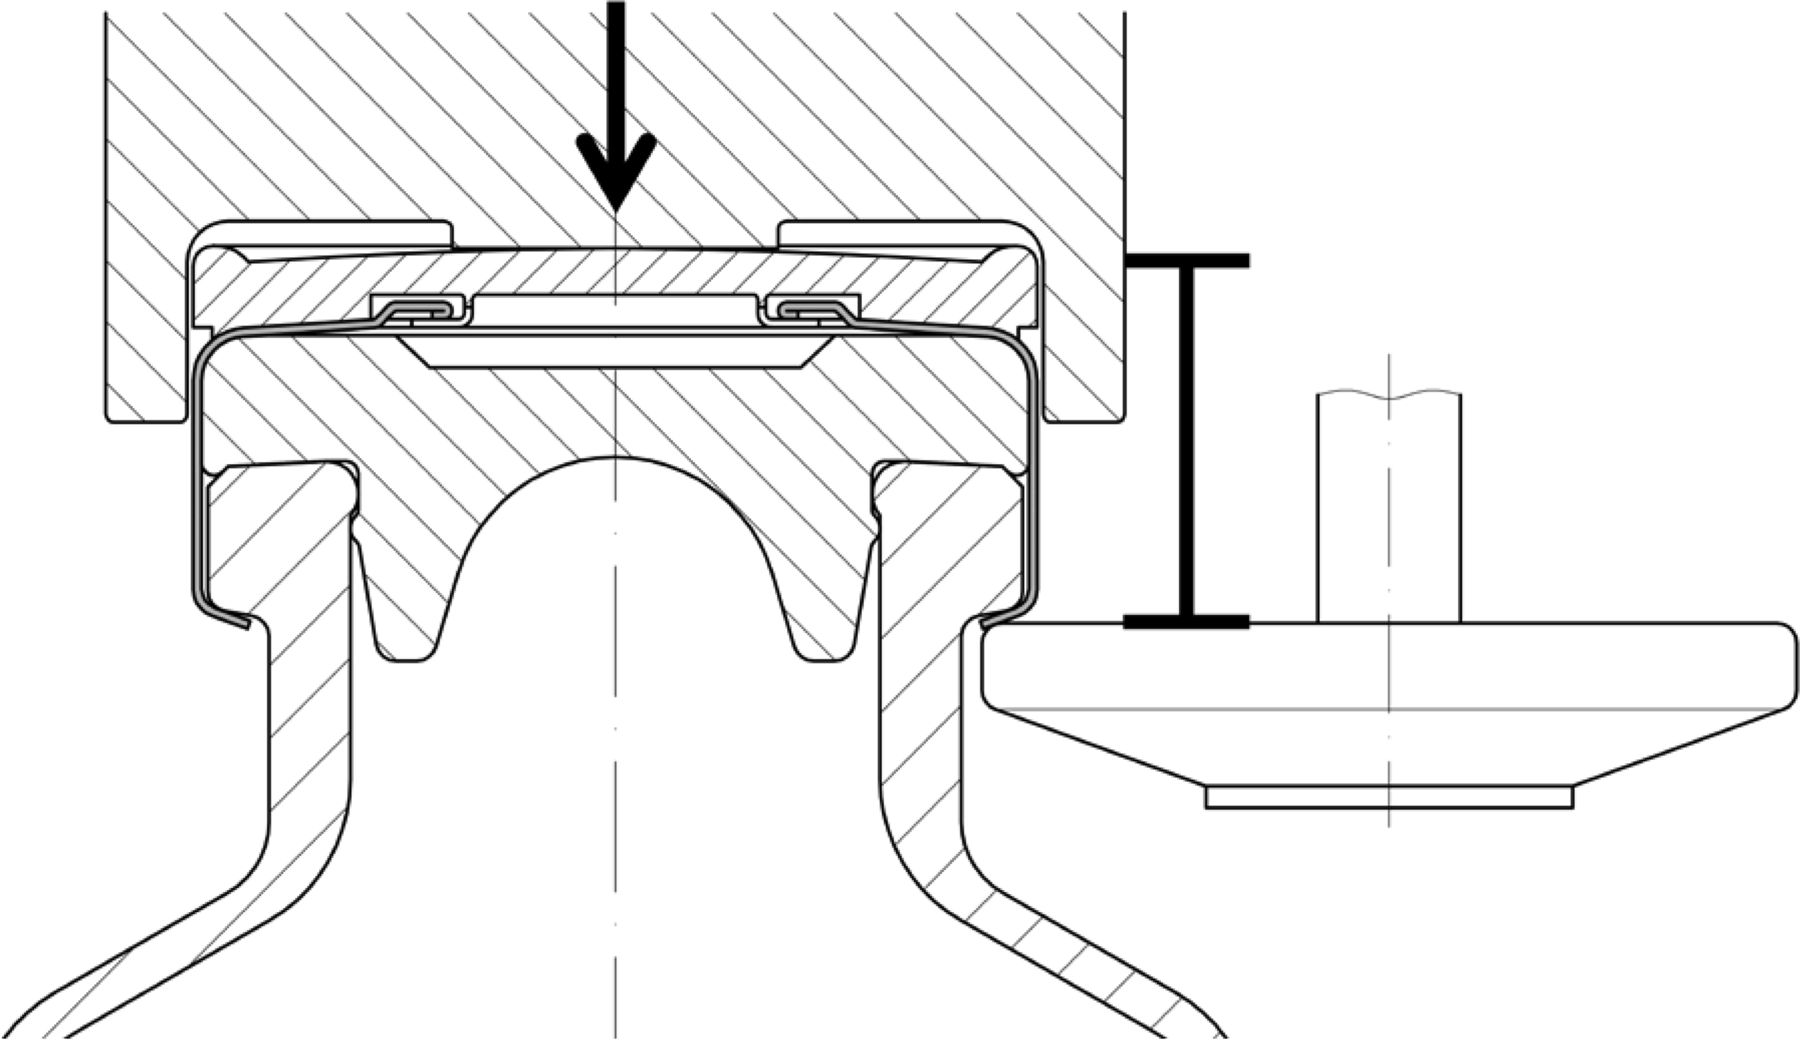
The different vial, rubber stopper, and crimp cap combinations were capped using an Integra West Capper (Genesis Packaging Technologies, Exton, PA, USA). The capping pre-compression force (Figure 2, arrow) as well as the capping plate-plunger distance (distance between plunger and capping plate, Figure 2, caliper) were modified in the set of experiments. Other capping parameters, such as capping plate shape, capping plate angle, and speed of the turntables, were kept constant in all experiments.

The vial capping process: Arrow = pre-compression force, caliper = distance capping plate-plunger.
Five different capping-force and capping plate-plunger distance combinations were applied to seal the 15 mL vials (Table III). Six different capping equipment settings were applied to seal the 3 mL vials (Table III). The 3 mL vials feature a smaller vial head and are equipped with smaller rubber stoppers compared to the 15 mL vials. Therefore, overall smaller capping plate-plunger distances were required for the 3 mL vials to achieve an acceptable capping result. The capping plate-plunger distance can be adjusted in 0.025 mm steps; the capping pre-compression force can be set to 44.48 N and up to 289.13 N.
Overview of the Capping Equipment Settings Used in This Study
Measurement of RSF
RSF was measured using the instrument from Genesis Packaging Technologies (Exton, PA, USA). The RSF tester's measuring principle is described in detail by Morton et al. (12–13) and Ludwig et al. (15). Different cap anvils were produced internally to fit the Datwyler and West crimp caps (with/without flip-off button). All measurements were performed in verbose mode to collect the raw data with a serial port. Twenty vials per sample group were measured. The instrument operates by generating each RSF value from an average of three measurements.
Piezoelectric Force Testing
To study seal force, a new system was developed in our own labs (17). The piezoelectric force sensor and the test signal box were purchased from Kistler (Winterthur, Switzerland) (Figure 3A). As measurement cannot be done with the final drug product, a stainless steel vial (piezo vial), identical to a 3 mL and 15 mL glass vial, had to be developed and was built in-house. The vial sealing area was connected to a piezoelectric force sensor inside the vial. The piezo vial can be equipped with different rubber stopper flanges (the lower part of the rubber stopper needs to be removed) and crimp caps (Figure 3A). The applied force by the rubber stopper flange onto the vial sealing area could be measured during (Figure 4B) and after the capping process (Figure 4A). The piezo vial force measurement was calibrated, using calibrated weights (0.1–15.9 kg). Process parameters were chosen based on prior experience with this new technique (data not shown): Each force measurement was performed for 5 min at 10Hz. The RSF of the capped vial was calculated by averaging the last 100 test points (the last 10 s of each run). The piezo force vial measurements took 5 min compared to 15 s of the RSF tester measurements. Therefore, only five repeats per sample group were performed for each test setup.
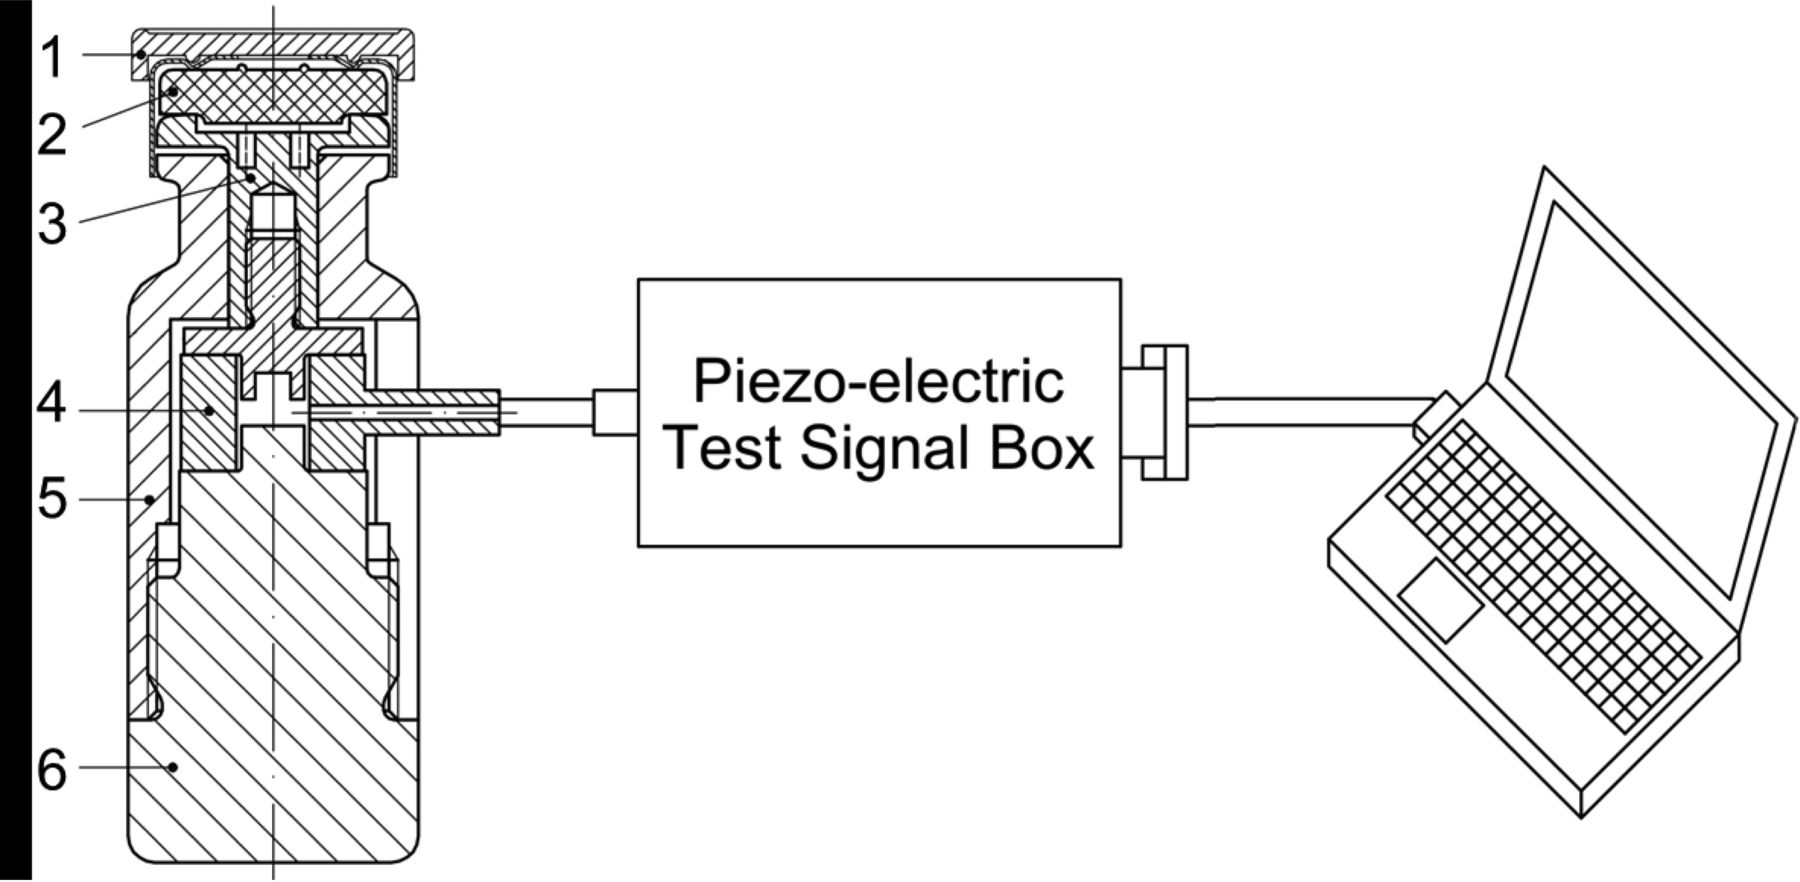
(A) Piezoelectric force sensor in a 3 mL or 15 mL steel vial (piezo vial), 1: Flip-off button, 2: Rubber stopper, 3: Plunger top section, 4: Piezoelectric sensor, 5: Metal vial upper section, 6: Metal vial lower section. (B) calibration of the piezoelectric force sensor vial with a defined mass.
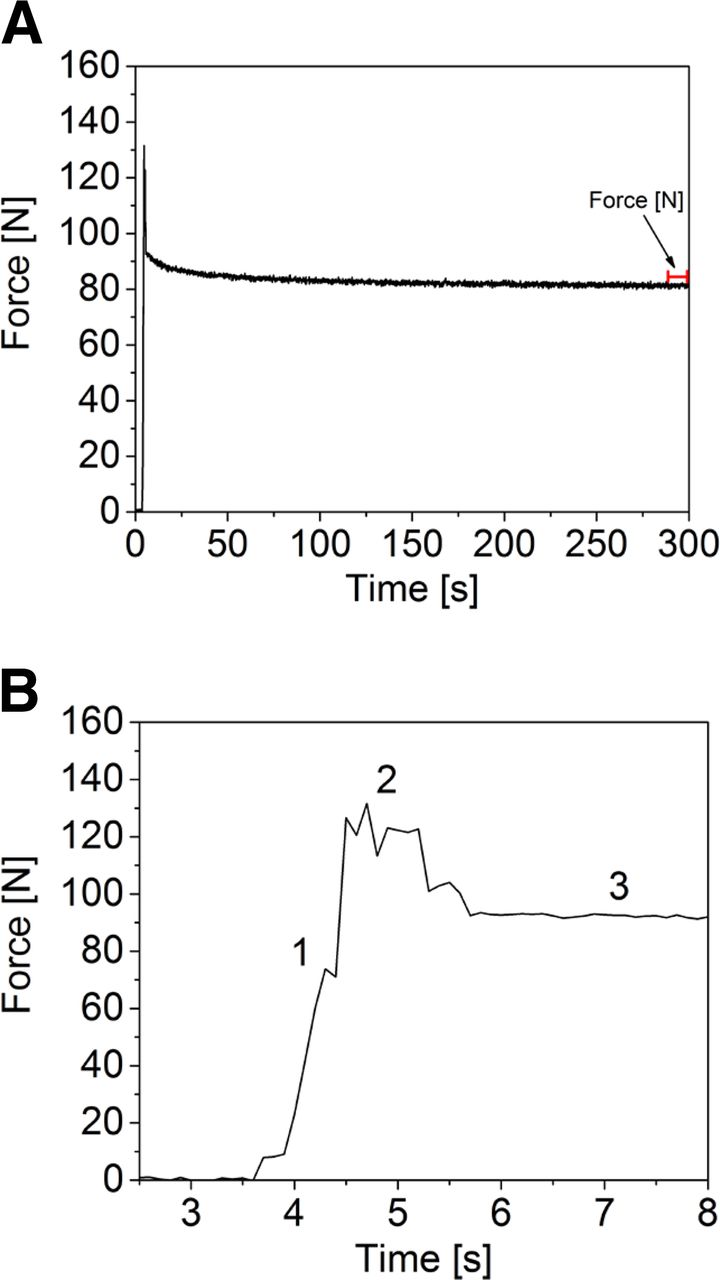
A typical piezo force N/time (s) plot: (A) 5 min capping process measurement with the piezo vial, the calculated force (N) is the average of the last 100 measuring points (last 10 s). (B) The capping process: 1: Capping pre-compression force applied by plunger (Table III: 15 mL vial capping equipment setting 4: 75.62 N), 2: Capping plate folds cap skirt under the vial flange, force increases, 3: Piezo force of the capped vial after the capping process.
Vial Height Measurements
The rubber stopper compression was calculated by the ratio of the rubber stopper flange height before and after the capping process. The different packaging components were measured with a measuring unit built in-house. The measuring unit comprised of two metal bars holding the CCS connected by a digital caliper (accuracy 0.01 mm). The rubber stopper flange height was calculated by the difference of the vial height with and without a rubber stopper. Then the vial with a rubber stopper and a crimp cap was measured before and after the capping process to measure the difference in rubber stopper flange height that resulted from the capping process. The final rubber stopper compression in percent was calculated by the loss of rubber stopper flange height after the capping process divided by rubber stopper flange height before the capping process. In this test setup packaging specification deviation were accounted for, as each vial, rubber stopper, and crimp cap was measured individually.
Computed Tomography (CT)
CT measurements were performed with the microCT system exactCT (Wenzel, Volumetric GmbH, Singen, Germany). High resolution and quick measuring time were chosen with x-ray source power settings of 95V/2.5 mA. Data analysis was performed with the exactCT control software 2.0 (Wenzel, Volumetric GmbH, Singen, Germany). The rubber stopper flange height of each vial was measured at four different points. CT measurements are time-consuming (depending on image qualities up to several hours) and demand non-trivial 3D image reconstruction and analysis. Therefore, only one vial per sample group could be measured, making this impractical for actual use in research and development or in quality control.
Container Closure Integrity Testing (pCCI) Using Helium Leakage
The overall test setup was adopted from Morrical et al. (11). In brief, a capped vial was cut open with a diamond blade on the vial bottom. Then it was placed in an in-house-manufactured airtight flange, which was connected to the helium leak detector. The vacuum pump was turned on and helium gas was applied. The results of the helium leak measurements were documented by the operator. Helium leak detection was performed using an ASM340 mass spectrometric helium leak detector (Pfeifer Vacuum, Asslar, Germany). The helium leak detector can detect leak rates down to 5 × 10–-12 mbar L/s. The lower detection limit of the helium leak detector is well below the detected base line signal of sufficiently sealed vials. The leak rate cut-off for CCI failure was set to 10–7 mbar L/s, based on prior data that correlated microbial ingress (mCCI) and helium leakage rates (pCCI) using samples with artificial leaks generated by introduction of copper wires of different sizes. The helium leak cut-off value was set to the lowest individual helium leak rate at which microbial ingress was last observed (Figure 5). The mCCI and pCCI correlation was performed for the different CCS configurations, including positive and negative control groups. Any capped vial with a leak rate of 10–7 mbar L/s or below was considered as an integral system.

The mCCI and pCCI correlation: Each data point represents 15 vials; the s-axis is the averaged helium leak rate of a sample group, and the y-axis is the corresponding percentage of vials with microbial ingress.
Statistical analysis was performed with Microsoft Excel 2010. A one-way analysis of variance (ANOVA) followed by a post-hoc Student's t-test was performed. The P-value was set to <0.01.
Results and Discussion
Five (15 mL vials) or six (3 mL vials) different capping equipment settings and different primary packaging components were investigated to analyze
the potential correlation of capping force and/or capping plate height to RSF
the impact of the rubber stopper, specifically
impact of stopper flange height and elastomer hardness
impact of stopper design (serum versus lyo)
the impact of the crimp cap
the applicability of piezoelectric force measurements and their correlation to RSF
the impact of analyzing vials with and without a flip-off button on RSF
stopper compression using extended characterization specifically
CT
Vial height measurements
Different settings for capping using the Integra West capper were chosen to generate the samples for further testing, varying capping force and capping plate height (as described in The Materials and Methods).
1. Residual Seal Force Is Influenced by Capping Force and Capping Plate Height
The RSF values measured for the different capping equipment settings and three different rubber stopper elastomer formulations are shown in Figure 6 for the serum rubber stoppers. The achieved RSF values in Figure 6A cannot be directly correlated to capping force alone: The CCSs capped with capping equipment settings 1–3 were all capped with the same capping pre-compression force of 44.45 N; however, they show different RSF values. The decrease in capping plate-plunger distance significantly affected the RSF of the capped vials, for example, D777 (black bar Figure 6A) from 9.8 ± 3.2 N up to 39.8 ± 4.3 N). Additionally, vials capped with capping equipment setting 5 (capping pre-compression force = 222.41 N) only displayed an RSF of 110.2 ± 16.7 N. Similar observations were made for the 3 mL vials (Figure 7A). In conclusion, the RSF values of a capped vial cannot be solely derived from capping equipment process parameters. The applied force during the capping process is an interplay of the capping force and the capping plate-plunger distance.
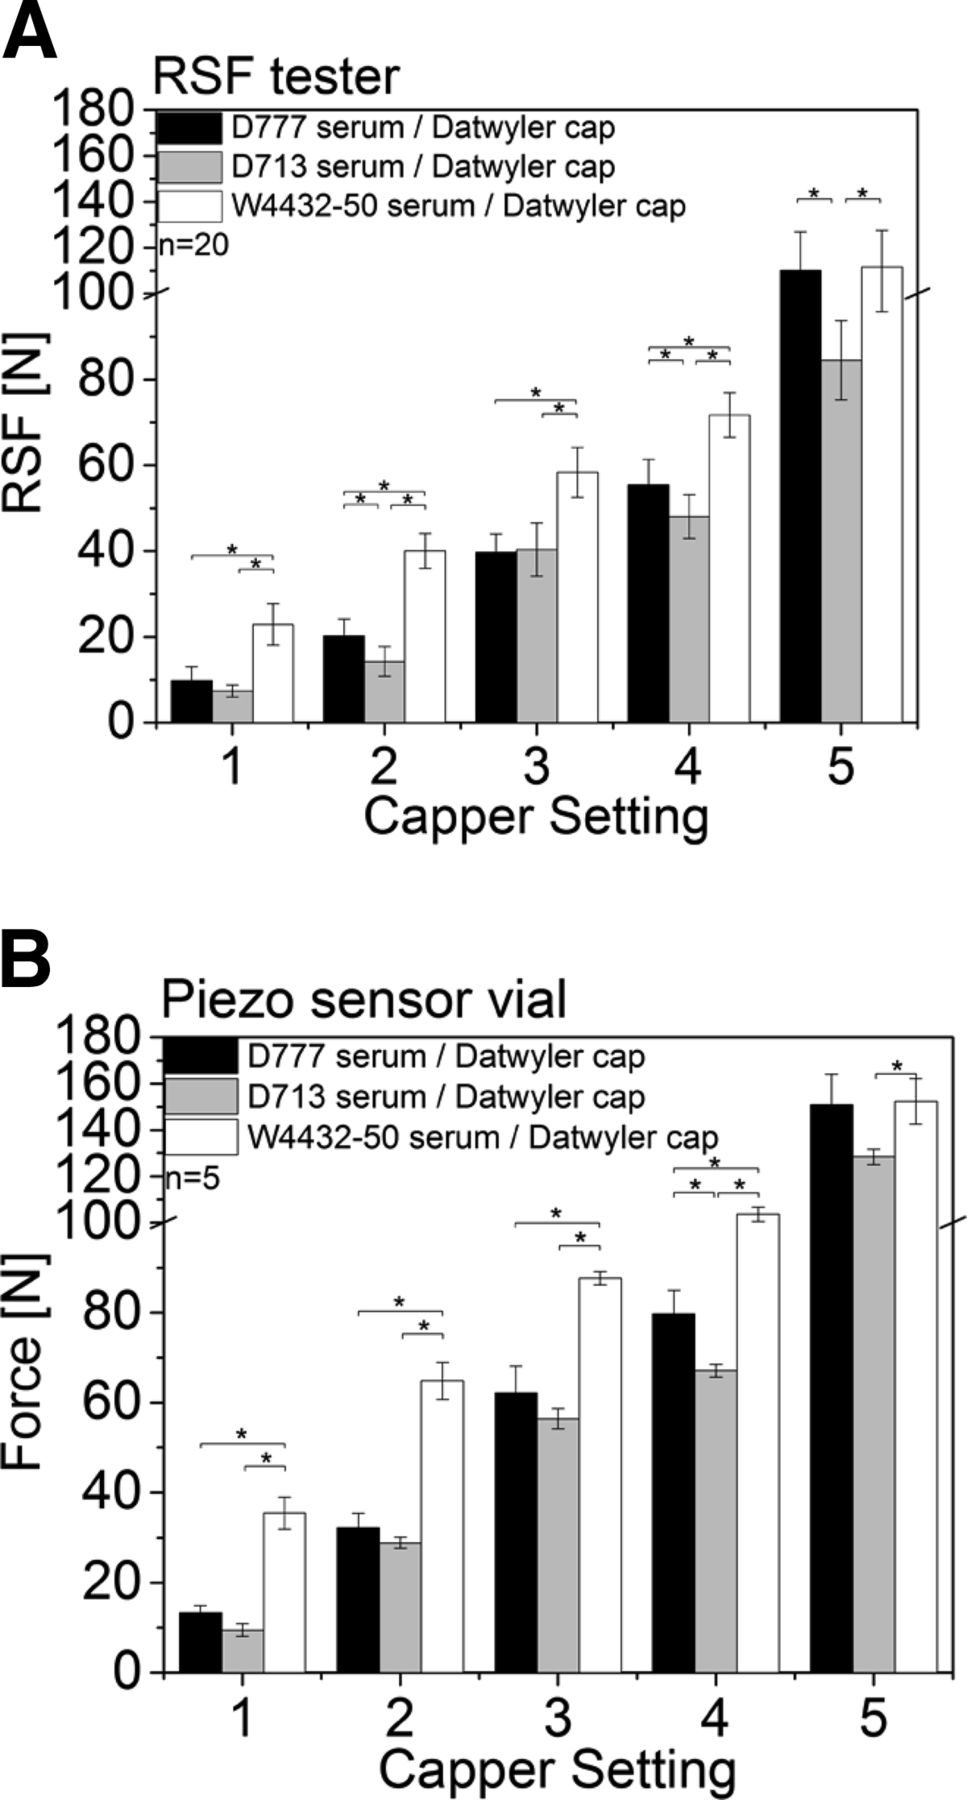
RSF values of 15 mL vials capped with a Datwyler crimp cap and different rubber stoppers and 5 different capper settings. Black: Daikyo D777 serum rubber stopper, Grey: Daikyo D713 serum rubber stopper, White: West 4432-50 serum rubber stopper. (A) Measurements performed with the RSF tester. (B) Measurements performed with the piezo sensor vial.
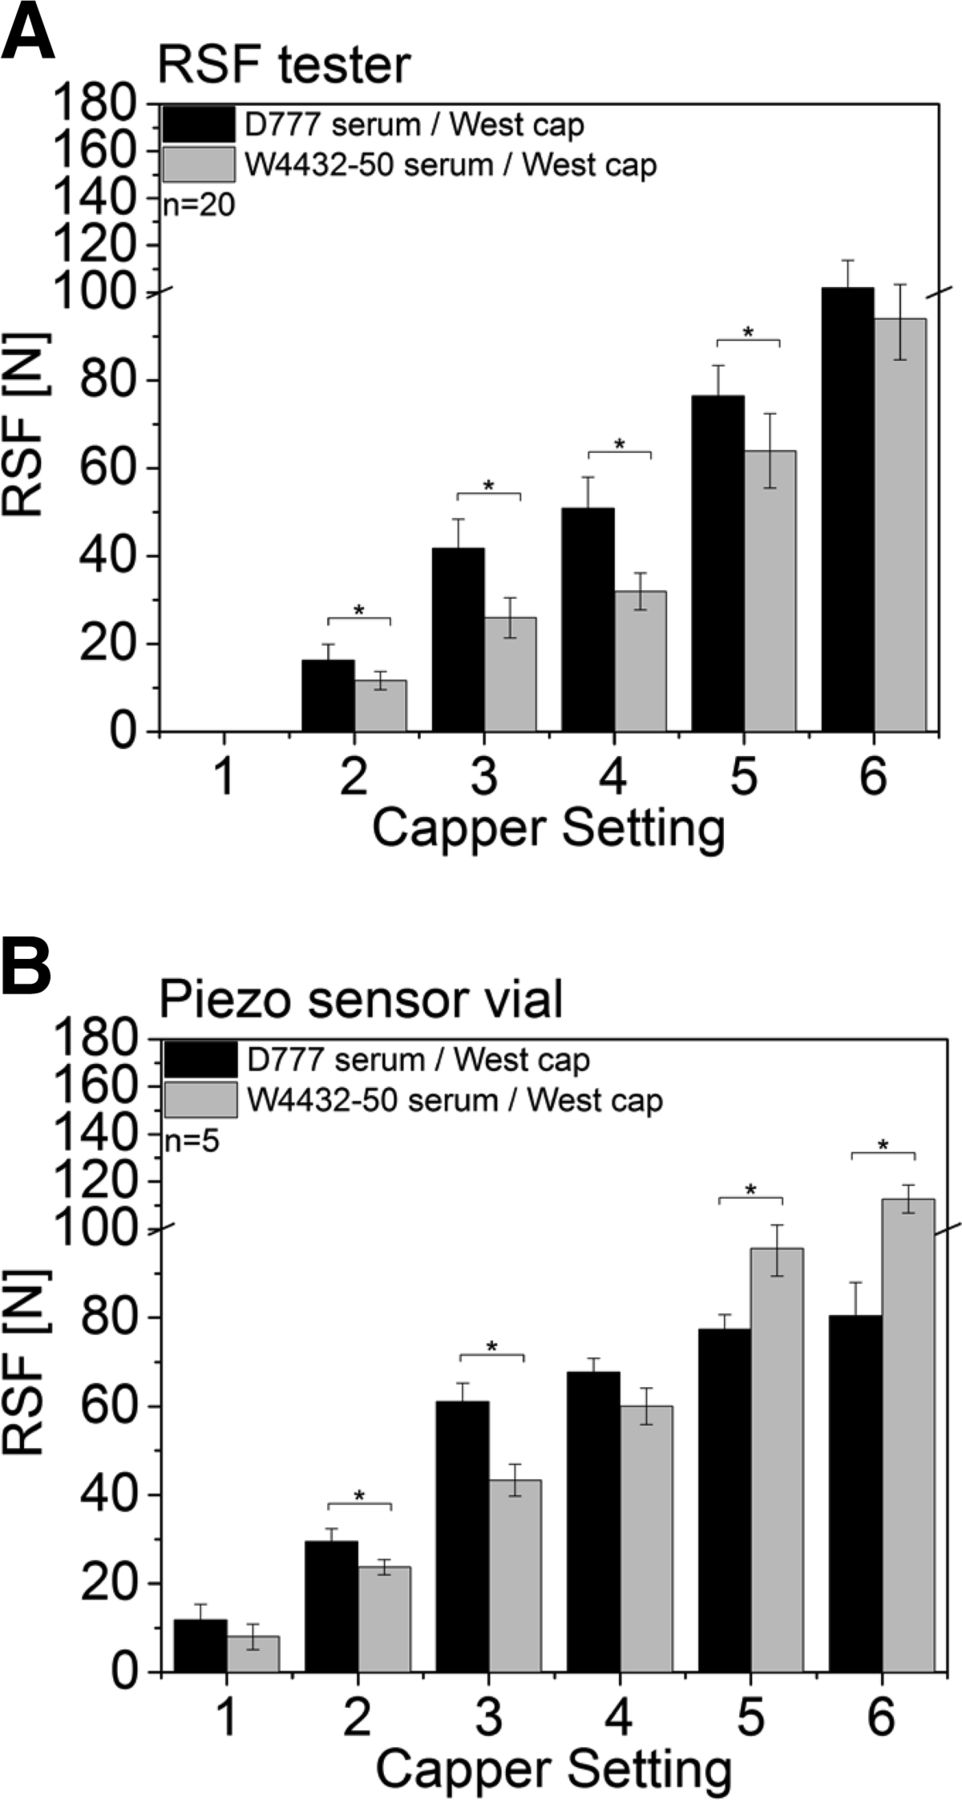
RSF values of 3 mL vials with different rubber stoppers and a West crimp cap. (A) Measurements performed with the RSF tester; black bars, Daikyo D777 serum rubber stopper; grey bars, W4432-50 serum rubber stopper. (B) Measurements performed with the piezo sensor vial; black bars, Daikyo D777 serum rubber stopper; grey bars, W4432-50 serum rubber stopper.
2. RSF Is Impacted by the Choice of Rubber Stopper and Its Formulation
2.a. 15 mL Vials:
Three different rubber stoppers (Table I) were used to investigate the impact of the flange height and Shore A hardness on the RSF of the closed CCS.
The Shore A hardness of the three rubber stoppers chosen for our study ranged between 37 and 50. In addition, the West 4432-50 stopper has a higher flange height than the two Daikyo rubber stoppers (Table I), whereas flange height of the other two stoppers was only marginally different.
Figure 6A shows only minor differences on RSF between the two Daikyo rubber stoppers, whereas the CCS using the West 4432-50 serum rubber stopper displayed a significant increased RSF. For example, for vials capped with capping equipment setting 3, the D777 serum rubber stopper showed an RSF of 39.8 ± 4.3 N, whereas the West 4432-50 serum rubber stopper had an RSF of 58.4 ± 5.7 N (Figure 6A).
Considering that the West 4432-50 stopper has the highest Shore A hardness and flange height, both parameters could possibly contribute to the difference in RSF. As the Daikyo 713 and 777 also show different Shore A hardness values, although their RSF values are somewhat similar, it seems that mostly rubber stopper flange height had a major influence on the RSF of a capped vial, although effects are difficult to delineate. The difference in stopper elasticity, as a function of the stopper formulation and manufacturing process, may possibly also drive the difference in RSF.
The piezo sensor vial was capable of analyzing the seal force of a capped vial. The measured force values were a function of the capping pre-compression force and the capping plate-plunger distance. Similar to the measurements with the RSF tester, the piezo sensor vial measured the lowest force values for capping equipment setting 1 and the highest force values for capping equipment setting 5. The overall force values of the piezo vial were slightly higher compared to the RSF values measured with the RSF tester (Figure 6B). However, the different rubber stoppers displayed similar trends. The West 4432-50 rubber stopper had the highest force values followed by the D777 and the D713 rubber stopper.
2.b. 3 mL Vials:
Following the 15 mL vials, 3 mL vials with a smaller vial neck were measured with the RSF tester (Figure 7A). Similar results were obtained.
The D777 serum rubber stopper had a larger flange height (2.29 mm for the D777 versus 2.05 mm for the W4432-50, Table II) and showed higher RSF values in all measured sample groups (significantly different for capping equipment settings 2–5). For example, at capping equipment setting 3 the D777 shows an RSF of 41.7 ± 6.7 N compared to 26.0 ± 4.5 N for the W4432-50 (black versus grey bars, Figure 7A). The RSF tester could not analyze samples sealed with capping equipment setting 1.
The force values measured with the piezo sensor vial showed similar trends at capping equipment settings 1–4. However, the force values for the West W4432-50 serum rubber stopper were higher at capping equipment settings 5 and 6.
A higher rubber stopper flange height increased the RSF of 3 mL vials and 15 mL vials. During the capping process the capping plate pushes under the vial lip applying an additional force, which results in further rubber stopper compression. The distance between the plunger and the capping plate is fixed. Therefore, rubber stoppers with a higher flange height get further compressed to allow the capping plate under the vial flange. As a result the rubber stopper compression for rubber stoppers with a higher flange height increases; this results in an overall higher RSF. Likewise, a smaller capping plate-plunger distance leads to higher rubber stopper compression and higher RSF values.
3. The rubber Stopper Design (Lyo versus Serum Stopper) Only Had a Minor Impact on RSF
3.a. 15 mL Vials:
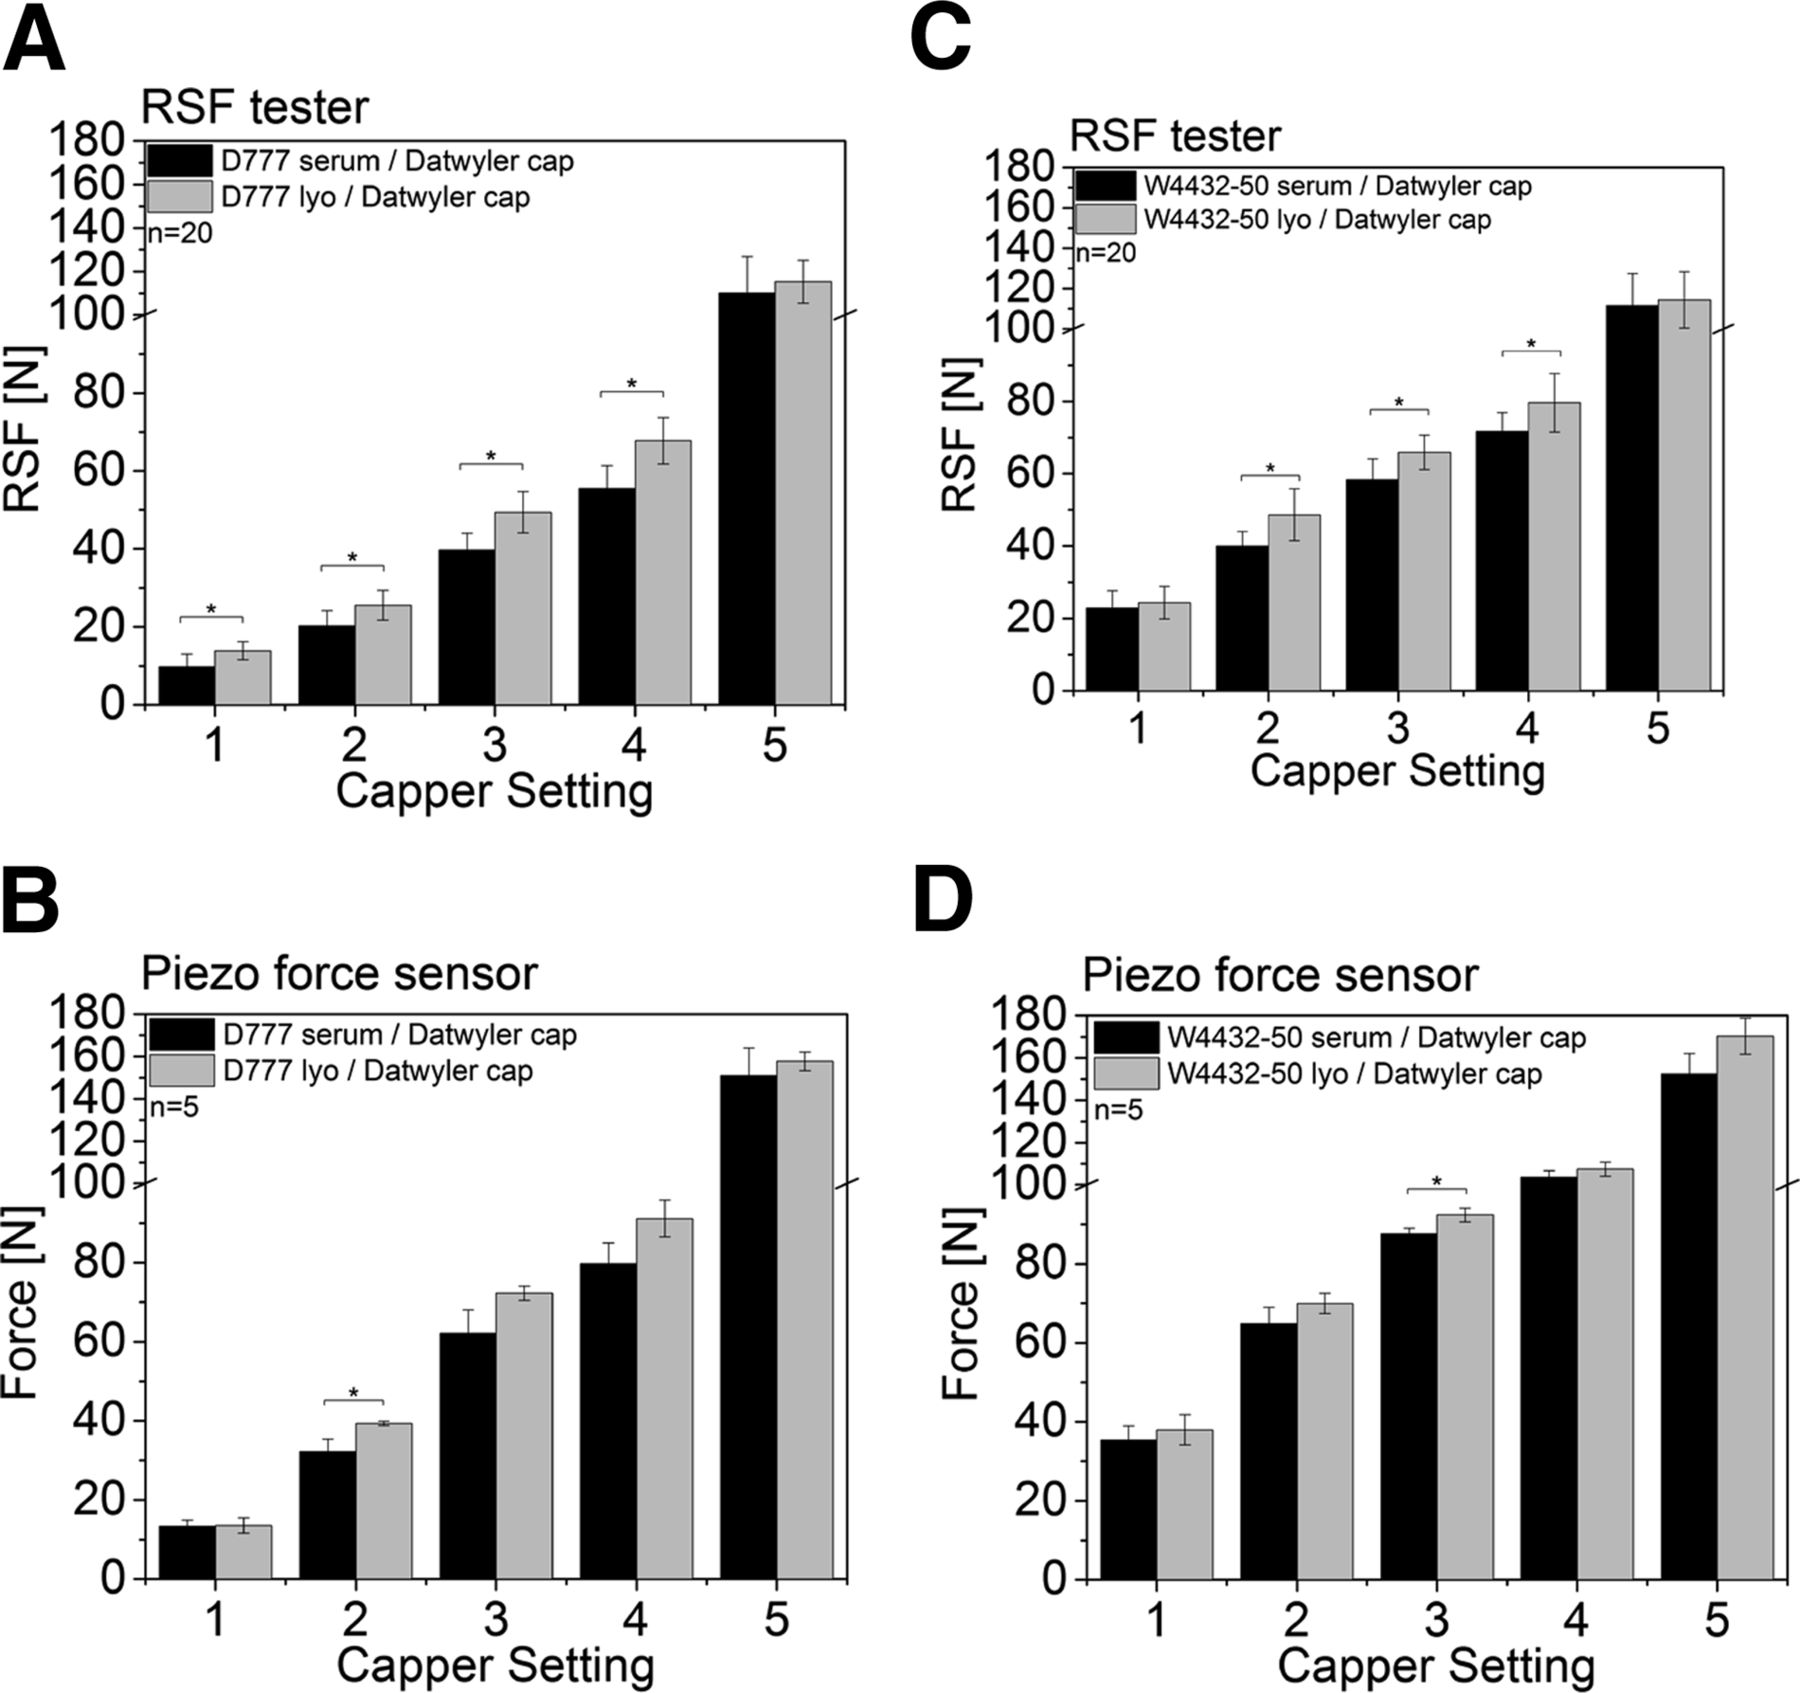
Following the comparison of rubber stopper flange height and Shore A hardness on different serum rubber stoppers, the impact of the rubber stopper design (lyo versus serum) on RSF was investigated. The lyo and serum rubber stoppers analyzed in this study displayed two major differences: (a) the overall geometry of the lyo rubber stopper with a longer and more rigid plug, and (b) the lyo stoppers have a rigid top surface coating (to prevent sticking on the lyophilization shelves during the vial closure after drying). Shore A hardness and flange height of the same rubber stopper formulation in different configuration was comparable (i.e., Shore A hardness 37 for the Daikyo rubber stoppers and 50 for the West 4432-50 rubber stoppers, Table I). The flange height also was comparable between the serum and the lyo version of the same rubber formulation (2.97 mm for serum versus 3.06 mm for lyo of the Daikyo rubber stopper, and 3.33 mm for serum versus 3.35 mm for lyo of the West 4432-50 rubber stopper, Table I).
Figure 8A,C provides RSF data for CCS with serum and lyo rubber stoppers, after capping with the same five different capping setting. A similar trend to data from the serum rubber stoppers (Figure 6) could be observed for lyo rubber stoppers; the West 4432-50 rubber stoppers (Figure 8C) showed higher RSF compared to the Daikyo rubber-stoppered CCS (Figure 8A).

RSF values of 15 mL vials capped with a Datwyler and D777 or W4432-50 serum or lyo rubber stoppers. Serum: Black, Lyo: Grey. (A) D777 serum (black), lyo (grey) rubber stopper with a Datwyler crimp cap measured with the RSF tester. (B) D777 serum (black), lyo (grey) rubber stopper with a Datwyler crimp cap measured with the piezo sensor vial. (C) W4432-50 serum (black), lyo (grey) rubber stopper with a Datwyler crimp cap measured with the RSF tester. (D) W4432-50 serum (black), lyo (grey) rubber stopper with a Datwyler crimp cap measured with the piezo sensor vial.
When comparing lyo to serum stoppers, statistically significant higher RSF values were found for several lyo rubber stopper sample groups (for both the West and Daikyo rubber stoppers) compared to their serum rubber stopper configurations. However, the difference in absolute values was small. For example, the Daikyo lyo rubber stopper showed an RSF value of 49.4 ± 5.3 N (capping equipment setting 3) whereas the corresponding serum stopper only showed RSF values of 39.8 ± 4.3 N (Figure 8A), and the West 4432-50 lyo rubber stopper displayed a RSF value of 65.9 ± 4.7 N whereas the West 4432-50 serum stopper had a RSF value of 58.4 ± 5.7 N (Figure 8A).
Again, the force values obtained with the piezo vial were slightly higher in absolute values than the RSF values measured with the RSF tester. However, all configuration showed identical trends compared to measurements with the RSF tester (Figure 8B,D).
3.b. 3 mL Vials:
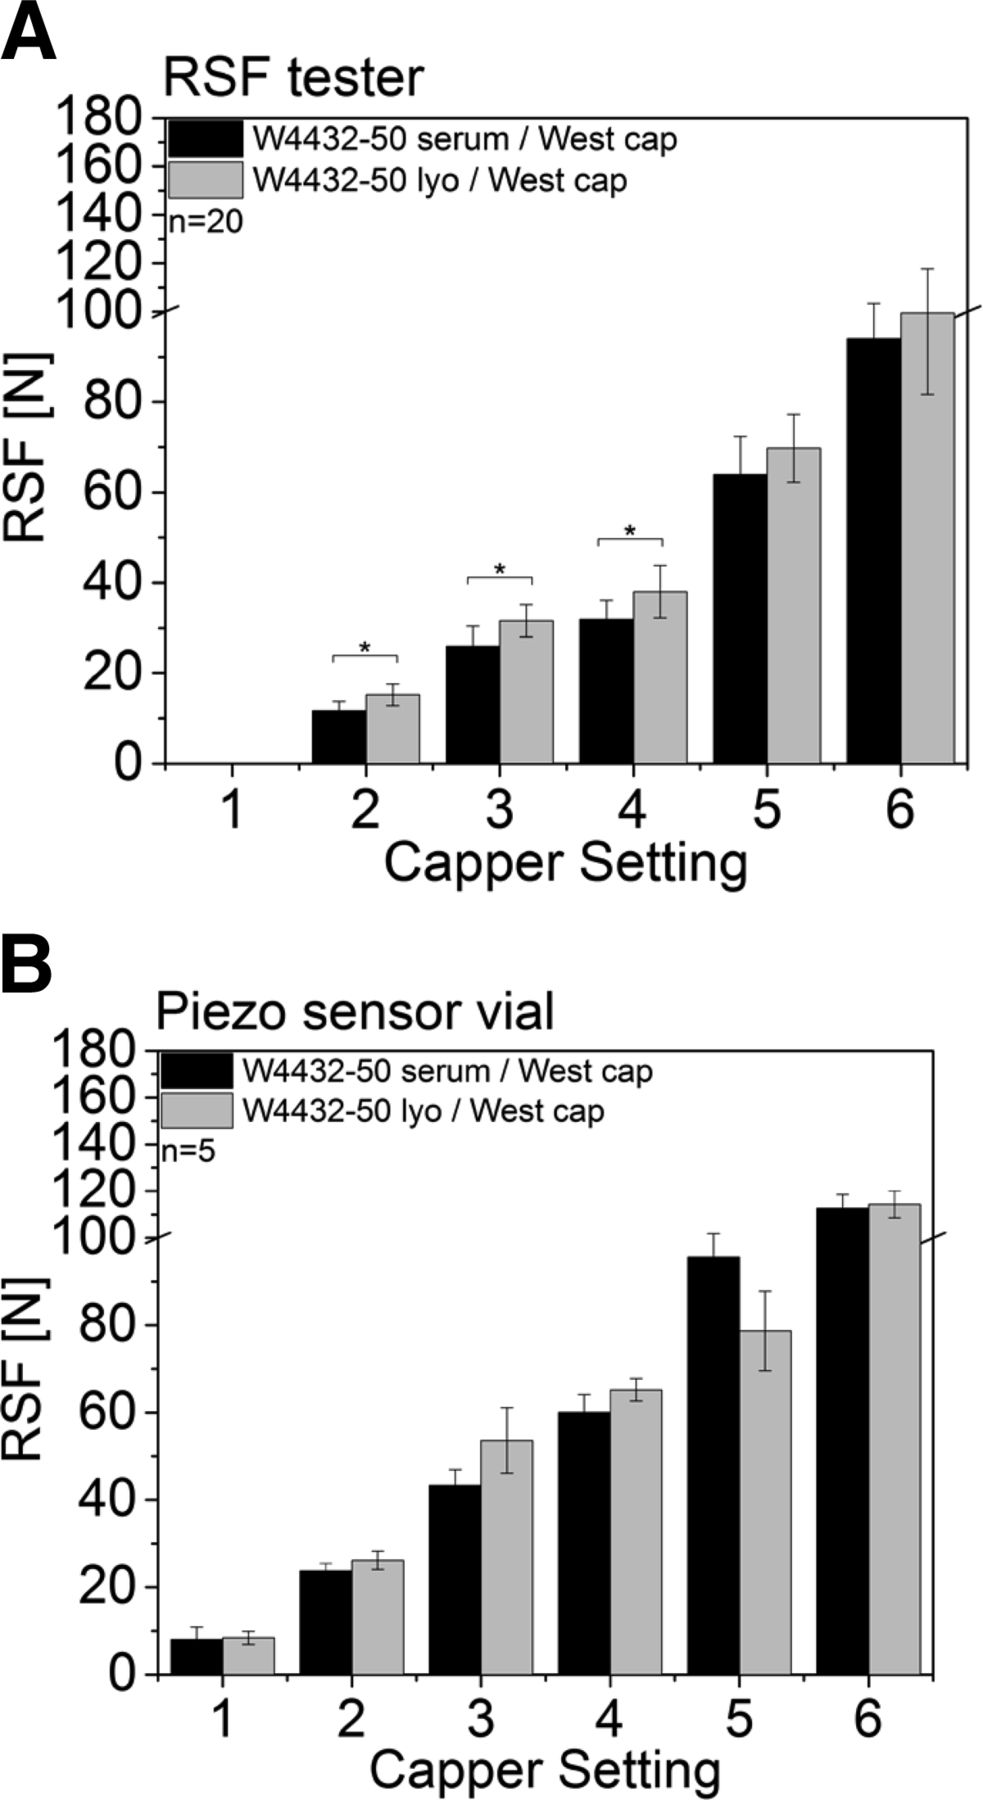
The 3 mL vials measured with the RSF tester (Figure 9A) showed the same trend than the 15 mL vials.

RSF values of 3 mL vials capped with a West crimp cap and a West 4432-50 serum or lyo rubber stopper. (A) Measurements performed with the RSF tester: black, West 4432-50 serum rubber stopper; grey, West 4432-50 lyo rubber stopper. (B) Measurements performed with the piezo sensor vial: black, West 4432-50 serum rubber stopper; greym West 4432-50 lyo rubber stopper.
The CCS with the W4432-50 lyo rubber stopper displayed higher RSF values throughout the study compared to the CCS with the W4432-50 serum rubber stopper. Again, the measured RSF values in absolute numbers were small. For example, at capping equipment setting 3 for the CCS with the W4432-50 lyo rubber stopper was 31.6 N ± 3.6 N whereas the RSF for the CCS with the W4432-50 serum was only 26.0 N ± 4.52 N (Figure 9A).
The measured force values obtained with the piezo force vial showed similar trends except for capping equipment setting 5, which showed higher values for the serum rubber stopper (Figure 9B).
In conclusion, lyo rubber stoppers displayed a minor increase in RSF values than serum rubber stoppers. This can be explained by two reasons. Firstly, the lyo rubber stopper geometry with the longer plug compared to the serum counterparts prevents dimpling into the vial neck (less relaxation of the rubber stopper possible compared to the serum rubber stoppers). Instead, the lyo rubber stopper bulks up upon capping with excessive high capping forces. Secondly, lyo rubber stoppers are also coated on the top with a rigid coating. The coating restricts a visco-elastic flow of the elastomer under stress and prevents rubber stopper relaxation as well. Similar results for coated rubber stoppers were observed by Morton and Lordi (13).
4. The Type of Crimp Cap Only Had a Minor Impact on RSF Measured with the RSF Tester of the CCS
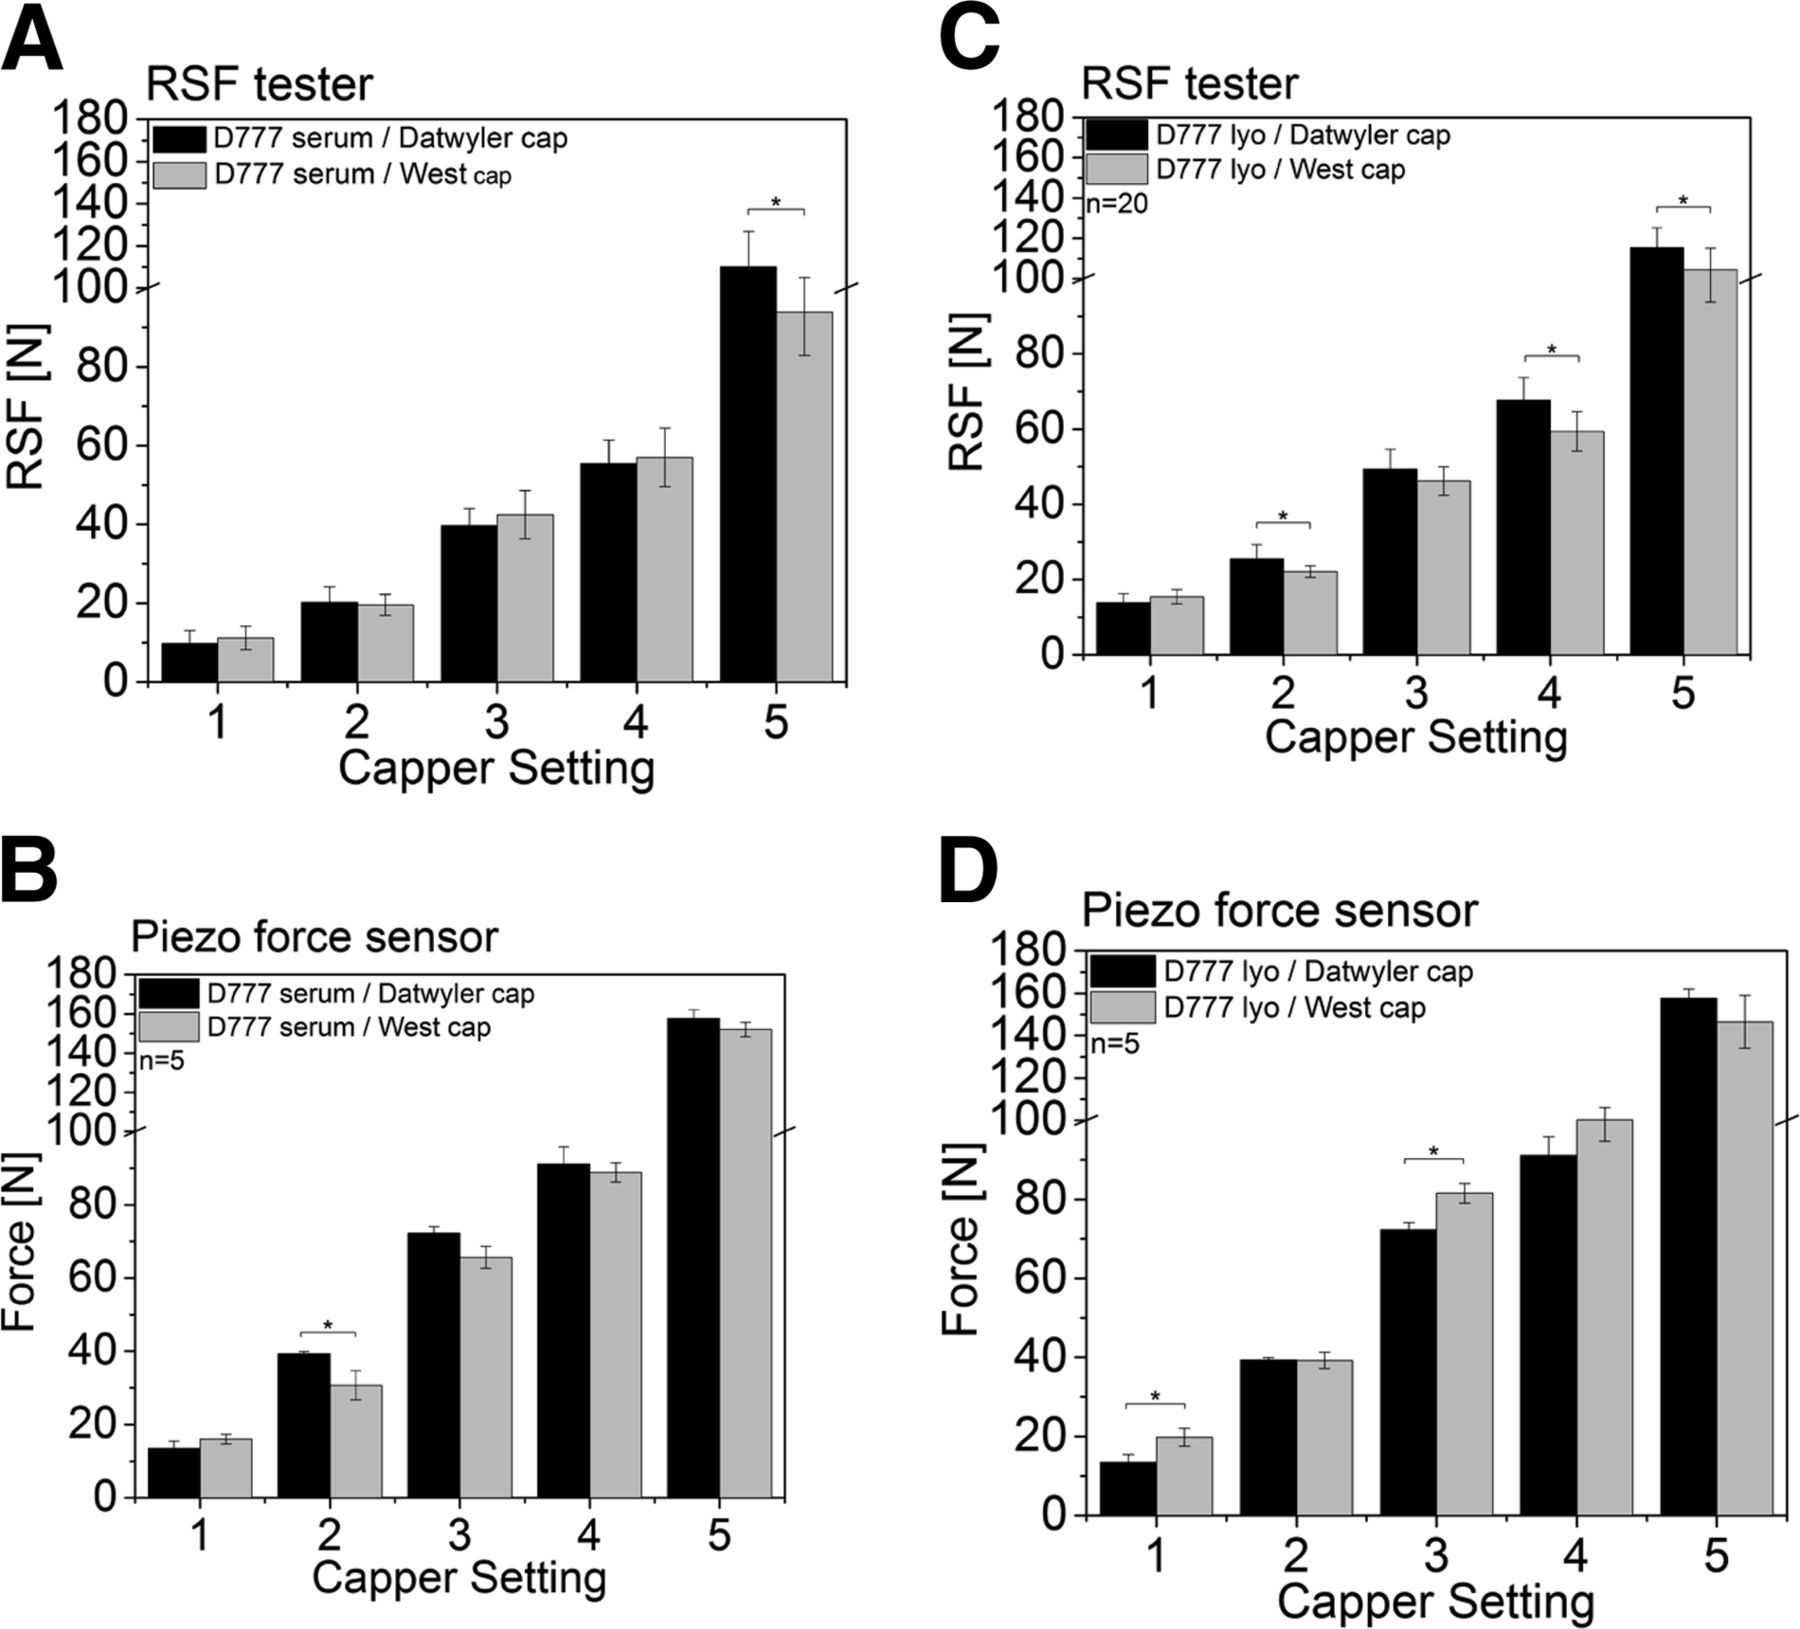
Finally, the influence of the crimp cap on RSF was investigated. Two different crimp caps were used: (1) a West crimp and (2) a Datwyler crimp cap. Fifteen milliliter vials with a Daikyo D777 serum or lyo rubber stopper were both capped with the Datwyler and West crimp caps, again using the five different capping settings.
As can be seen in Figure 10, no major difference in RSF values could be observed for the D777 serum stopper capped with the West or Datwyler crimp cap (Figure 10A). For example, at capping equipment setting 3 the D777 serum rubber stopper capped with the Datwyler crimp cap displayed a RSF value of 39.8 ± 4.3 N, and the D777 serum rubber stopper capped with the West crimp cap showed a RSF value of 42.5 ± 6.1 N. No major differences could also be found in RSF values for the D777 lyo rubber stopper capped with the West or Datwyler crimp cap (Figure 10C) at given capping equipment settings. At capping equipment setting 3, the RSF value for the D777 lyo rubber stopper capped with the Datwyler crimp cap was 49.4 ± 5.3 N, and for the D777 lyo rubber stopper capped with the West crimp cap it was 46.2 ± 3.8 N.

RSF values of 15 mL vials capped with a Datwyler or West crimp cap and D777 serum or lyo rubber stoppers. Datwyler (black), West (grey). (A) D777 serum rubber stopper with a Datwyler crimp cap (black), and a West crimp cap (grey) measured with the RSF tester. (B) D777 serum rubber stopper with a Datwyler crimp cap (black), and a West crimp cap (grey) measured with the piezo sensor vial. (C) D777 lyo rubber stopper with a Datwyler crimp cap (black) and a West crimp cap (grey) measured with the RSF tester. (D) D777 lyo rubber stopper with a Datwyler crimp cap (black) and a West crimp cap (grey) measured with the piezo sensor vial.
The measured force values obtained with the piezo sensor vial were again slightly higher and no clear trend could be observed comparing the Datyler and West crimp cap (Figure 10B,D).
5. The Presence or Absence of the Flip-off Button Significantly Influences RSF Results
5.a. 15 mL Vials:
The capped 15 mL vials were also measured using the RSF tester with and without a flip-off button.
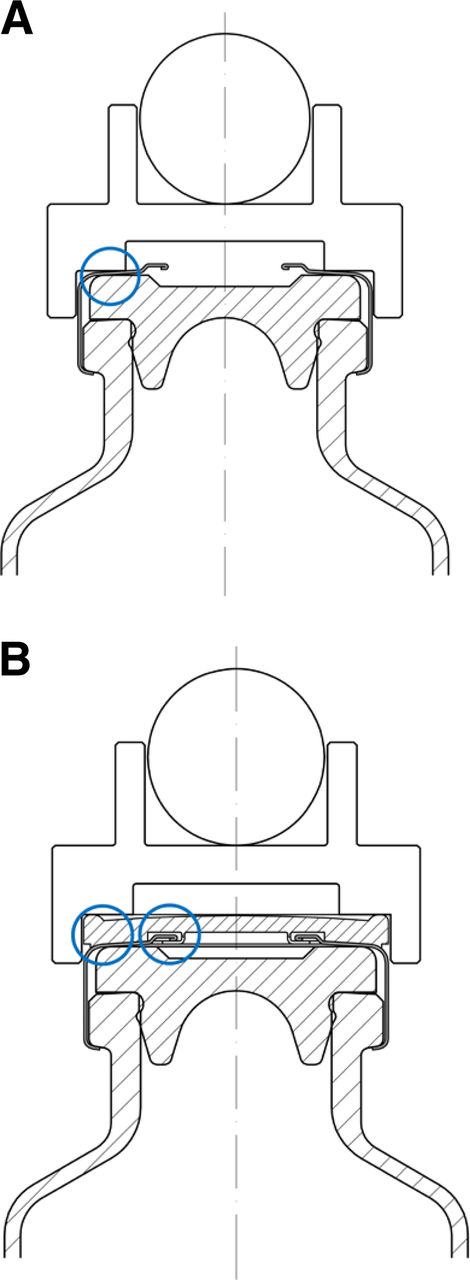
Before RSF measurements, the cap anvil is put on the CCS crimp cap, which acts like an adaptor to translate the applied force exalted by the RSF tester from above during the RSF measurement onto any given crimp cap design used in the measured CCS (Figure 12). Without a flip-off button the cap anvil touches the CCS at the outer rim of the aluminum part of the crimp cap. The applied force from above is directly translated to the rubber stopper around the sealing area (blue ring, Figure 12A).
In contrast, the cap anvil applies the force on the outer rim of the flip-off button when measuring with the flip-off button. The flip-off button is connected in the center to the aluminum part of the crimp cap (Figure 12B). The applied force is not only directly translated to the rubber stopper at the sealing area but also to the aluminum of the crimp cap (Figure 12B). Therefore, several events (compression of the rubber stopper, deformation of the crimp cap) can be identified when measuring with a flip-off button (Figure 11B) compared to measuring without a flip-off button (Figure 11A).

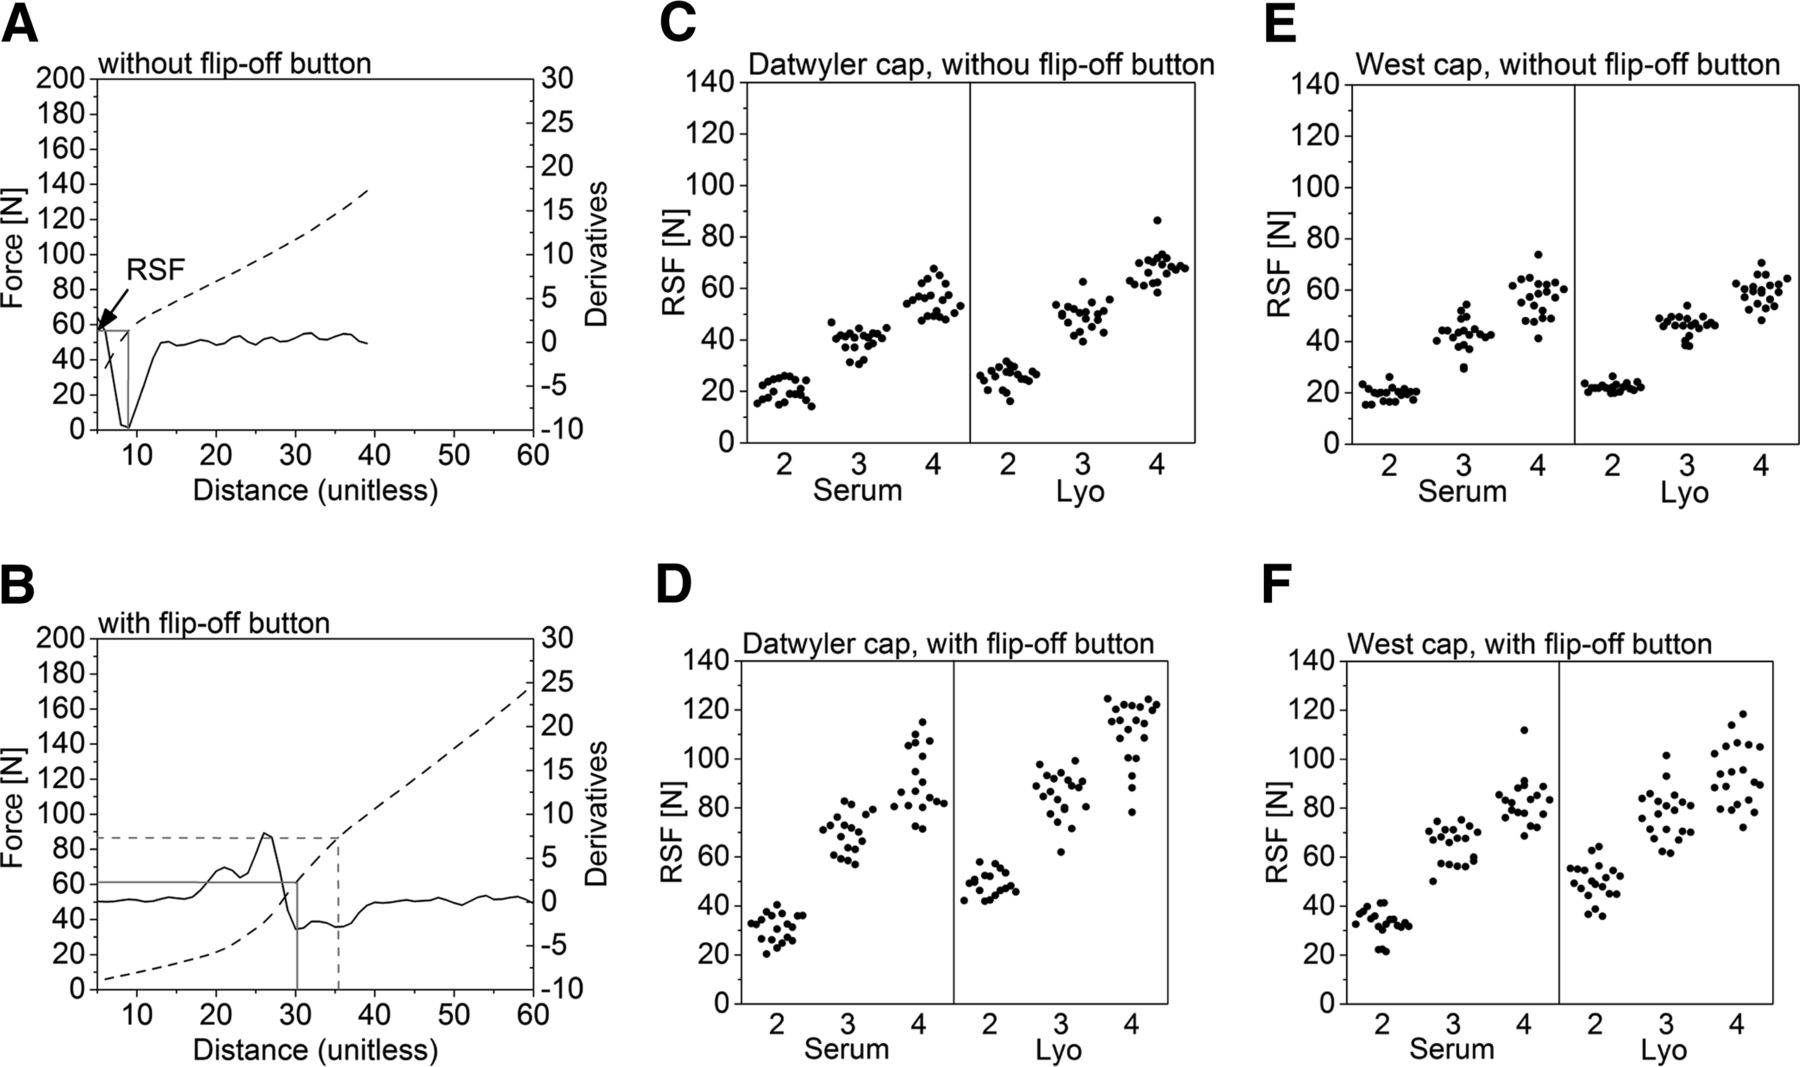
RSF results with and without flip-off buttons. Left column (A, C, E) without the flip-off button; right column (B, D, F) with a flip-off button. (A, B) RSF tester verbose plot: dotted black line force-distance curve, straight black line 2nd derivation of the force-distance plot (minimum is the point of RSF). (C, D) Vials capped with D777 serum or lyo rubber stopper, a Datwyler crimp cap, and capping equipment setting 2, 3, 4. (E, F) Vials capped with D777 serum or lyo rubber stopper, a West crimp cap, and capping equipment setting 2, 3, 4.

(A) capped vial measured without the flip-of button and (B) capped vial measured with the flip-off button and transfer of applied force.
Figure 11A shows a verbose plot of a RSF measurement without a flip-off button. One clear minimum of the calculated 2nd derivation can be identified (straight black line, Figure 11A), which is in accordance of the position of the bend (straight grey line, Figure 11A) of the measured stress strain curve (dotted black line, Figure 11A).
Figure 11B shows a verbose plot of a RSF measurement with a flip-off button. Several events can be identified including two minimums of the 2nd derivation (straight black line, Figure 11B). Not all verbose plots display two minimums of the 2nd derivations; however, the diagrams are in general less clean as the verbose plots from measurements without a flip-off button. In our study, the RSF tester sometimes picked the first and sometimes the second minimum when measuring with the flip-off button. Obviously, this has a major impact on the resulting RSF value—note the difference between straight grey line, RSF = 61 N, and dotted grey line, RSF = 87 N (Figure 11B).
The standard deviation of the RSF tester measurements without a flip-off button is smaller than with a flip-off button. The standard deviation for the RSF tester measurements in Figure 11C,E (without a flip-off button) range from 1.6 to 7.4 N, whereas the standard deviation from the RSF tester measurements in (Figure 11D,F) (with a flip-off button) range from 4.9 to 13 N.
In summary, the flip-off button adds complexity to the CCS and thus to the RSF measurements, which were more reliable without a flip-off button. The flip-off button prevents a clean transition of the force exalted by the RSF tester on the test vial. The force/distance plots often displayed two minima. Therefore, a high variability of the achieved RSF values could be observed. Therefore, measurements are recommended to be performed on the CCS with the flip-off button taken off. This suggests that RSF is a valuable tool to characterize the process (e.g., capping) and impact on CCS; however, limits its potential for use as an in-process control or quality control method due to its destructive nature and lack of method validation.
6. RSF Is an Adequate Method To Characterize Capping of CCS, and Piezo Force Sensor Measurements Correlate Well to RSF and Provide an Opportunity for Orthogonal Measurement
The RSF tester showed the clear capability to analyze the 15 mL vial featuring a larger vial head, rubber stopper, and crimp cap and the 3 mL vial featuring a smaller vial head, rubber stopper, and crimp cap. The obtained RSF values were a function of the capping pre-compression force and the capping plate-plunger distance (Figure 6). Reproducible measurements were possible in the range so far assessed, that is, between 15 and 110 N with a variety of different CCS configurations (different vial size, rubber stopper formulations and designs, and crimp caps). In conclusion, the RSF tester is an adequate method to monitor the capping process.
The different primary packaging components influence the RSF of a capped vial. The rubber stopper flange (Figures 6, 7), had a major impact on RSF, whereas the rubber stopper design (Figures 8, 9), the rubber stopper hardness (Figures 6, 7), and the crimp cap (Figure 10) showed only a minor impact on the measured RSF. Results obtained from the 3 mL vials and the 15 mL vials were comparable and displayed similar trends.
The piezo sensor vial was used as an orthogonal method to measure RSF. The piezo sensor vial measurements showed good correlation to the measurements performed with the RSF tester (Figures 6⇑⇑⇑⇑–11). The measured force values were a function of the capping pre-compression force and the capping plate-plunger distance (capping equipment setting 1 showed the lowest force values, whereas at capping equipment setting 6 the highest force values were measured). RSF values gathered with the piezo vial were overall slightly higher. However, similar trends compared to the RSF measurements regarding the different CCS configurations could be observed.
The only exception was that no good correlation between the RSF tester and the piezo sensor vial was observed with the 3 mL vial with the soft D777 serum rubber stopper (Figure 7B). The measured force stayed from capping equipment settings 4–6 on a plateau and did not further increase. The CT images (Figure 15D) revealed that the 3 mL D777 serum rubber stopper dimples into the vial neck upon high RSF values. The piezo vial is equipped only with the rubber stopper flange. Without the lower part of the soft D777 rubber stopper, dimpling effects are even stronger and the rubber stopper relaxes when facing high RSF values.
The piezo force sensor vial cannot be used on the actual vials and CCS, and the surrogate CCS is required. In addition, the piezo force sensor vial is connected to its test signal unit by a wire, clearly limiting its applicability in large-scale manufacturing capping equipment.
For commercial manufacturing the user-friendly and standardized RSF tester is the method of choice.
7. Rubber Stopper Compression Occurs as a Function of RSF and Can Be Measured by Vial Height Measurements or CT
The rubber stopper compression of a capped vial can be defined as the loss of the rubber stopper flange height in percent before and after the capping process.
7.a. Measurement of Stopper Compression by Vial Height:
The rubber stopper compression was calculated with the vial height before and after the capping process. Therefore, any deformation of the crimp cap during the capping process is a possible error source, as metal deformation of the crimp cap decreases total vial height, which is the basis of the rubber stopper compression calculation.
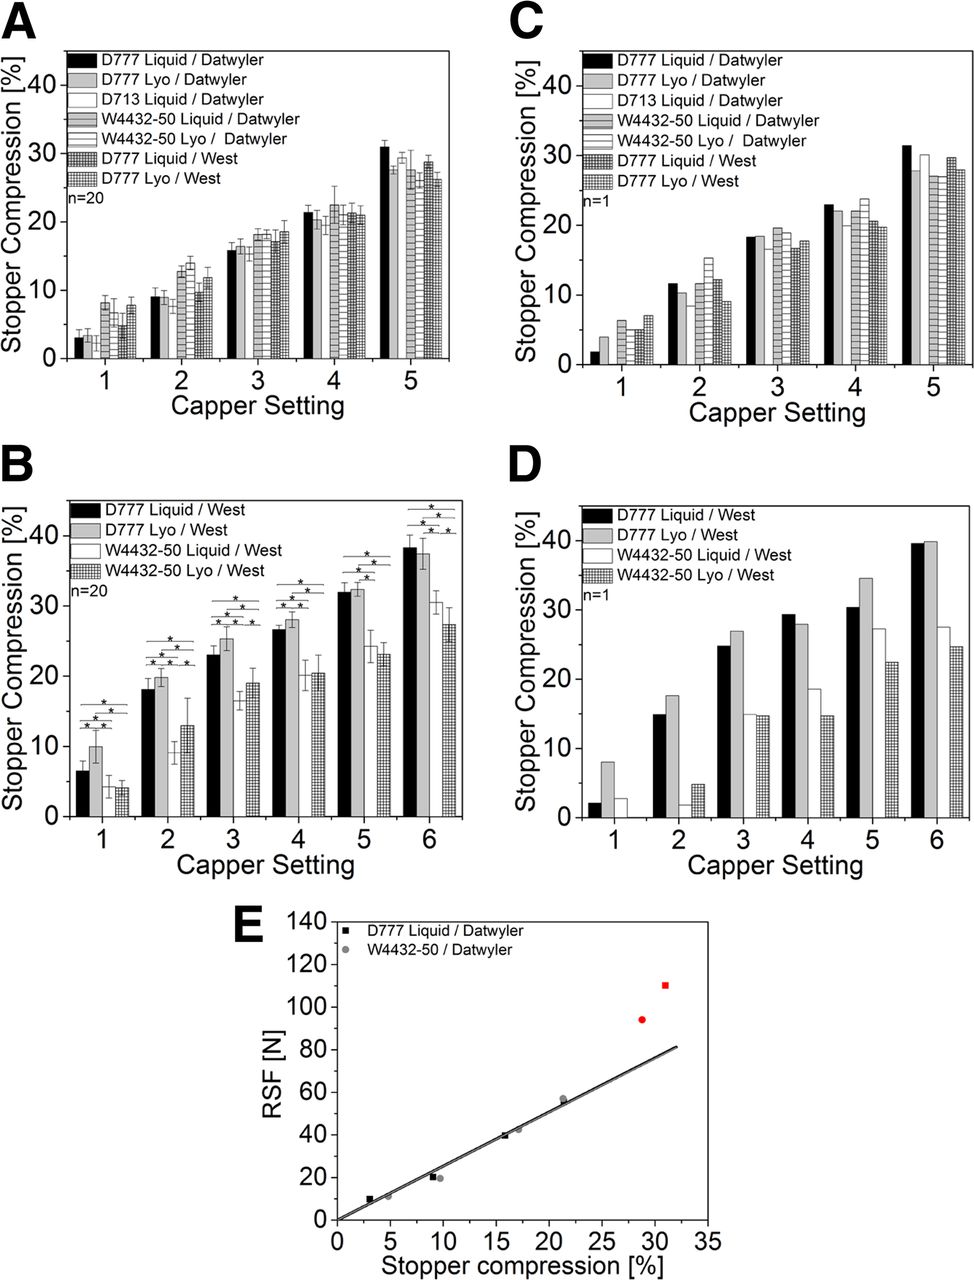
The rubber stopper compression was measured with the height measuring device built in-house. For the 15 mL vials the rubber stopper compression correlated with RSF, that is, consistently increasing rubber stopper compression from capping equipment setting 1 up to 5 (Figure 13A). Although some sample groups showed some statistically significant difference in rubber stopper compression, no major differences and trends could be observed for the different rubber stopper formulations and rubber stopper designs. Rubber stopper compression was found to be a function of RSF. Figure 13E shows an example of an RSF (N) versus rubber stopper compression (%) plot of two different rubber stoppers. RSF is proportional to rubber stopper compression up to 60 N. The two different rubber stoppers showed similar rubber stopper compression at the same RSF values independent of the rubber stopper flange height or Shore A hardness. At the highest capper settings the obtained RSF values did not fit the linear regression curve.

Rubber stopper compression obtained from vial height measurements (A, B) and CT measurements (C, D). (A, C) 15 mL vials: black, Daikyo D777 serum rubber stopper with Datwyler crimp cap; grey, Daikyo D777 lyo rubber stopper with Datwyler crimp cap; white, Daikyo D713 serum rubber stopper with a Datwyler crimp cap; grey horizontal lines, West 4432-50 serum rubber stopper with a Datwyler crimp cap; white horizontal lines, West 4432-50 lyo rubber stopper with a Datwyler crimp cap; grey grid, Daikyo D777 serum rubber stopper with a West crimp cap; white grid: Daikyo D777 lyo rubber stopper with a West crimp cap. (B, D) 3 mL vials (all West crimp caps); black, Daikyo D777 serum rubber stopper; grey, Daikyo D777 lyo rubber stopper; white, West 4432-50 serum rubber stopper; white grid, West 4432-50 lyo rubber stopper. The bracket and asterisk was left out of Figure 13A for comprehensibility reasons because no trend in rubber stopper compression could be observed. (E) 15 mL vials RSF (N) vs. Stopper compression (%): black, Daikyo D777 serum rubber stopper with Datwyler crimp cap; grey, West 4432-50 serum rubber stopper with a Datwyler crimp cap.
Similarly, the 3 mL vials showed a consistent increase in rubber stopper compression from capping equipment settings 1 to 6. The D777 serum and lyo rubber stopper, which feature a higher rubber stopper flange and a softer elastomer formulation compared to the W4432-50 rubber stoppers (Table II), showed a major increase in rubber stopper compression (Figure 13B, black and grey bars versus white and white-grid bar). For example, at capping equipment setting 3 the D777 serum rubber stopper displayed a rubber stopper compression of 23.0 ± 1.2% (Figure 13B) whereas the corresponding W4432-50 serum rubber stopper displayed only a rubber stopper compression of 16.5 ± 1.3% (Figure 13B).
7.b. Measurement of Stopper Compression by CT:
It was also possible to directly analyze the rubber stopper flange height before and after the capping process with CT measurements (Figure 13C,D).
Overall comparable rubber stopper compression results were obtained using the CT or the vial height method. The 15 mL vials showed increased rubber stopper compression from capping equipment settings 1 to 5. However, no clear trend between the different sample groups could be observed.
The 3 mL vials showed increased rubber stopper compression from capping equipment settings 1 to 6. Again, the Daikyo rubber stopper showed higher rubber stopper compressions than the corresponding West 4432-50 rubber stoppers. For example, at capping equipment setting 3 the D777 serum rubber stopper displayed a rubber stopper compression of 24.8% (23.0% ± 1.2% was measured with vial height measurements) (Figure 13D) whereas the corresponding W4432-50 serum rubber stopper displayed only a rubber stopper compression of 14.9% (16.5 ± 1.3% was measured with vial height measurements) (Figure 13D).
In conclusion, the rubber stopper compression is a function of RSF (Figure 13E). The rubber stopper compression from vial height measurements and CT showed similar trends and values. Similar results were observed by Morton and Lordi (12–13, 18). For the 3 mL vials, the rubber stoppers with a low Shore A hardness and a high flange showed the highest rubber stopper compression. This can be explained by the fixed capping plate-plunger distance of the capping equipment, which will compress any rubber stopper to a specific distance. No clear trend could be observed for the 15 mL vials because the rubber stoppers with the highest flange height also featured the hardest elastomer formulations. These two parameters influence rubber stopper compression in opposite directions.
Rubber stopper compression is an important design parameter of the capping process. The length of the cap skirt folded under the vial flange can be controlled by defining a specific RSF range. Rubber stopper compression and the connected cap skirt length folded under the vial flange are two important parameters to prevent cosmetic defects during commercial manufacturing but also for partially crimped vials. Too long cap skirts (high rubber stopper compression) wrinkle under the vial flange or induce scratches on the vial neck. In contrast, too short cap skirts (low rubber stopper compression) impede a clean folding of the cap skirt under the vial flange, which can cause leakage and CCI failure. In addition, the complete cap could fall off when the flip-off button is removed when a vial is only partially capped.
The rubber stopper compression measured by CT and vial height show several challenges. For the vial height measurements, each CCS needs to be measured before the capping process to eliminate the CCS dimensional variation. The CT measurements are time-intensive and require complex 3D image reconstruction. Those challenges limit the applicability of the two methods for routine use.
8. Visual/Manual Inspection and CT Measurements Were Valuable To Characterize CCS after Capping. Stopper Deformations Were Only Observed for One CCS; However, It Did Not Show Any Change in CCI
In our study the flip-off button was removed to visually inspect the rubber stopper after the capping process. Obviously, a destructive visual inspection (removal of the flip-off button) is not applicable with commercial products. Only 3 mL vials with the soft D777 rubber stopper capped with capping equipment setting 6 showed some rubber stopper deformation in the center of the vial. The Daikyo D777 serum rubber stopper showed dimpling into the vial neck (Figure 14E) whereas the top surface–coated Daikyo D777 lyo rubber stopper wrinkled during the capping process (Figure 14F). All other 3 mL and 15 mL capped vials displayed no visual defects.
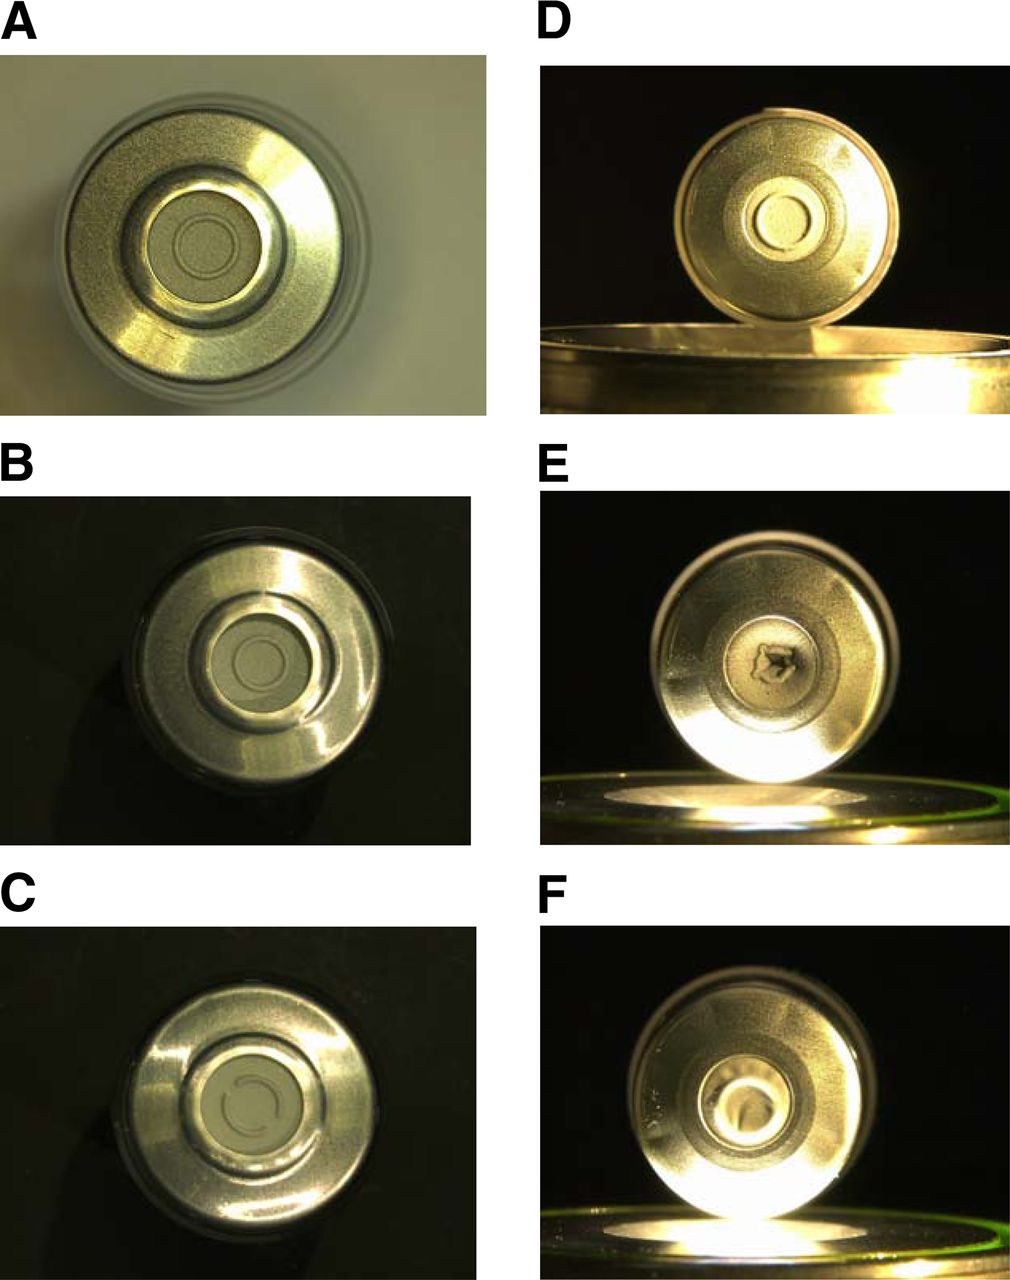
(A) 15 mL vial capped with a Daikyo D777 serum rubber stopper and capping equipment setting 4 (RSF: 55.5 ± 5.9 N). (B) 15 mL vial capped with a Daikyo D777 serum rubber stopper and capping equipment setting 5 (RSF: 110.2 ±16.7 N). (C) 15 mL vial capped with a Daikyo D777 lyo rubber stopper and capping equipment setting 5 (RSF: 115.3 ± 9.8 N). (D) 3 mL vial capped with a Daikyo D777 serum rubber stopper and capping equipment setting 4 (RSF: 50.9 ± 7.1 N). (E) 3 mL vial capped with a Daikyo D777 serum rubber stopper and capping equipment setting 6 (RSF: 101.9 ± 11.8 N). (F) 3 mL vial capped with a Daikyo D777 lyo rubber stopper and capping equipment setting 6 (RSF: 117.4 ± 13.9 N).
In addition to rubber deformation, the possibility to remove the flip-off button without removing the complete crimp cap was manually checked. The flip-off button of the 3 mL vials capped with capping equipment setting 1 could not be removed without removing the complete crimp cap. All other formats passed the test.
In addition to visual inspection, vials were analyzed by CT. Again, only the 3 mL vials with the soft D777 rubber stopper capped with capping equipment setting 6 showed rubber stopper deformation in the center of the vial (Figure 15D).
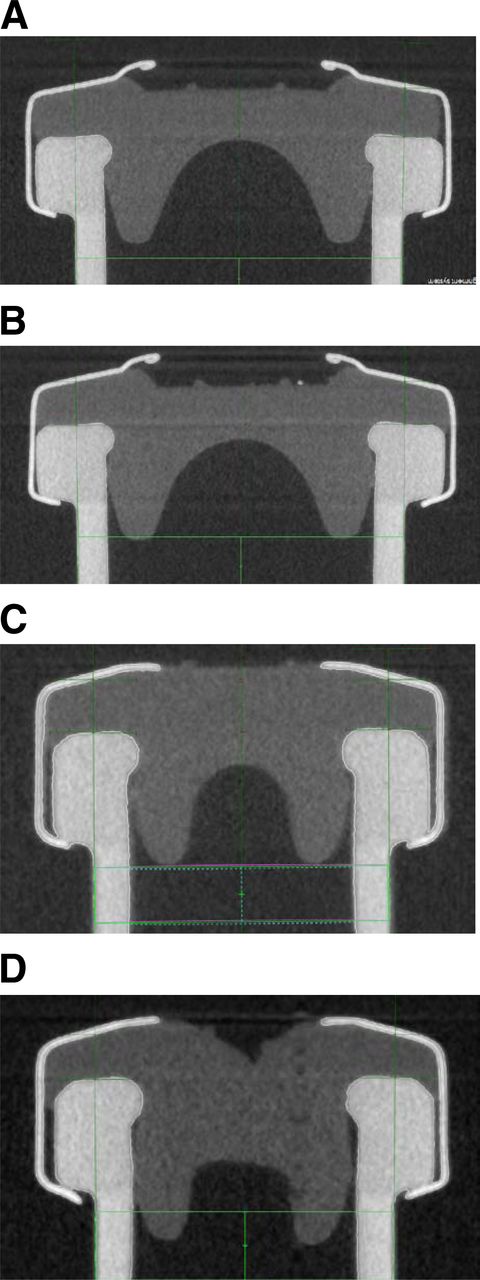
CT images of (A) 15 mL vial capped with a D777 serum rubber stopper and capping equipment setting 4 (RSF: 55.5 ± 5.9 N). (B) 15 mL vial capped with a D777 serum rubber stopper and capping equipment setting 5 (RSF: 110.2 16.7 N). (C) 3 mL vial capped with a D777 serum rubber stopper and capping equipment setting 4 (RSF: 50.9 ± 7.1 N). (D) 3 mL vial capped with a D777 serum rubber stopper and capping equipment setting 6 (RSF: 101.9 ± 11.8 N).
In conclusion, the rubber stopper compression can be analyzed by vial height measurements and CT. Rubber stopper compression is a function of RSF. All sample groups show no visual defects through a broad RSF range, with an exception of the soft D777 serum rubber stopper with the high RSF of 101.9 ± 11.8 N.
9. CCSs from All Selected Capping Settings Did Fulfill pCCI (Helium Leakage) Acceptance Criteria
Samples from all CCS combinations (20 vials and different stoppers (D777, D713, W4432-50 in serum or lyo format) and all tested capping equipment settings were also assessed by pCCI helium leakage. In contrast to mCCI testing, helium leak testing not only proves microorganism tightness but also provides information about gas tightness. The ability of a CCS to maintain a specific gas headspace can be important for drug product stability. For example, in the case of therapeutic proteins a nitrogen headspace minimizes oxidative stress. However, any pCCI method in combination with the applied artificial leaks needs to be validated and show correlation to mCCI testing (Figure 5). In other words, the pCCI test needs to prove the ability to detect microbial ingress. All tested vials displayed a helium leak rate below 10–7 mbar L/s (Tables IV and V). This is below the level of possible microbiological ingress (Figure 5), and thus, in summary, none of the capped vials (including the 3 mL vials with rubber stopper deformation, Figure 15D) showed any leakage.
Average Helium Leak Values of 20 Measured 15 mL Vials (mbar L/s)
Average Helium Leak Values of 20 Measured 3 mL Vials (mbar L/s)
The risk of CCI failure is dependent on the primary packaging configuration (18). Other CCS configurations like hard rubber stoppers or less smooth vial sealing surfaces might require a certain level of RSF to ensure CCI.
10. An Adequate RSF Range for a Specific CCS Can Be Defined
The development of an adequate RSF range for a specific CCS configuration is dependent on several factors and tests. As an example, the definition of the adequate RSF range for the 3 mL vial capped with a Daikyo D777 serum rubber stopper and a West crimp cap is demonstrated in the following:
The vials were capped with six capping equipment settings to cover a broad RSF range (from capping equipment setting 1, which was even below the detection limit of the RSF tester, up to capping equipment setting 6, 101.9 N). Then the vials were investigated with several analytical techniques and tests: a visual/manual inspection for lose crimp caps, CT and visual inspection for dimpling rubber stopper and too long/short cap skirts, and helium leakage. Vials capped with capping equipment setting 1 had loose crimp caps, whereas vials capped with capping equipment setting 6 showed dimpling rubber stoppers. No vials were tested positive for helium leakage. Accordingly, capping equipment settings 2–5 (RSF values from 16.3 to 76.5 N) achieved acceptable capping results.
The adequate RSF range could be further increased by capping vials with an additional capping equipment setting between 5 and 6 with RSF values of approximately 90 N. Those vials might show no rubber stopper dimpling and would thus be acceptable.
Conclusion
The vial capping process is a complex interplay of several process parameters and the CCS configuration. The capping force alone applied by the capping equipment provides insufficient information about the actual capping process and the resulting RSF. The capping plate-to-plunger distance has a major influence on the resulting RSF. The piezo sensor vial yielded comparable data. The RSF tester can analyze a variety of different CCSs independent of the capping equipment. An adequate and safe RSF range for each CSS configuration can be established with the RSF tester and additional methods like CT scans and leak testing. In the RSF range studied, the pCCI of the CCS was warranted.
Future studies need to be performed with drug product units from different good manufacturing practice (GMP) manufacturing facilities.
Conflict of Interest Declaration
The authors declare that they have no competing interests.
- © PDA, Inc. 2016
References


Jump to section
Related Articles
Cited By...
- Container Closure Integrity of Vial Primary Packaging Systems under Frozen Storage Conditions: A Case Study
- A Multicompany Survey Study for Helium Leak Container Closure Integrity Test
- Determining Maximum Allowable Rubber Stopper Displacement for Container Closure Integrity (CCI)
- A Vial Container Closure System Performance Optimization Case Study Using Comprehensive Dimensional Stack-Up Analyses
- Quantifying the Vial-Capping Process: Reexamination Using Micro-Computed Tomography
- Long-Term Study of Container Closure Integrity of Rubber-Glass Vial Systems by Multiple Methods
- Balancing Container Closure Integrity and Aesthetics for a Robust Aseptic or Sterile Vial Packaging System
- Comparing Physical Container Closure Integrity Test Methods and Artificial Leak Methodologies
- Residual Seal Force Testing: A Suitable Method for Seal Quality Determination of (High Potent) Parenterals
- Evaluation of Container Closure System Integrity for Storage of Frozen Drug Products: Impact of Capping Force and Transportation
- Sealing Behaviour of Container Closure Systems under Frozen Storage Conditions: Nonlinear Finite Element Simulation of Serum Rubber Stoppers
- Holistic Considerations in Optimizing a Sterile Product Package to Ensure Container Closure Integrity
- Artificial Leaks in Container Closure Integrity Testing: Nonlinear Finite Element Simulation of Aperture Size Originated by a Copper Wire Sandwiched between the Stopper and the Glass Vial