
Abstract
The European Pharmacopeia surface test to analyze the hydrolytic resistance is a common industrial method to understand and ensure the quality of produced glass vials. Hydrolytic resistance is evaluated by calculating the alkalinity of water extract from autoclaved vials by titration. As an alternative to this titration technique, a conductivity technique was assessed, which directly measures the ions in the water extract. A conductivity meter with a 12 mm diameter electrode was calibrated with a 100 μS/cm conductivity standard and carryover minimized by rinsing the probe in a water beaker per analysis. The limit of quantification at 1 μS/cm was determined as having a signal-to-noise ratio of 3 compared with the water blank. The conductivity method was selective for glass-composing elements (boron, sodium, aluminum, silicon, potassium, and calcium) within the vial extract. Accuracies of spiked conductivity standard within the range of 1 to 100 μS/cm were ±7% and had linearity with coefficient of determination (R2) of ≥0.9999. Intraday precision had a relative standard deviation (RSD) (n = 5) of ≤6% for spiked conductivity standard within the range of 1 to 100 μS/cm. Interday precision had a RSD (n = 4) of ≤6% for 10 vials from three glass vial lots. Conductivity of water extracts from nine sets of seven lots of glass vials had a precise linear relationship [R2 = 0.9876, RSD = 1% (n = 9)] with titration volumes of the same lots. Conductivity results in μS/cm could be converted to titration volumes in milliliters by a conversion factor of 0.0275. The simplicity, sample stability, and individual vial analysis of the conductivity technique were more advantageous than the current titration technique.
LAY ABSTRACT: The quality of glass vials used as primary containers in the pharmaceutical industry is of concern due to recent observations of glass flake-like delamination, or lamellae, under specific storage conditions. The current European Pharmacopoeia method to assess glass vial quality utilizes acid titration of vial extract pools to determine hydrolytic resistance or alkalinity. As an alternative to the European Pharmacopoeia method, the vial extracts were analyzed for conductivity, which directly determines the level of ions that were readily extracted from the vial surfaces. Lower quality glass would have greater surface defects that lead to higher ions extracted and higher conductivity value. The conductivity method was found to be suitable to measure the ions in water extracts and showed strong correlation with alkalinity. The advantage of the conductivity method over the alkalinity method was greater ease, lower volume requirements, stability, and flexibility in analysis.
I. Introduction
Glass vials are common primary containers used in the pharmaceutical industry. The glass vials for parenteral use are usually Type I composed of borosilicate glass. Borosilicate glass has high hydrolytic resistance (1), which makes its suitable as a container for various aqueous drug products.
A familiar issue with commercially available borosilicate glass vials is the erosion of the hydrolytic resistance (2), which can lead to excess leaching of glass composing elements into the filled solution and/or lead to glass particle cracking off the glass surface, or delamination. The actual severity of the degradation of the glass is affected by the strength of hydrolytic resistance determined during the manufacturing processes (2⇓⇓⇓–6), terminal sterilization prior to filling (2, 7), composition of the filled solution (8⇓–10), time of solution contact, and storage conditions (5, 11). Severe degrees of delamination have led to product recall (12). As there are numerous factors post-manufacturing that can lower hydrolytic resistance, it is critical to understand and identify glass vials that have strong initial resistance to minimize the risks.
The current industry method to test the strength of the hydrolytic resistance of glass vials is the surface test defined by the European Pharmacopeia (Ph. Eur.) (13) and similarly by the U.S. Pharmacopeia (USP) (14). Glass vials are extracted with water by autoclave for 1 h at 121 °C, and that extract solution is tested for alkalinity via acid titration. Higher alkalinity equates to higher levels of sodium and all other glass-composing species extracted from the glass internal surface. Glass surfaces with elevated sodium have less hydrolytic resistance and thus has higher propensity for degradation. This method allows for simple prediction and assessment of possible future delamination difficulties in usage of those glass vials.
As an alternative to the titration method for measuring the alkalinity, a conductivity method was evaluated. A conductivity meter was used to directly measure the total conductivity of the water extract, which is proportional to the total types and levels of charged species in the solution such as sodium ions. The observed conductivity correlated linearly with titration volumes of the same vial lots. Conductivity values were able to be simply converted to titration volumes, then to alkalinity values. Measuring conductivity was simpler, faster, and easier to perform than titration by the Ph. Eur. Method, with less volume requirements in the sample volume to observe possible outliers within lots, and longer sample stability.
II. Materials and Methods
Materials
Seven lots of 3 cc Type I borosilicate glass vials, which were cleaned and processed, were obtained from two suppliers. Purified water of 18.2 MΩ·cm at 25 °C from a Milli-Q laboratory water purification system from Millipore (Billerica, MA, USA) was used. Methyl red disodium salt was from Alfa Aesar (Ward Hill, MA, USA). The 100 μS/cm conductivity standard, electrode conditioning solution, and 1.00 N hydrochloric acid was from VWR (Radnor, PA, USA). Aluminum (Al) elemental standard solutions were from Sigma-Aldrich (St. Louis, MO, USA). Silicon (Si) elemental standard was from Inorganic Ventures (Christiansburg, VA, USA). Boron (B), calcium (Ca), and cadmium (Cd) elemental standards were from Ricca Chemicals (Arlington, TX, USA). Sodium (Na) and potassium (K) was from Fluka (St. Louis, MO, USA). Nitric acid, Optima grade, 67∼70% was obtained from Fisher Scientific (Waltham, MA, USA).
Vial Water Extraction
Standard Ph. Eur. method was followed to prepare vial water extract. Vials were rinsed with water four times, filled to 90% brimful capacity (2.7 mL), and autoclaved at 121 °C for 1 h. In total, seven lots from two suppliers were extracted. For conductivity analysis, individual vial extract was transferred into separate 16 mL polystyrene round bottom tube (BD Falcon, San Jose, CA, USA) for storage at room temperature. For titration analysis, 11 vial extracts from each lot were pooled into separate 50 mL polypropylene centrifuge tubes (Corning, Tewksbury, MA, USA) within 1 h of autoclaving and the volume adjusted to 25 mL. The excess volume from pooling was also used for conductivity analysis.
Titration/Alkalinity Analysis
Indicator solution was prepared by dissolving 25 mg of methyl red disodium salt into 100 mL purified water. The disodium salt type of methyl red was used against using the pure methyl red as indicated in Ph. Eur. Reagents 4.1.1., due to ease of solubility in water. Twenty-five milliliters of the pooled vial extract were added to a 50 mL glass beaker with stirring bar, and then two drops (0.05 mL) of the indicator were added. Then 0.01 M HCl was added to the pools under constant stirring until an apparent color change to red was observed, and the total added volume was recorded. As control, purified water was titrated instead of vial extract, and this control result was subtracted from the vial results. The final volume of HCl added may be converted to alkalinity values as percentage of HCl added in comparison to the limit volume of 5.2 mL.
Conductivity Analysis
A conductivity meter with a 12 mm diameter electrode was obtained from VWR. The electrode was conditioned in the conditioning solution at least 5 h before each usage. Prior to each measurement, the electrode was rinsed with purified water in a ≥150 mL water beaker for ≥5 s, then any residual water was shaken off. The baseline for purified water was observed with a conductivity of <1.00 μS/cm. For calibration, the electrode was placed in the 100 μS/cm conductivity standard and the meter calibrated according to its operation manual. The standard was analyzed after every 20 samples, and the meter was recalibrated if the value was different by ±10% of the expected value. As control, purified water was measured as vial extract and the control result was subtracted from the vial results.
Limit of Quantification (LOQ)
The LOQ was evaluated using conductivity standard at 1 μS/cm in comparison to purified water.
Selectivity
Selectivity of the conductivity meter to analyze total levels of charged species such as sodium ions was evaluated by measuring the same extract samples with both the conductivity meter and by inductively coupled plasma mass spectrometry (ICP/MS) for glass-composing elements boron, sodium, aluminum, silicon, potassium, and calcium. After plotting the conductivity value versus total glass elements concentration, a linear relationship would show selectivity of the conductivity meter to quantify vial extract ions. Three vials per lot were evaluated.
For ICP/MS analysis, a PerkinElmer/SCIEX Elan DRC II ICP/MS (Waltham, MA, USA) equipped with an autosampler was optimized following the standard procedures recommended by the vendor. Masses were selectively monitored at 11 m/z (boron), 23 m/z (sodium), 27 m/z (aluminum), 28 m/z (silicon), 39 m/z (potassium), 42 m/z (calcium), and 112 m/z (cadmium) with a dwell time of 50 ms. Standards containing 1, 5, 20, 100, 250, and 1000 μg/L Na/Al/K; 5, 20, 100, 250, and 1000 μg/L B/Ca; and 25, 100, 500, 1250, and 5000 μg/L Si in 0.5% nitric acid and spiked to contain 50 μg/L cadmium internal standard were used to determine a linear calibration curve. The blank response was subtracted from the standards in determining the curve and in sample analysis. For ICP/MS analysis, 300 μL of the vial extract was further diluted 10-fold to total volume of 3000 μL with 0.5% nitric acid and spiked to contain 50 μg/L cadmium. After each analysis, a 0.5% nitric acid solution was used to wash the system for 270 s.
Accuracy
The accuracy of the conductivity quantification was evaluated by analyzing purified water spiked to contain 0, 1, 5, 10, 25, or 100 μS/cm of the conductivity standard. Comparison of the observed conductivity to the theoretical would demonstrate accuracy.
Precision
The intraday precision of conductivity was evaluated by measuring the purified water spiked to contain 0, 1, 5, 10, 25, or 100 μS/cm of conductivity standard, five times each. For interday precision, 10 extracts from three lots of vials were measured for conductivity on days 0, 1, 5, and 7. The vial samples for this interday precision were unwashed prior to extraction. The water extracts were stored in a closed plastic tube at room temperature during the interday analyses. Observation of precision relative standard deviation (RSD) of less than < 15% would demonstrate precision.
Linearity
The linearity of conductivity was evaluated by analyzing the slope, intercept, and coefficient of determination (R2) of the calibration curve obtaining by running standards prepared by spiking purified water to 0, 1, 5, 10, 25, 50, or 100 μS/cm with the conductivity standard. A coefficient of determination (R2) value >0.9 would demonstrate linear relationship.
Carryover
Carryover was evaluated by measuring the purified water after the electrode was rinsed in a ≥150 mL water beaker for ≥5 s. Rinse water was exchanged with fresh purified water after three measurements. A baseline of <1.00 μS/cm after rinsing would exhibit negligible carryover.
Stability
The stability of vial water extract was demonstrated simultaneously with the interday precision analysis.
Conductivity vs Titration
The relationship between titration and conductivity techniques were determined by titrating and measuring the conductivity of autoclaved vial water extracts from the same lot. In total, nine sets of seven vial lots were evaluated. Observed titration volumes and conductivity were plotted, and a coefficient of determination (R2) value of >0.9 would demonstrate a linear relationship.
III. Results and Discussion
LOQ
The LOQ was evaluated by measuring purified water blank and conductivity standard at 1 μS/cm. The 1 μS/cm conductivity standard had a signal response 3 times greater than those observed from the blank, with a precision RSD of 2% (n = 6). The quantification limit at 1 μS/cm was acceptable (15).
Selectivity
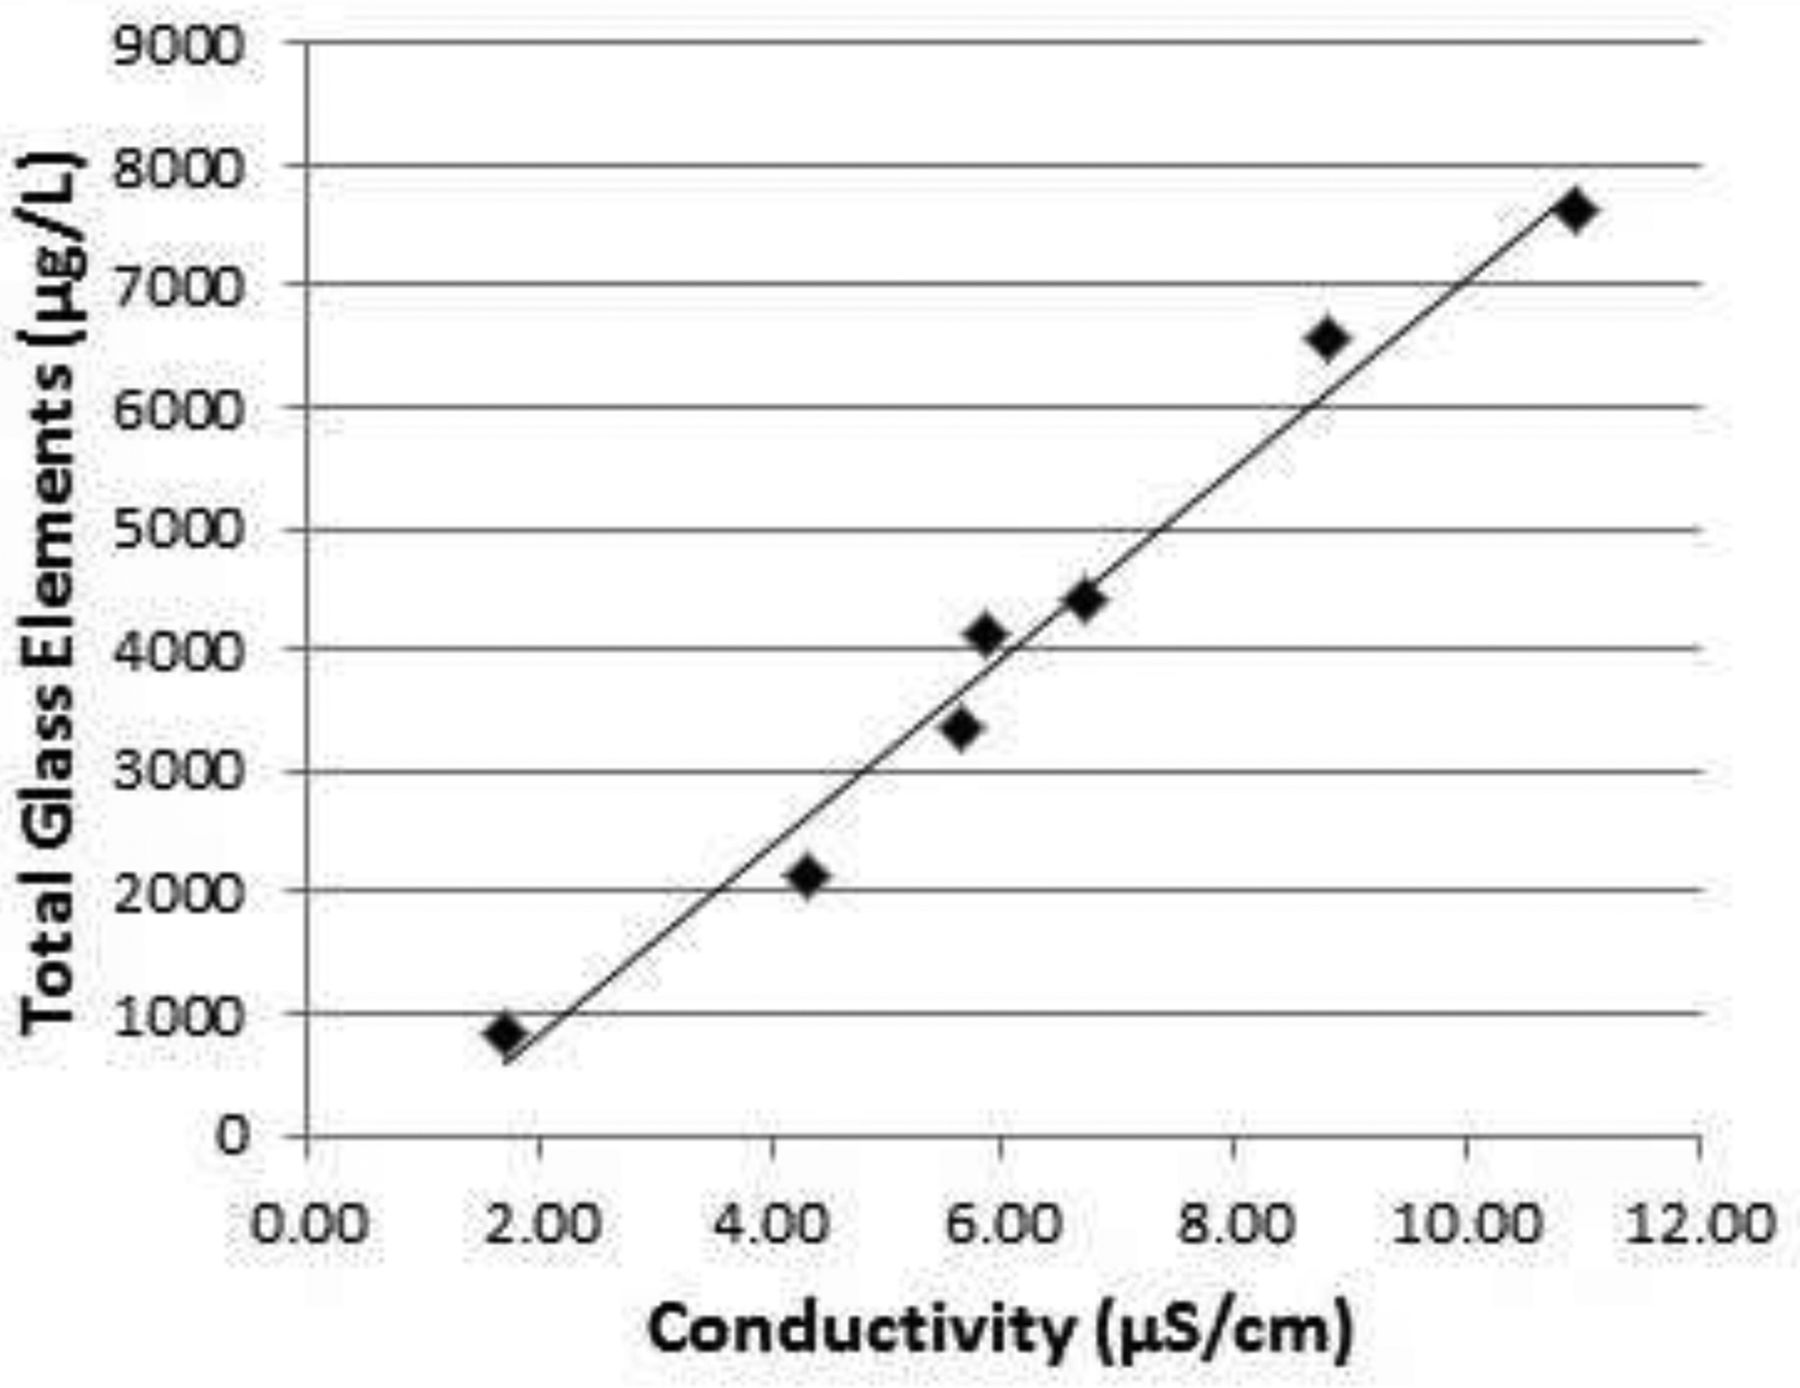
The selectivity of the conductivity meter for measuring total charged species was evaluated by measuring the same water extracts of seven vial lots for conductivity and for total glass elements by ICP/MS. The seven lots had conductivity ranging from 1.70 to 10.95 μS/cm and total glass elements concentration from 837 to 7615 μg/L (Table I). A linear relationship between conductivity and total glass elements was observed (R2 = 0.9792) (Figure 1). The conductivity meter was selective in measuring charged species composed of glass elements in the vial water extracts and was acceptable (15).
Conductivity (μS/cm) and Total Glass Elements (μg/L) in Water Extracts of 3 cc Glass Vials (n = 3/vial lot)

Correlation between conductivity and total inorganic glass elements measured by ICP/MS of water extracts of seven lots of 3 cc glass vials. Regression line: y = 780.55x – 753.76, R2 = 0.9792.
Accuracy
Conductivity in purified water spiked to 0, 1, 5, 10, 25, or 100 μS/cm with the conductivity standard was determined. The accuracies of conductivity in all samples ranged from 93% to 102% of the expected results (Table II). The method accuracy for conductivity was acceptable (15).
Accuracy (%) of Conductivity Measurements
Precision
Intraday precision was evaluated by measuring purified water spiked to 0, 1, 5, 10, 25, or 100 μS/cm with the conductivity standard five times each. Precision RSD (n = 5) of all conductivity concentrations were ≤6% (Table III). The method's intraday precision for conductivity was acceptable (15).
Intraday Precision RSD (%) of Conductivity Measurements
Interday precision was evaluated by measuring 10 individual vial water extracts from three lots on days 0, 1, 5, and 7. Precision RSD (n = 4) of all 30 samples was ≤6% (Table IV). The method's interday precision for conductivity was acceptable (15).
Interday Precision RSD (%) of Conductivity Measurements
Linearity
Linearity of conductivity of purified water spiked to 0, 1, 5, 10, 25, 50, or 100 μS/cm was determined. A linear relationship was observed for conductivity ranges of 0 to 100 μS/cm [R2 = 1.0000, RSD of <1% (n = 5)] (Table V). The average slope was 0.980 with an RSD of 1% (n = 5), and the average intercept was 0.494 with an RSD of 3% (n = 5).
Linearity of Conductivity Measurements
Carryover
The baseline of <1.00 μS/cm was maintained by the rinsing and frequent exchanging of rinse water. Carryover was deemed negligible when the electrode was rinsed in a ≥150 mL water beaker for ≥5 s (15).
Stability
The conductivity of 10 vial water extracts each from three lots stored at room temperature in closed tubes were evaluated on days 0, 1, 5, and 7. The precision RSD for all 30 samples was ≤6% (Table IV). The water extracts were deemed stable when stored in a closed tube at room temperature for up to 7 days.
Conductivity vs Titration
The conductivity and titration volumes of water extracts of nine sets of seven lots of vials were measured. Within all nine sets, conductivity ranged from 1.85 to 10.82 μS/cm and titration volume from 0.05 to 0.32 mL of 0.01M HCl added to 25 mL of vial extract (Table VI). The relationship between conductivity and titration volumes was linear [Average R2 = 0.9890, RSD = 1%, (n = 9)]. Based on this relationship, conductivity in μS/cm could be converted to titration volumes in mL by a conversion factor of 0.0279 plus 0.0024. To simplify the conversion, the relationship between conductivity and titration volumes were reconsidered with the intercept set as zero. The resulting relationship was still linear and precise [Average R2 = 0.9876, RSD = 1% (n = 9)] (Table VII). The new slope did not change significantly with the unforced relationship (0.0275 vs 0.0279). Subsequently, conductivity in μS/cm could be converted to titration volumes in milliliters by a conversion factor of 0.0275 and then to alkalinity.
Correlation between Conductivity (μS/cm) and Titration Volumes (MilliLiters of 0.01 M HCl added to 25 mL Vial Extract) of Water Extracts of 3 cc Glass Vials
Correlation between Conductivity and Titration Volume of Water Extracts of 3 cc Glass Vials with Intercept Set as Zero
Comparison of Analytical Techniques
The current Ph. Eur. method utilizes colorimetric endpoint titration to measure the alkalinity of the autoclaved vial water extracts. The conductivity technique instead directly measures the ions in the water extract, including sodium, which can be easily converted to titration volumes and alkalinity. There are various advantages of the conductivity measurement versus titration. Fundamentally, conductivity measurement of the vial extract is simple, fast, and direct compared to the laborious analysis for alkalinity that requires preparation of various test solutions like methyl red and then the performance of the titration itself. More importantly, the time restraint on the analysis of vial extracts is near non-existent for conductivity compared to titration, which specifies the analysis within 1 h after removing the vials from the autoclave. Lastly, the conductivity technique was able to measure individual vial extracts compared to titration, which requires 11 vial samples combined into one. This individual measurement allows for better understanding of variability within a lot. Overall, the conductivity technique is more practical and convenient compared to the titration technique (Table VIII).
Comparison of Various Aspects of Titration/Alkalinity and Conductivity Techniques
IV. Conclusion
A conductivity method was evaluated as an alternative to titration as part of the surface test measuring the hydrolytic resistance of 3 cc glass vials. The conductivity method is suitable for determining extracted ions in the water extracts of autoclaved vials based on LOQ, selectivity, accuracy, precision, linearity, carryover, and stability. Conductivity and titration measurements on the same vial extracts showed linear empirical correlation. Conductivity results in μS/cm could be converted to titration volumes in milliliters by a conversion factor of 0.0275. The simplicity, sample stability, and individual vial analysis of the conductivity technique were advantageous compared to the current titration technique.
VI. Conflict of Interest Declaration
The authors declare that they have no competing interests.
Acknowledgments
The authors would like to Ping Yeh, Margaret Ricci, Zai-Qing Wen, Christopher Sloey, and Shawn Cao for their useful discussion.
- © PDA, Inc. 2017


