
Abstract
Polymer films have been widely used as barriers for blocking certain organic molecules (such as leachables and extractables) in both food and parenteral pharmaceutical packaging applications. However, a good understanding of the barrier properties of those polymer films is still lacking for combination drug product manufacturers to make practical risk-based assessments regarding the effectiveness of the barrier films against potential leachables. The present work addressed this issue by a combined theoretical/experimental approach—a new mathematical model based on Hansen Solubility Parameters, the size and shape of organic molecules, was developed to quantitatively estimate the Steady-State Permeation Rate of organic migrants through a model ethylene-tetrafluoroethylene fluoropolymer film by considering contributions from both solubility and diffusivity. This model facilitates expedited screening of potential leachables, allowing for experimental focus on higher-risk leachables and ultimately enabling rapid combination drug product development.
LAY ABSTRACT: Currently, there is a shortage of simple mathematical models that can accurately estimate the effectiveness of the barrier properties of polymer films; therefore, practical assessment of the barrier properties of these materials is mainly realized by experimental measurements of the permeation rates of interested migrants. These measurements can be time-consuming, costly, and inaccurate. Sometimes these measurements are even impossible if the migrant molecules are not commercially available (although we might know their molecular structures). Thus, there is a need for a practical and easy-to-use mathematical model that can estimate/predict the permeation rate through these barrier materials. To satisfy this need, we developed a new model based on the molecular polarity, size, and shape of migrant molecules to quantitatively estimate the permeation rate of the migrant molecules through these barrier materials. This model will be useful for applications in both food and drug packaging. Additionally, this model will be useful for medical devices or containers that will hold or store organic drug molecules, such as medical tubing or IV bags. Finally, organic compounds used in inks and adhesives that will permeate through packaging materials could also be modeled in the same fashion.
Introduction
Plastic (polymeric) containers are widely used to store food or drug products. Plastic containers can isolate the food or drug products from the outside environment to keep them fresh until they are used. A key property of the packaging materials used in these applications is their ability to act as a barrier to prevent oxygen and moisture from entering the container. For example, butyl rubber is one of the best known oxygen barrier materials and has been widely used in stoppers that seal glass vials containing liquid or solid drug products. Additionally, the primary packing materials, i.e., the plastic materials that are brought in direct contact with food or drug products, should also act as a barrier toward potential organic contaminations from the containers that could leach into the products. For example, ethylene-tetrafluoroethylene (ETFE) fluoropolymer films have been laminated onto the drug-contacting side of a stopper to prevent antioxidants in the rubber materials from leaching into the drug products.
Leachables from primary packaging components could pose serious risks for the parenteral drug product. Elastomeric and plastic components tend to contain a variety of additive chemicals, such as curing agents, activators, antioxidants, process aids, and fillers, which give them desirable physicochemical and functional properties. However, previous studies have shown that many of these functional additives could have negative effects on the quality and safety of the drug products (1⇓–3). Additionally, ingredients from the drug products, such as surfactants, could also bring out hazardous leachables from the primary packaging materials. For example, organic compounds leached from the uncoated rubber plungers in prefilled syringes were identified as the most probable cause of the increased incidence of pure red cell aplasia with a polysorbate 80 formulation of Eprex® (4).
To mitigate the risks associated with leachables, barrier films made of fluoropolymers are widely used in pharmaceutical packaging products to prevent leachable chemicals from moving from elastomer components into drug products. Low levels of leachables and chemical inertness make them suitable materials that can directly contact drug products (especially biologics). As in the case of Eprex, the incidence of pure red cell aplasia diminished after the same drug formulation was packaged inside prefilled syringes that have ETFE fluoropolymer film-coated rubber plungers (4).
However, the effectiveness of the barrier performance of these fluoropolymer films is challenging to evaluate. Measuring permeation rate experimentally is typically time-consuming and expensive for migrant molecules with very low permeation rates. Additionally, acquisition of accurate permeation rate data can be difficult if the permeation rate is very low, as the small concentration change at the low concentration side can easily be disrupted by small temperature or humidity changes in the testing environment. Therefore, there is an acute need to accurately estimate the permeation rate of migrant molecules through a barrier material.
As an example, a mathematical model based on Hansen solubility parameters (HSP) was developed to estimate the permeation rate of any migrant molecule through a representative ETFE fluoropolymer film. However, this model is not limited to ETFE film. The same approach can be applied to any other polymeric films or sheets or tubing. Owing to its simplicity and practicality, this model enables screening of potential leachables from container enclosure components, which further enables experimental focus on higher risk leachables and ultimately more rapid drug product development.
Materials and Methods
Mathematical Model (Based on Literature Data)
A mathematical model was developed based on historical data from previous literature. The Steady-State Permeation Rate (SSPR) of six model migrant molecules at room temperature (25°C) were directly taken from the literature, as shown in Table I. They are methylene chloride (CH2Cl2), methyl ethyl ketone (MEK), benzene, water, phenol, and Fuel C (50v%/50v% mixture of toluene and iso-octane) (5). On a molecular level, these six molecules covered a considerably wide range of different polarity, sizes, and shapes; therefore, they were chosen as representative molecules for the organic migrants.
Molecular Shape and Size Analysis
The shape of a migrant molecule can be described by its length, width, and depth in a three-dimensional space. Three characteristic diameters of each molecule were calculated using the computer software QSAR Toolbox (6). Maximum diameter (Dmax), is the diameter of the sphere with minimum diameter within which the molecule could be inscribed and can be considered the “length” of the molecule. (Deff) is the diameter of the cylinder with minimum diameter within which the molecule could be inscribed and can be considered the “width” of the molecule. Minimum diameter (Dmin) is the minimum distance between two parallel surfaces where the molecule could be inscribed and can be considered the “depth” of the molecule.
The size of a migrant molecule, in terms of molar volume, was calculated by HSPiP software version 5.0.04 (7).
Hansen Solubility Parameters
The HSP of the six migrant molecules (CH2Cl2, MEK, benzene, water, phenol, and toluene/iso-octane) was taken directly from the literature and is listed in Table I (7, 8). The HSP of Fuel C was calculated based on that of toluene and iso-octane by using HSPiP software version 5.0.04 (7).
The HSP of the ETFE fluoropolymer was taken from the literature and is also listed in Table I (9).
The molar volume (MVol) of all model penetrant molecules was calculated using HSPiP software's 10k chemical database (7).
Determination of Steady-State Permeation Rate (Experimentally)
The permeation rate measurement was conducted using the modified ASTM standard E96 method at room temperature (23 ± 1°C). Tested solvent (5.0 mL) was added to a 10 mL Pyrex glass beaker and loaded into an aluminum vapometer (EZ-Cup by Thwing-Albert, Product Catalog #68-3000). The film samples were sealed between two rubber gaskets and secured by the top aluminum cap ring (Figure 1). The entire vapometer was then weighed periodically to measure weight loss. When the speed of weight loss became stable, steady-state vapor permeation rate (VPR) was calculated based on the weight loss rate and the surface area and thickness of the tested films.

EZ-Cup Vapometer sold by Thwing-Albert.
Five different solvents, Milli-Q water, MEK, toluene, chloroform, and cyclohexane, were tested experimentally against the ETFE thin films. Milli-Q water was generated from a Millipore Water Purification System, and analytical-grade MEK, toluene, chloroform, and cyclohexane solvents were purchased from VWR Inc. Again, these organic molecules were chosen to represent organic migrants with different polarity, sizes, and shapes. A 0.10 mm (100 μm) Dupont Tefzel® ETFE film and 0.10 mm (100 μm) Saint-Gobain ETFE-E4 films were tested against the aforementioned five solvents in the lab.
Determination of Degree of Crystallinity
Differential scanning calorimetry (DSC) was used to determine the degree of crystallinity of the 0.10 mm (100 μm) Dupont Tefzel ETFE film and 0.10 mm (100 μm) Saint-Gobain ETFE-E4 films. The DSC experiments were performed on a TA Instruments Q1000 system using standard aluminum pans. The scan rate was 5°C/min. About 4 mg of sample was used in each test.
Results and Discussion
Correlation of Permeation Rate with Hansen Solubility Parameters
The HSP effectively described the comprehensive molecular polarity of the migrants and the polymer film. They were previously used to explain the compatibility (or match of polarity) between organic solvents and polymer materials (8). The theory stated that the cohesive energy of a solvent or polymer can be broken into the following three different components: (1) the nonpolar components (δd), (2) the polar component (δp), and (3) the H-bonding component (δh). The mathematical expression of this theory is:
 where δt is the total solubility parameter (8).
The compatibility between a solvent and a polymer can be estimated by their distance in a three-dimensional space with HSP (δd, δp, δh) as the coordinates (8). If the HSP of a solvent is (δd1, δp1, δh1) and the HSP of a polymer is (δd2, δp2, δh2), the distance then can be expressed in the following equation:

The weight factor of 4 was added to the equation to compensate for the relatively small differences in the δd component. The smaller the distance, the more compatible the solvent and the polymer are. When the distance in the HSP space is small enough, the solvent will dissolve or strongly swell the polymer if the solvent is abundant; the solvent will wet the polymer surface with a very small contact angle if the solvent is added to the polymer surface as a drop.
Besides HSP, Table I also lists the SSPR of six different migrant molecules through a 0.25 mm (or 250 μm) Dupont Tefzel ETFE film in the last column. These values are taken directly from the literature. These values were also normalized to the permeation rate of the same film with 1 mm thickness for fair comparison among the same ETFE films with different thicknesses. Apparently, there is no obvious correlation between the HSP distance and permeation rates.
Correlation of Permeation Rate with χ Values
A previous study also showed that the permeability through a polymer is determined by a molecule's solubility inside that molecular matrix and its diffusivity through the polymer (P = S × D) (10). The more soluble the molecule is inside the matrix of a polymer film or the faster the diffusion rate of the film, the higher the permeability will be.
The solubility of an organic molecule inside a polymer matrix is related to its χ value (8). Here, the χ value was determined by the MVol of the organic molecule and the molecule's HSP distance to the polymer matrix, as shown in eq 3. R is the ideal gas constant, and T is the absolute temperature in Kelvin. The χ values were further corrected to HSP distance values and were supposed to correlate to solubility better than HSP distance values alone.

At room temperature (25°C), the χ values of the six different solvent molecules were calculated and are listed in Table II. The SSPR and the natural log of SSPR (LnSSPR) were also listed for comparison.
The Ln(SSPR) values were plotted against the six solvents' χ values and are shown in Figure 2. It was clear that the correlation between the Ln(SSPR) and the χ values was positive, but the correlation was still very weak after linear regression (R-square value = 0.2108). Further correction is needed because χ values mainly take care of the “solubility” component of the permeability (recall P = S × D). The contribution from the “diffusivity” components needs to be added to the prediction model.

Ln(SSPR) versus χ plot.
Note: R-squared value calculated after linear regression.
Correlation of Permeation Rate with χ·(MVol) Values
Previous studies suggested that the diffusion coefficients of the migrant molecules inside a polymer matrix are related the migrants' molecular size (11⇓–13). Therefore, adding MVol values to the predicting parameters should help improve the correlation with the permeation rate. In fact, previous literature on permeation rate of Viton protection gloves already suggested that χ·(MVol) values could correlate well with Ln(SSPR) (14). Table III lists the calculated χ·(MVol) values of the six model migrant molecules, whose correlation with Ln(SSPR) was plotted in Figure 3. The R-square value calculated from linear regression was 0.665, which was a significant improvement compared to the correlation between Ln(SSPR) with χ only, as shown in Figure 2.
Permeation Rates of Six Solvents through the 0.25 mm (250 μm) Dupont Tefzel® ETFE Film Compared to their χ·(MVol) Values (8)a

Ln(SSPR) versus χ·(MVol) plot.
Note: R-squared value calculated after linear regression.
Correlation of Permeation Rate with χ·(MVol)·Diameter Values
Because most molecules are not spherical, three different diameters (Dmax, Deff, and Dmin) can be used to describe the shape of a single molecule, as mentioned in the Materials and Methods section. All of these diameters for any molecule can be calculated using computer software based on quantum mechanics principles, if the molecule structure is known (6). A previous study also showed that the total molecular volume of the migrant and the shape of the migrant directly affect the diffusion rate and, in turn, the permeation rate (15). The authors of the previous study considered an average effect of all three different molecular diameters (Dmin, Deff, and Dmax). In the current paper, we wanted to study each individual contribution from the three different molecular diameters (Dmin, Deff, and Dmax) separately to determine which one affects the diffusion rate and therefore the permeation rate the most.
Table IV lists the calculated Ln(SSPR) values against three different χ·(MVol)·diameter values. Figure 4 shows the plot of Ln(SSPR) against three different χ·(MVol)·diameter values. It was clearly shown that the Ln(SSPR) versus χ·(MVol)·Dmin has the best correlation after linear regression, as the R-square value was improved to 0.8308.

Ln(SSPR) versus χ·(MVol)·diameter plot.
Note: R-squared value calculated after linear regression.
It is interesting that χ·(MVol)·Dmin showed the best correlation with the Ln(SSPR), as molecules seem to try to use their “slimmest” shapes to diffuse through the free volume of the fluoropolymer film. When aligning itself in the direction of minimum diameter, a molecule will cause the minimum amount of deformation of the surrounding polymer chain. In other words, the migrant molecules align themselves in the direction that will require the least energy for passage through the entangled polymer chains.
Experimental Confirmation of the Correlation of Permeation Rate with χ·(MVol)·Dmin Values
Once the correlation between the above Ln(SSPR) and χ·(MVol)·Dmin values was derived from literature values, the next step was to confirm this relationship with experimental data. To reduce the waiting time for the permeation tests, we used 0.10 mm Dupont Tefzel ETFE thin film instead of the previously mentioned 0.25 mm Dupont Tefzel ETFE films (5). Five different solvents (Milli-Q water, MEK, toluene, chloroform, and cyclohexane) were tested against these 0.10 mm (100 μm) Dupont Tefzel ETFE thin films using the VPR measurement method described in the experimental section (ASTM E96). The weight loss versus time data are shown in Figures 5 to 9 for the 0.10 mm Dupont Tefzel® ETFE film. The slope of the linear regression fitting of the weight loss versus time curve gives the VPR in the unit of grams per hour.

Weight loss versus time curve (blue) and vapor permeation rate calculation (red) of water molecules through 0.10 mm Dupont ETFE film.

Weight loss versus time curve (blue) and vapor permeation rate calculation (red) of MEK molecules through 0.10 mm Dupont ETFE film.

Weight loss versus time curve (blue) and vapor permeation rate calculation (red) of toluene molecules through 0.10 mm Dupont ETFE film.

Weight loss versus time curve (blue) and vapor permeation rate calculation (red) of chloroform molecules through 0.10 mm Dupont ETFE film.

Weight loss versus time curve (blue) and vapor permeation rate calculation (red) of cyclohexane molecules through 0.10 mm Dupont ETFE film.
This VPR is normalized by considering the top opening area of the EZ Cup Vapometer (area = 31.65 cm2) and the thickness of the ETFE film (L = 0.10 mm). Therefore, the final reported SSPR was calculated by the following equation: SSPR = (VPR) × L/Area. The unit of the SSPR is normalized to gram·millimeter/(m2·day) for easy comparison with literature values. Table V summarizes VPR results and the calculated SSPR results for 0.10 mm Dupont ETFE thin film.
SSPR Results for 0.10 mm Dupont Tefzel® ETFE Thin Filma
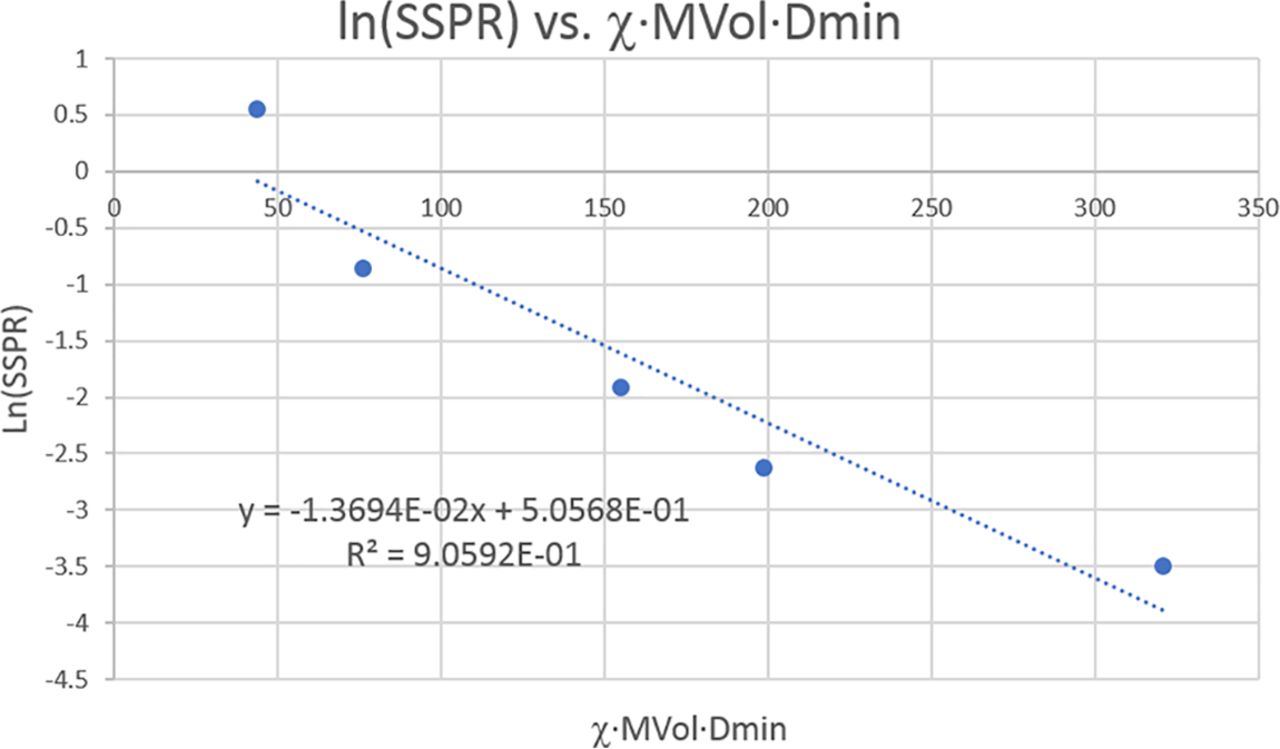
Figure 10 shows the plot of Ln(SSPR) versus χ·(MVol)·Dmin for the 0.10 mm Dupont ETFE thin film. The data were taken from Table V. After linear regression analysis, the R-square value was 0.906. Therefore, we confirmed that there is a linear relationship between Ln(SSPR) and χ·(MVol)·Dmin values with our own experimental results.

Ln(SSPR) versus χ·(MVol)·Dmin for the 0.10 mm Dupont Tefzel® ETFE thin film (based on experimental data).
In summary, based on both literature values and experimental data, we can model the permeation rate of the ETFE fluoropolymer film using the following equation:
 where A and B are constants for each different ETFE polymer film. A and B can vary among different films owing to changes in density, free volume, molecular weight, crystallinity, or surface treatment. However, for each individual thin film, they should stay at the same level across a wide range of χ·(MVol)·Dmin values.
Therefore, if an acceptable linear relationship between Ln(SSPR) and χ·(MVol)·Dmin values has already been established using a few experimental data points (i.e., as long as the R-square value of linear regression >0.9), this linear model can be used to predict the permeation rate of migrant molecules that has not been tested experimentally, or it can be used to check the accuracy of the experimental measurement results of the permeation rates of the new molecules.
This model has many practical advantages. First, it can be used to estimate permeability for certain molecules of interest that are difficult to obtain. For example, it is not easy to synthesize standards for leachables, such as hydrocarbon oligomers (with 13 to 21 carbon atoms), from butyl rubber enclosure parts. Second, certain molecules could have very small permeation rates and long breakthrough times; therefore, the measurement of their permeation rates could be less accurate, because the relative error ratio will increase with the decreasing permeation rates. This model will help to identify these molecules and predict the possible range of these very low permeation rates. Finally, this model can save precious experimental time by filtering the low-risk leachables out (as long as the model predicts that these low-risk leachables will certainly be blocked by the barrier) and allow the scientists to focus on the experimental assessment of high-risk leachables that could migrate through the barriers.
Besides its predicting capabilities, this model also offers insights to help understand the barrier properties of the ETFE fluoropolymer thin films. First, the differences in the polarity between the migrant and the fluoropolymer are important. Polarity of the molecules and the fluoropolymer can be described by HSP, which affects solubility and then permeability strongly. A smaller distance in the HSP space typically means a closer molecular polarity between the migrants and the polymer, which will lead to better compatibility and higher solubility of the migrant molecules inside the polymer. Because P = D × S, higher solubility also means higher permeability for the migrant molecules. Second, the size of the migrant molecules has an important effect on the permeation rate. A larger MVol of the migrant molecule will decrease both the solubility and mobility (diffusivity) of the migrant molecule and therefore will reduce the permeation rate as well. Finally, the shape of the migrant molecules also affects the permeation rate. For molecules with the same volume, those with higher aspect ratio or flatter molecular configuration (such as aromatic molecules) tend to have smaller Dmin values, which will help them to diffuse through the entangled polymer chains more easily.
All these insights and predicting capabilities will facilitate realistic estimations of the barrier properties of the ETFE fluoropolymer films, which will avoid the risks that are caused by over-estimating the barrier properties of these films. This will also allow us to focus on higher risk leachables and ultimately enable more rapid drug product development.
Effects of Crystallinity of the Barrier Film
Another factor we need to consider is the crystallinity of the film. To focus on the effect on crystallinity, we chose to compare two ETFE thin films with the same thickness but different degrees of crystallinity. These two ETFE films are the 0.10 mm Dupont Tefzel ETFE film and the 0.10 mm Saint-Gobain ETFE-E4 film. DSC testing results (Figure 11) showed that the heat of fusion for the 0.10 mm Dupont Tefzel ETFE film was 28.566 J/g, and the heat of fusion for the 0.10 mm Saint-Gobain ETFE-E4 film was 39.096 J/g. A previous study suggested that the heat of fusion for ETFE polymers at 100% crystallinity is 113.4 J/g (16). Therefore, the degree of crystallinity is 25.19% for the Dupont Tefzel ETFE film and 34.48% for the Saint-Gobain ETFE-E4 film (degree of crystallinity = heat of fusion of semi-crystalline polymer/heat of fusion of 100% crystalline polymer). The Saint-Gobain ETFE-E4 film has a much higher degree of crystallinity and should have smaller free volume. Because smaller free volume leads to a slower diffusion rate through the polymer, we should expect a slower permeation rate of the same organic migrant molecules through the Saint-Gobain ETFE-E4 film, compared to those through the Dupont Tefzel ETFE film.

DSC spectra of the 0.10 mm Dupont Tefzel® ETFE thin film (left diagram) and the 0.10 mm Saint-Gobain ETFE-E4 thin film (right diagram).
To compare the permeation rate of the films with different degrees of crystallinity, we tested the permeation rates of the same migrant molecules against 0.10 mm Saint-Gobain ETFE-E4 thin film and compared these permeation rates with the previously tested 0.10 mm Dupont Tefzel ETFE films. Five different solvents (Milli-Q water, MEK, toluene, chloroform, and cyclohexane) were tested against these 0.10 mm (100 μm) Saint-Gobain ETFE-E4 thin films using the same experimental methods. The weight loss versus time data and permeation rates are shown in Table VI for the 0.10 mm Saint-Gobain ETFE-E4 film. Figure 12 shows the plot of Ln(SSPR) versus χ·(MVol)·Dmin for the 0.10 mm Saint-Gobain ETFE-E4 thin film. The data were taken from Table VI. After linear regression analysis, the R-square value was 0.907. Therefore, we confirmed again that there is a linear relationship between Ln(SSPR) with χ·(MVol)·Dmin values with our own experimental results.
SSPR Results for 0.10 mm Saint-Gobain ETFE-E4 Thin Film

Ln(SSPR) versus χ·(MVol)·Dmin for the 0.10 mm Saint-Gobain ETFE-E4 thin film (based on experimental data).
The SSPR of the 0.10 mm Dupont Tefzel ETFE film (Table V) can be compared to that of the 0.10 mm Saint-Gobain ETFE-E4 film (Table VI). It was clear that the permeation rate of the same organic molecules through the Saint-Gobain ETFE-E4 film indeed was lower than that through the Dupont Tefzel ETFE film, which is exactly what we expected due to the higher degree of crystallinity of the Saint-Gobain ETFE-E4 film. However, the linear relationship between Ln(SSPR) and χ·(MVol)·Dmin values still holds, despite the changes in degree of crystallinity.
Conclusions
This study demonstrated that the permeation rate of molecules through a fluoropolymer thin film can be modeled as a linear relationship with the migrant's χ·(MVol)·Dmin value.
This new model expressed in eq 4 can not only help predict a variety of organic molecules' permeation rates for certain ETFE fluoropolymer films (if >4 or 5 molecules' permeation rates are known and a linear relationship can be established) but also offer scientific insights into which factors will affect the permeation rates of the migrant molecules. Additionally, we also demonstrated that the degree of crystallinity of the polymer also played an important role of affecting the permeation rate, most likely through affecting the diffusion rate of the migrant molecules.
The χ·(MVol)·Dmin approach showed here could have much broader applications beyond this study. For example, the same approach can be used to study other polymer films' barrier properties if we know their HSP, which will fit wide applications in pharmaceutical packaging, food packaging, and protection coatings. Another general wisdom we gained from this study is that scientific data are more accessible than ever in the current digital age, but the key is how to turn these data into knowledge. This study serves as a good example to show that it is possible to obtain knowledge before starting related experiments using existing study data, which could save valuable time and resources.
On the other hand, the authors also believe that there is room for improvement for this model. This is a limited set of molecules. The utility of setting out a better model for further tests by the authors and others will mitigate the limited set of molecules to test the model. This will be the focus of our future work. We also suggest that interested readers from the scientific community help us make this model better by further exploring the system with other examples.
Conflict of Interest Declaration
The authors declare that they have no competing interests.
Ownership Statements
Eprex® is a registered trademark of Johnson & Johnson.
Tefzel® is a registered trademark of The Chemours Company.
- © PDA, Inc. 2019


Jump to section
Related Articles
Cited By...
- Modeling the Migration Behavior of Extractables from Mono- and Multilayer Polyolefin Films to Mathematically Predict the Concentration of Leachable Impurities in Pharmaceutical Drug Products. Part 1: Experimental Details and Modeling Experimental Results
- Evaluating Nitrosamines from Elastomers in Pharmaceutical Primary Packaging
- An Investigation to Examine the Effect of the Elastomeric Surface Treatment on Protein Stability