
Abstract
This case study is the first to address the risk, at the device-to-vial interface, of a spike pushing a stopper into a vial. It was performed after healhcare workers at cancer care hospitals complained about the risk of possible exposure to hazardous injectable drugs during the transfer if the spike pushed the stopper into the vial. This case study took a three-step approach to understand the device-to-vial interface and the factors that determine stopper push-in force threshold and spike puncture force, respectively. The results show that the stopper push-in force threshold varies with the spike size, stopper properties, and stopper design, while the spike puncture force is determined by spike design, spike surface lubricity, stopper properties, and stopper design. This case study suggests that to mitigate the risk of stopper push-in, the spike puncture force needs to be significantly lower than the stopper push-in force threshold, measured with a flat-tip test probe having the same outside diameter as typically used spikes. In addition, although some factors that impact stopper push-in force threshold also impact spike puncture force in the same trend, such as stopper material, other factors that impact stopper push-in force threshold do not impact spike puncture force and vice versa. For example, the spike length and cross-section area contribute to stopper push-in force threshold but do not have significant impact on puncture force. It would be misleading to just compare the absolute values of spike puncture forces but neglect the dimensional factors. From the stopper and spike compatibility perspective, this case study provides a methodology to quantify the risk of the stopper being pushed into the vial by the spike and suggests a process to prevent the stopper push-in from occurring. The study also shows that the human factor is another important element in the stopper push-in issue. It emphasizes the need for a joint effort for risk mitigation across the board among stopper manufacturers, spike manufacturers, pharmaceutical manufacturers, device manufacturers, and hospitals (pharmacies and healthcare workers). Device and drug developers need to properly select and test stoppers and containers with intended spikes. Healthcare workers need to use compatible stoppers and spikes and need to use them correctly.
LAY ABSTRACT: It is critical to protect healthcare workers from exposure to hazardous drugs such as cancer drugs. Since the 1970s, much work has focused on the development of closed-system drug-transfer devices (CSTD) to ensure the containment of spills, sprays, and vapors. However, other gaps in the cancer drug transfer process have been overlooked. For example, one gap at the device-to-stopper interface is the compatibility of vial stopper and spike. This case study is the first to address the risk at the device-to-vial interface of stopper push-in by the spikes during the transfer of hazardous injectable drugs. It serves to understand the issue of spikes pushing stoppers into the vial. It shows that the push-in force threshold varies with the spike diameters, stopper materials, and design. The spike puncture force is impacted by spike design, surface lubricity, stopper materials, and design. To prevent the stopper from being pushed into the vial, causing splashes and exposure to the drug, it is important to coordinate the stopper push-in force threshold and spike puncture force and optimize the spike dimensions. The human factor also affects the drug transfer. This case study provides a methodology to quantify the stopper push-in risk from a force and dimensional perspective.
Introduction
Although cancer drugs may effectively suppress cancer cell growth, they may damage healthy organs and immune systems. The exposure to these drugs has been recognized as a health hazard for healthcare workers since the 1970s, because it has been proven to cause hair loss, skin rashes, infertility, miscarriage, birth defects, and even leukemia or other forms of cancer (1⇓⇓⇓⇓⇓⇓–8). Therefore, it is critical to protect healthcare workers from exposure to hazardous drugs such as cancer drugs. Since the 1990s, the industry has made tremendous efforts to develop closed-system drug-transfer devices (CSTD) for the containment of hazardous drug drips, sprays, and vapors (9⇓⇓–12). In 2004, the NOISH (National Institute for Occupational Safety and Health) advised us to consider the use of CSTD (13). After 15 years of validation on the necessity of integrating a CSTD into the safe handling of hazardous drugs, the US Pharmacopoeia (USP) introduced the integration of CSTDs into the hazardous drug safety program in 2014. Furthermore, USP General Chapter <800> Hazardous Drugs, Handling in Healthcare Settings, was proposed to become official July 1, 2018. This USP clearly illustrates the practices and quality standards for handling hazardous drugs to promote patient safety. This chapter stipulates that techniques and ancillary devices that minimize the risk posed by open systems must be used when administering hazardous drugs through certain routes (14).
The use of various CSTDs focuses on the containment of spills, sprays, and vapors. There are still gaps constituting safety risks in hazardous drug handling, for example, gaps in the device-to-vial interface addressed by Firouzan (15). Because vials come in a variety of sizes, it is important to consider the following attributes: vial sizes range from 1 mL to 100 mL; vial neck sizes range from 13 mm to 32 mm; and depth of the vial ranges from the top to the bottom. All current CSTD manufacturers have addressed vial neck diameters; however, not all have addressed the overall depth of the vial to the length of the spike of the CSTD. Ease of entry of the vial spike into the variety of vial stopper materials is an area that needs further development. Work on both stoppers and spikes should be coordinated to minimize spiking errors caused by the varying thicknesses and shapes of vial stoppers and to mitigate the drug exposure risk during the spiking process. However, no industry standards provide guidance on what is optimal or how to optimize the compatibility of vial spikes and vial stoppers to accomplish this. Recently, healthcare workers at cancer care hospitals inquired about the risk of possible exposure to hazardous injectable drugs if the spike pushed the stopper into the vial. This triggered the motivation of this investigation.
The purpose of this case study is to understand:
Why stopper push-in incidents occur
What factors contribute to the stopper push-in
How we can quantify the risk
How to mitigate the risk.
The scope of this investigation focuses on chemo spikes, because many cancer drugs are hazardous. Healthcare workers at cancer care hospitals usually use 20 mm stoppers in the transfer of hazardous injectable drugs. Therefore, 20 mm stoppers are selected with the representation of formulations with different hardness/modulus and designs with and without film lamination and different diaphragm thicknesses. The sources of spikes vary—from the customer, within West, and those that are currently/commercially available. Chemo spikes are usually vented with CSTDs. Some non-chemo-vented spikes are included in the study because they potentially can be chemo spikes with the addition of CSTDs. CSTDs do not appear to interfere with the testing. Non-vented spikes and intravenous spikes are not in the scope of this investigation.
Cause Analysis
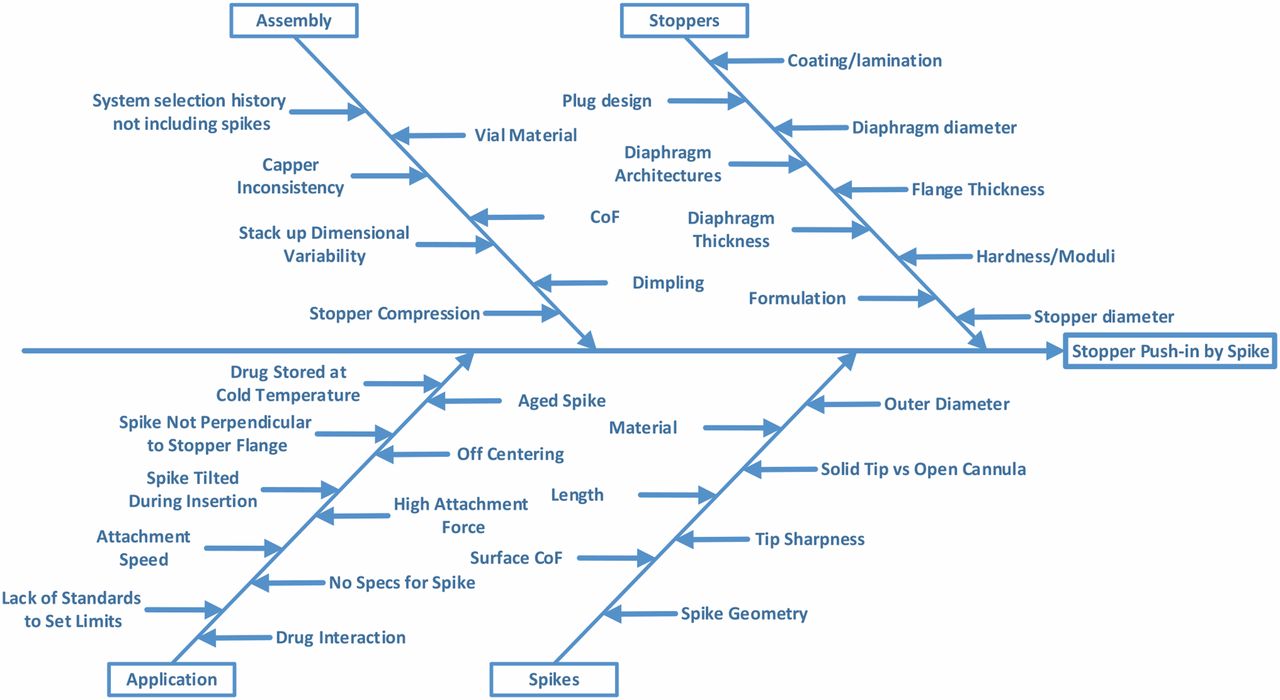
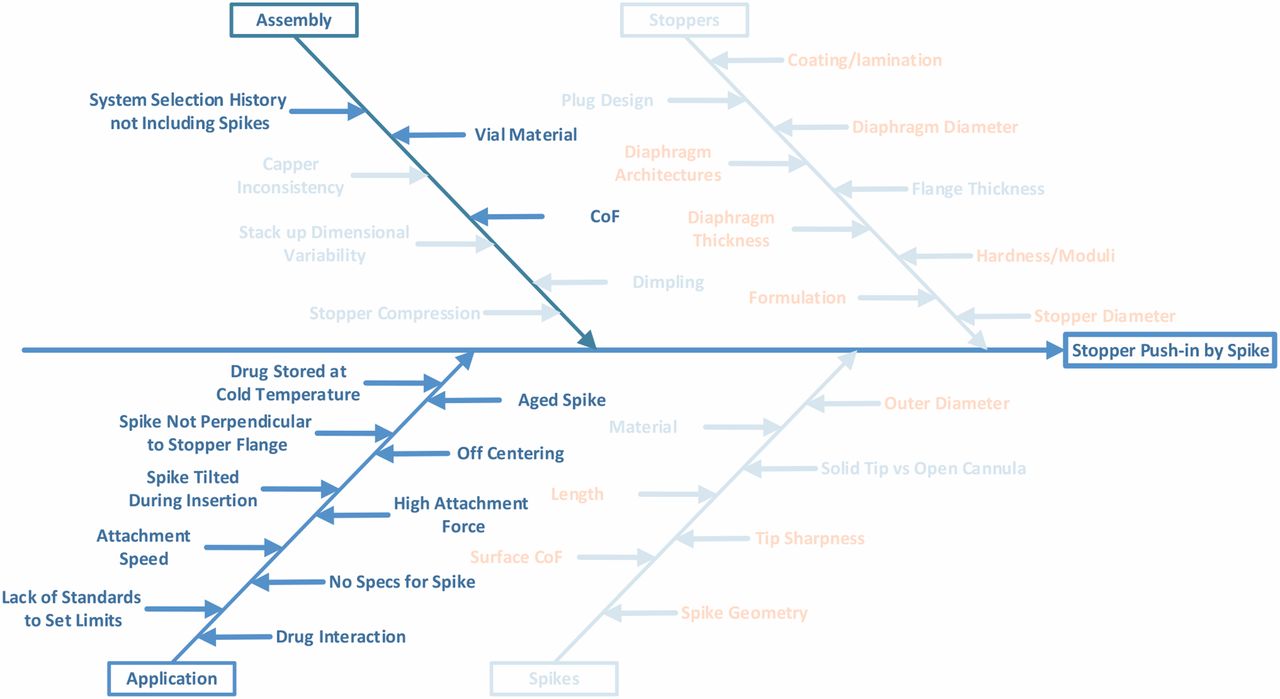
A cause analysis was performed by considering all potential causes of failure as shown in Figure 1.

Stopper Push-in Root Cause Analysis.
Potential causes from both stopper and spike will be considered in the investigation. Some causes in assembly will also be considered, such as stopper compression during crimping and dimpling. Other causes of assembly are not within the control of stopper manufacturers, such as system selection by the pharmaceutical companies. Historically, spike requirements were not included because it was not recommended to use spikes on stoppers. However, metal needles can more easily puncture the skin. Thus, regulation changes on hazardous drug handling indicate a preference for drug transfer with something other than a metal needle to mitigate the risk of someone accidentally being stuck with a needle carrying a hazardous drug. Use of plastic spikes has become a trend in the healthcare industry, especially in chemotherapy. The causes of application by the end users are beyond the control of stopper manufacturers as well. For example, drugs can be stored at cold temperature. The vial temperature is still below room temperature when the drug is drawn from the vial. In this case, the stopper is cold, rigid, and easier to be pushed in. On the other hand, there are no current regulatory guidelines and standards on spikes to set limits in applications. The hospitals or pharmacies use only their preferred spikes, even though those spikes may not be compatible with the stoppers.
Experimental Testing
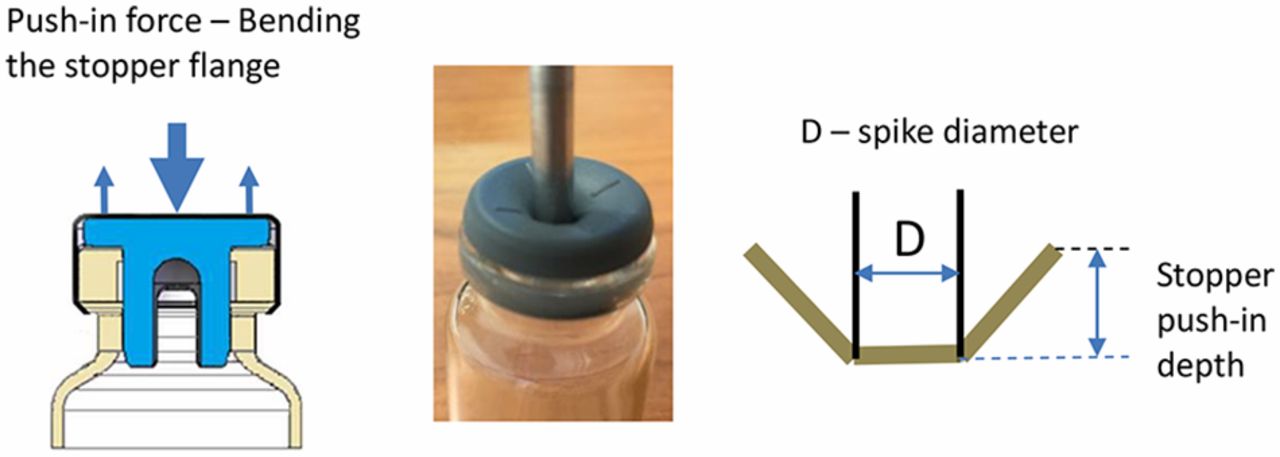
The issue is the spike pushing the stopper into the vial. The spikes are designed to puncture the stopper, instead of pushing the stopper into the vial. However, any force that is applied on the top of the stopper, which is in the area above the vial neck open section, can potentially push the stopper in. Drawings and Figure 2 illustrate the force applied to push the stopper and the deformation of the rubber stopper under the force. When a force is applied on the central area of the stopper, the stopper deforms as shown in the sketch on the right side. The distance that the stopper is pushed into the vial neck is defined as the push-in depth. The push-in depth at which the stopper is pushed into the vial is defined as the push-in depth threshold. The measurement of the push-in depth threshold will be described in Step 1.

Illustration of stopper being pushed in.
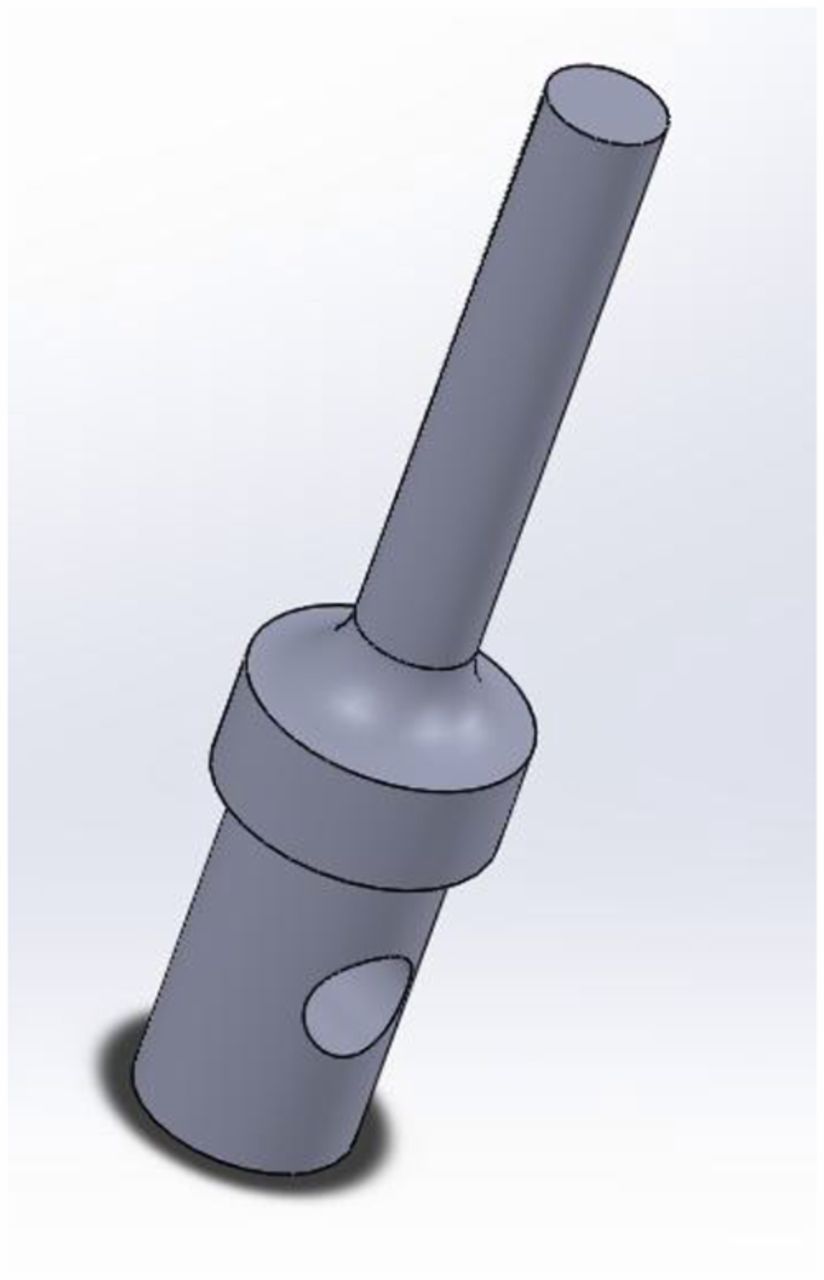
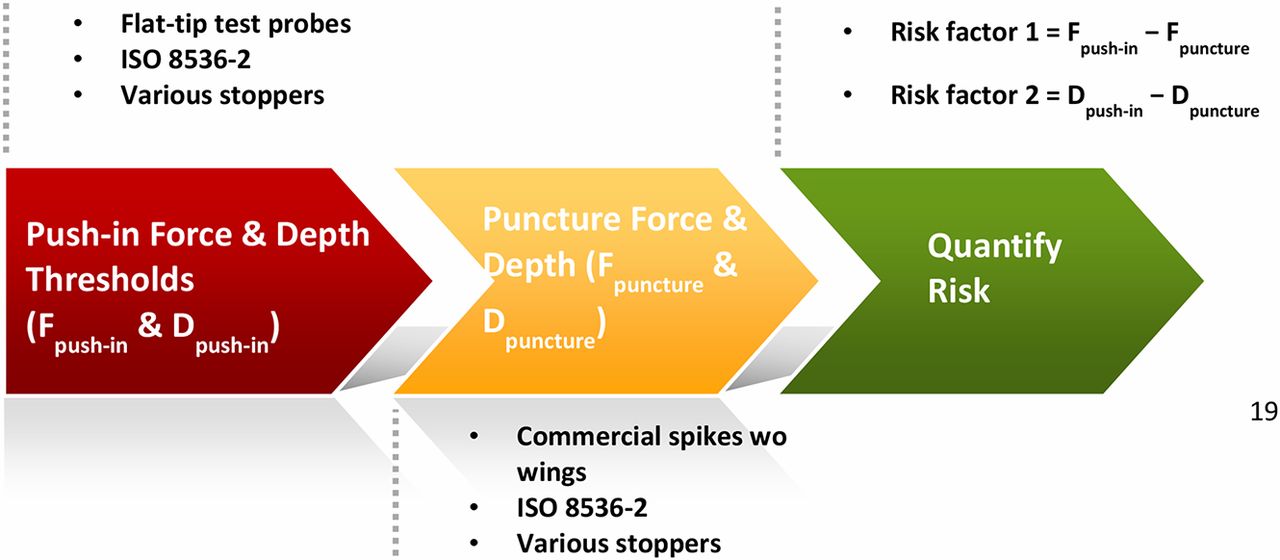
To better understand the push-in force threshold of a stopper, we made test probes with flat tips (Figure 3). Pointy spikes are not suited for the purpose of testing push-in force because pushing and puncturing are two competing movements for a spike. The stopper deforms/stretches when being pushed by a spike. However, the deformation/stretching would either stop or decrease as soon as the spike punctures the stopper because the stopper rebounds and will no longer go down the vial neck. Therefore, for us to understand the push-in phenomenon, it was better to isolate pushing from puncturing. The investigation followed a three-step process:
Step 1. Determine the stopper push-in force and push-in depth thresholds with flat-tip test probes by isolating pushing from puncturing. The test probe out diameter should be close to the out diameter of the interested spike.
Step 2. Determine spike puncture force and puncture depth.
Step 3. Develop a quantitative method to quantify stopper push-in risk.

Test probe CAD drawing.
Spikes are usually much larger in diameter than needles because they are made of plastic instead of metal and require much thicker walls. For vented spikes, the designs need to accommodate vents that make spike geometry more complicated. A vented spike is usually bigger in diameter than a non-vented spike. The size range of the flat-tip test probe covers the possible spike diameter, 2.12 mm–6.50 mm. The 6.50 mm diameter is the maximum diameter of intravenous spikes per ISO 22413 (16), although the maximum size is not meant for the use of a vial adapter. There is no standard on spike dimension just for the vial adapter application. The vented spikes for vial application are mostly no larger than 4.5 mm.
Step 1. Determine the Stopper Push-in Force and Push-in Depth Thresholds:
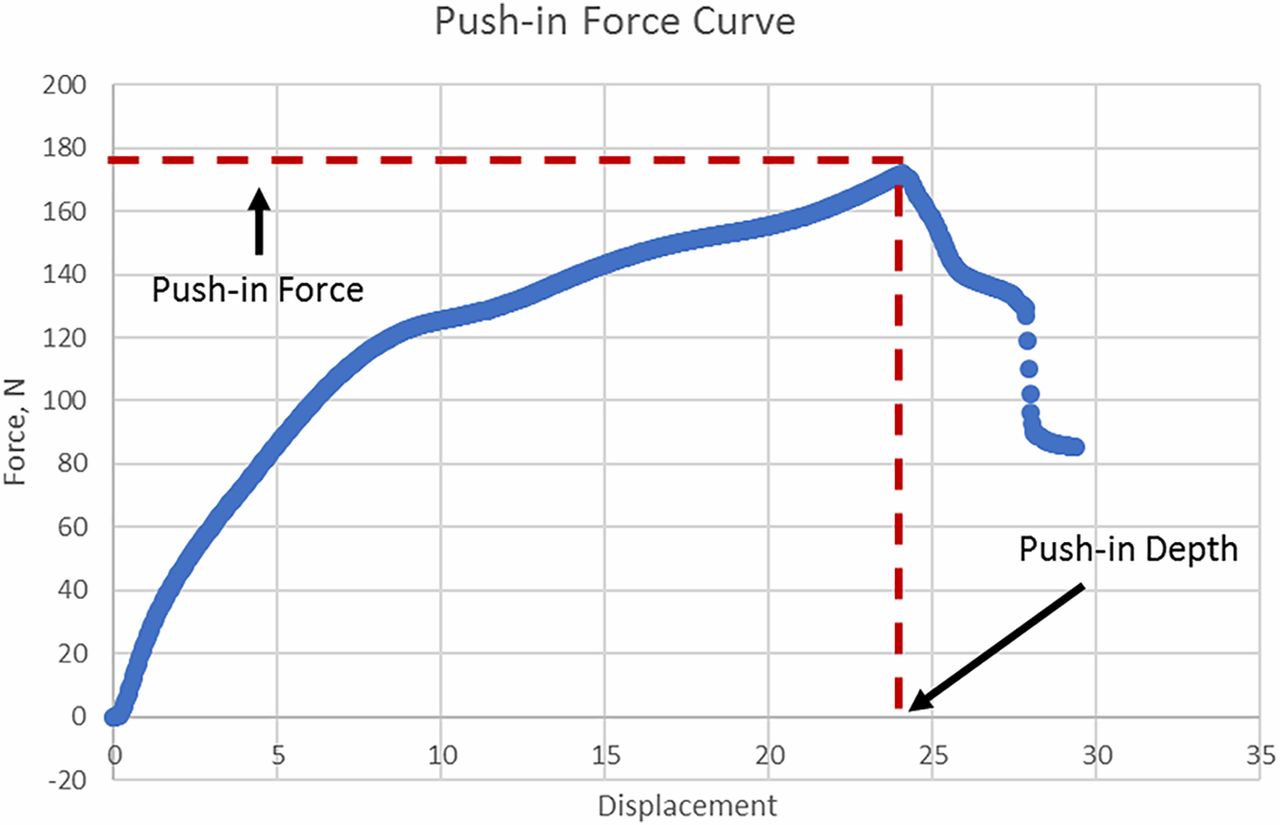
Three sizes of metal flat-tip test probe as shown in Figure 2 were made to cover the spike range with diameters of 2.12 mm, 4.00 mm, and 6.50 mm, respectively. The push-in force is tested by modifying the puncture force test method in ISO 8536-2 (17) on an Instron by using the flat-tip test probes instead of spikes. In each test, the test probe is lowered until its tip just touches the top of the stopper before starting the test. Because the push-in action is a concurrent and inseparable action occurring during puncturing, the push-in test speed should be set to be the same as the puncturing test, which is 200 mm/min. The maximum value of the force curve is taken as the push-in force threshold. The probe displacement at the maximum force value is taken as the push-in depth threshold. Because the initial position of the test probe is on the top of the stopper flange, the travel distance of the test probe tip at the push-in moment is considered equal to the stopper push-in depth. Figure 4 shows how push-in force and depth values are determined. The number of replicates is 10 per stopper per test probe.

Push-in curve.
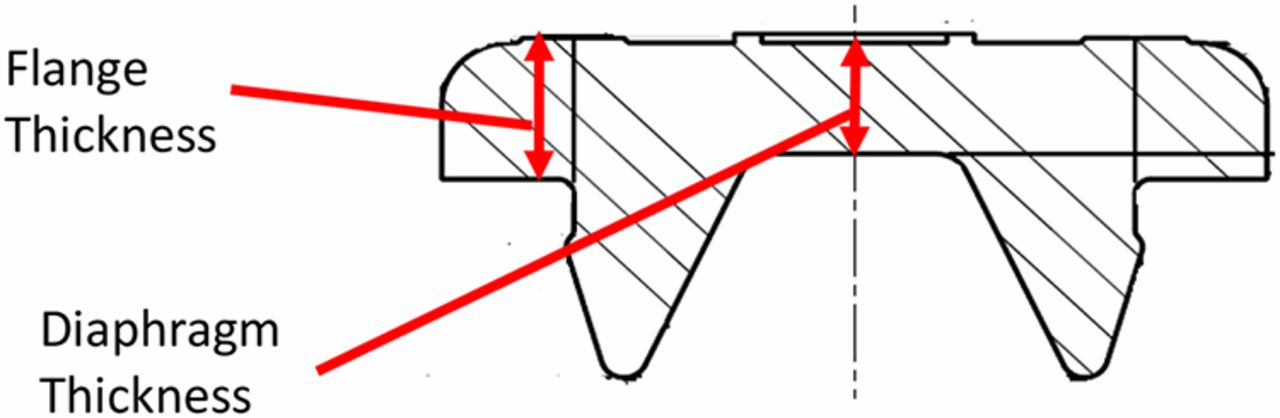
Six 20 mm serum stoppers that represent different materials and designs were selected to test. Figure 5 shows a drawing of a stopper. The key stopper attributes are formulations with different hardness/moduli, with or without fluoropolymer film lamination on the plug side, diaphragm thickness, and flange thickness, summarized in Table I. It appears that flange thicknesses are very close for all stoppers, as standardization is needed to fit crimping seals and vials from various manufacturers. However, hardness/modulus and diaphragm can be quite different. Stoppers with fluoropolymer film laminated on the plugs are included in this study, because there are always questions raised on the impact from the film on the stopper compatibility with needles/or spikes.

Stopper drawing.
List of the Selected Representative Stoppers
Step 2. Determine Spike Puncture Force:
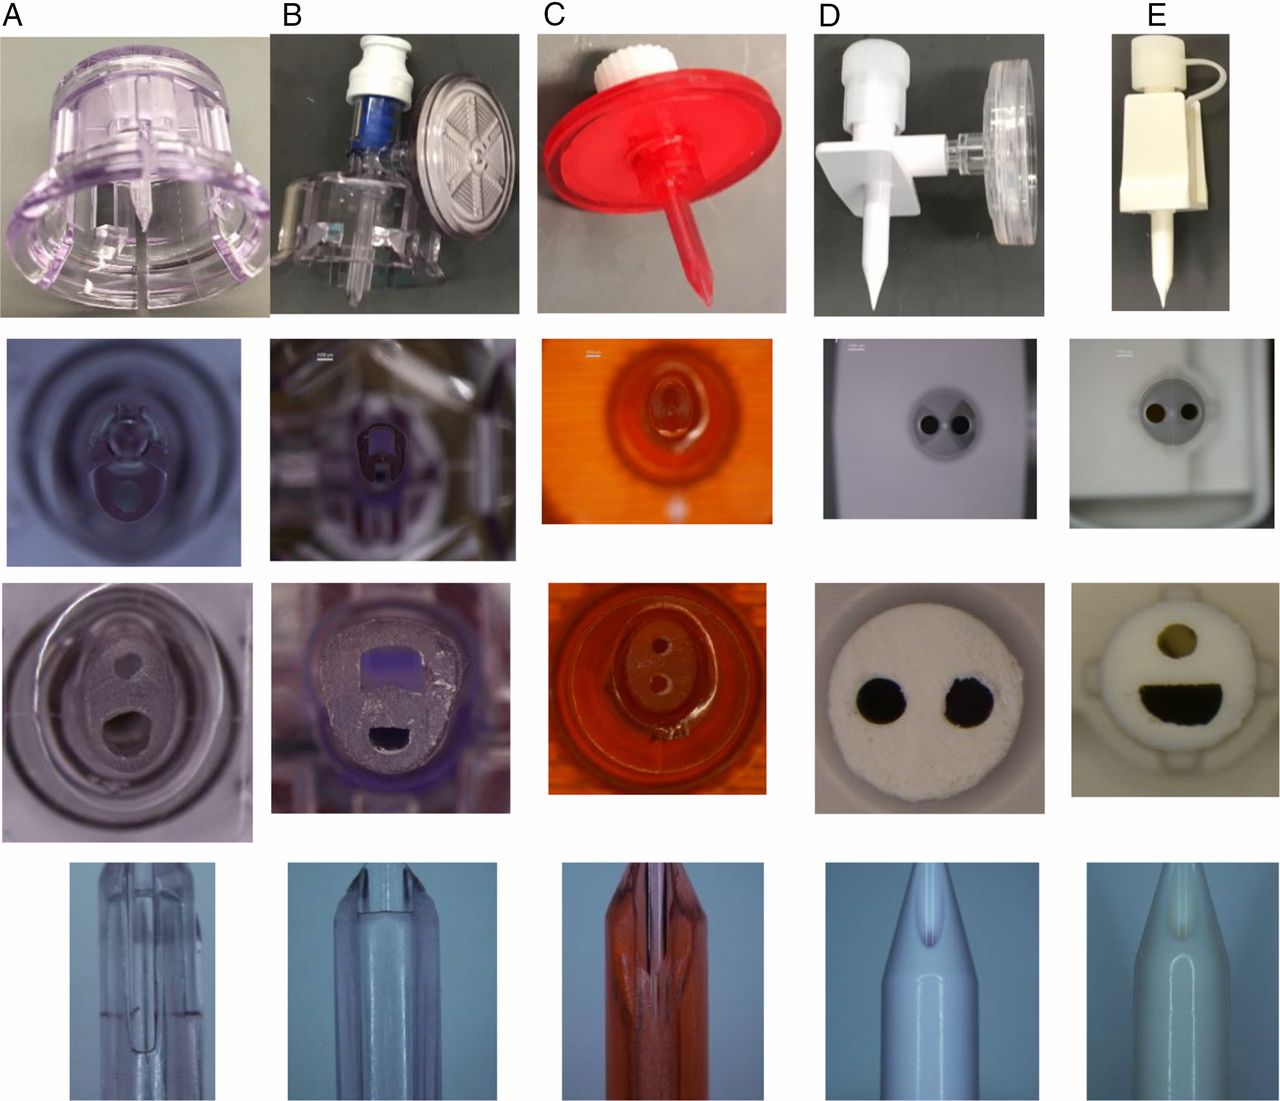
In addition to the chemo spike provided by the customer initiating the issue, four additional spikes, which are either currently used or potentially can be used as chemo spikes, were obtained. All spikes were vented. The spikes were quite different in material and design. Table 2 lists the spikes' key characteristic attributes. From the top to the bottom in the table, spikes are listed from the smallest to the largest in size. Photos were taken from four different views—whole part, tip, cross section, and spike side—to capture the different designs shown in Figure 6.
Spike Characterization

Spike photos taken from four different views.
Spikes B, C, and D are chemo spikes with CSTDs attached, while spikes A and E are not for chemo application. Spikes D and E are very similar in design, while there is no similarity among the rest. The cross-section photos show that spikes D and E are round, spikes A and C are oval-shaped, and spike B has an irregular shape.
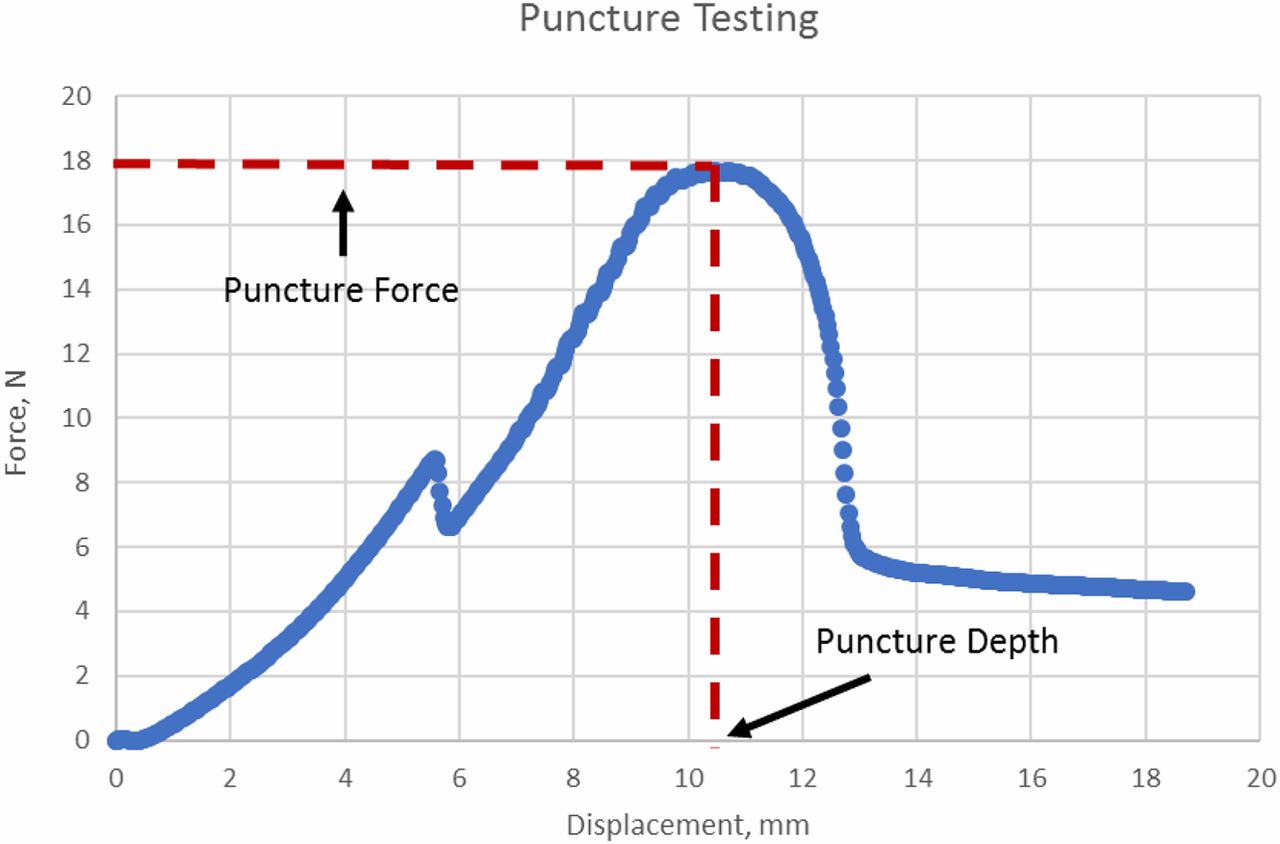
The puncture force test followed the puncture force test method in ISO 8536-2 (17) using an Instron. The spike is lowered until its tip almost touches the top of the stopper. The 20 mL vials were capped with various stoppers listed in Table I and crimped with aluminum seals. Three replicates were tested per spike per stopper. All wings, if present, were either bent up or cut to measure the pure spike puncture force, as the push-in is caused only by the force applied by the spike on the top of the stopper. The maximum value of the force curve was taken as the puncture force, because any wings present were eliminated. Figure 7 shows how the puncture force and puncture depth values were determined.

Puncture testing curve.
Results and Discussions
Test Method
ISO 8536-2 (17) is used to test both push-in force and depth thresholds and puncture force and depth, in which 200 mm/min is specified for the testing. The industry has raised a question on this speed setting, because the speed at which the spike is pushed through the stoppers in the real-world setting (e.g., during use by a nurse in the hospital) is much faster than the 200 mm/min according to human factor study. Because the focus of this paper was to develop a risk-based approach to address the stopper push-in issue that occurs during spike puncturing, the speed used for push-in test was set to be the same as the puncture speed.
Step 1. Determine the Stopper Push-in Force and Push-in Depth Thresholds:
Before performing the test, several questions were raised regarding the sample preparation:
Will crimping of the vial impact the stopper push-in force threshold?
Will dimpling of the crimped stopper affect the stopper push-in force threshold? (Dimpling occurs during crimping when the stopper is very soft or crimping force is excessive.)
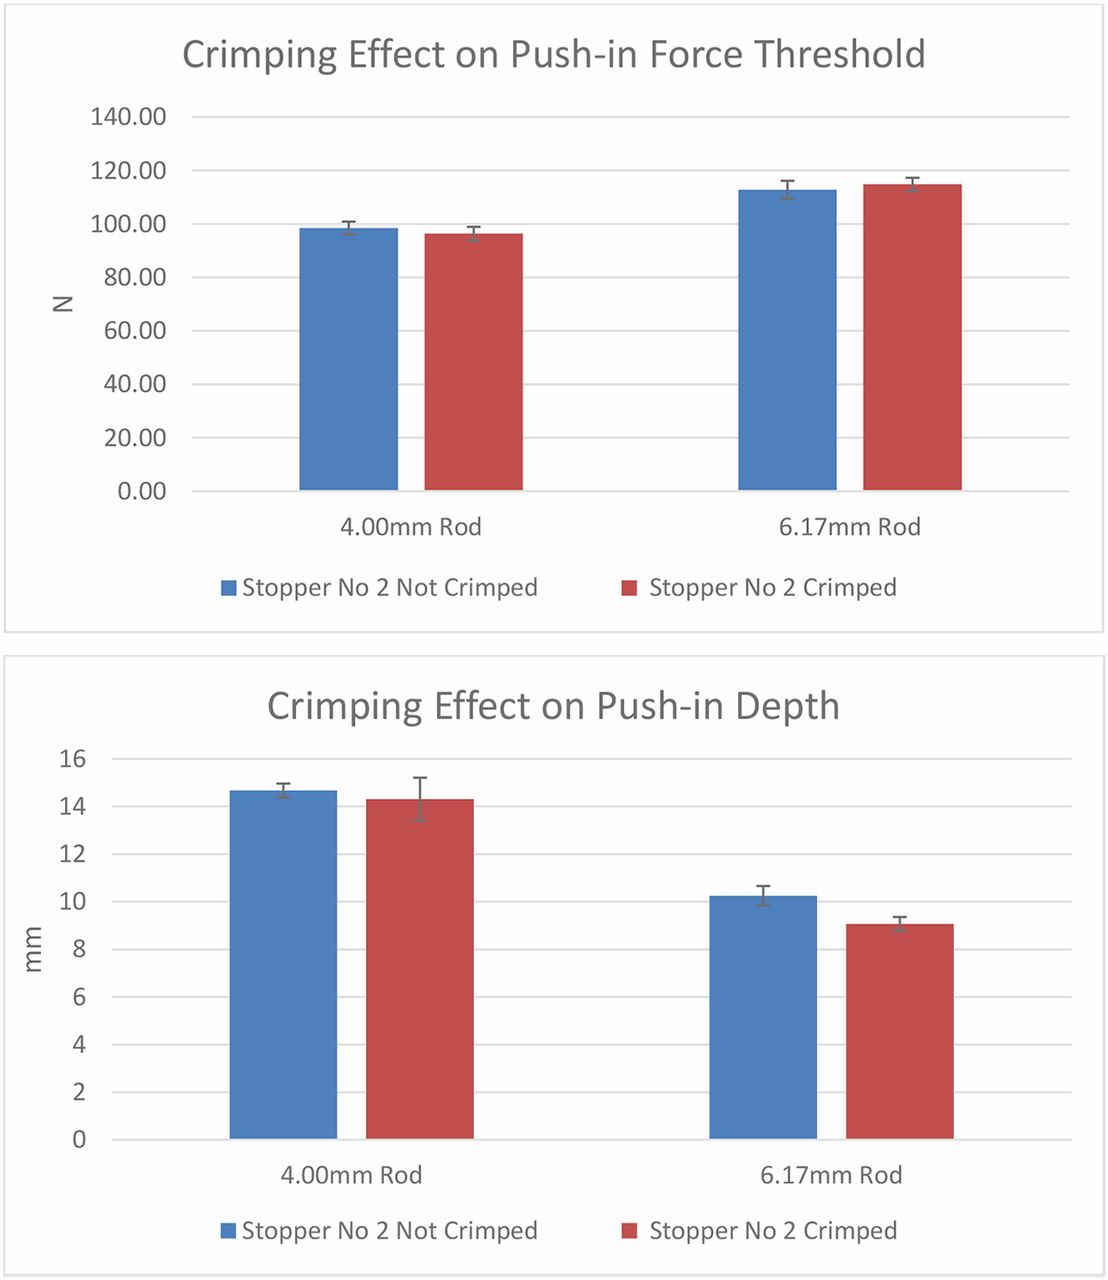
Several experiments were performed to answer the above questions. The first experiment was to determine whether crimping of the vial would affect the stopper push-in force limit. Stopper 2 was tested for demonstration purposes, and the results are shown in Figure 8. Figure 8 indicates that crimping has little effect on push-in force thresholds and push-in depth. Before the testing, it was assumed that the push-in force threshold for the crimped vials would be higher than that for the uncrimped vials, because the seals on the crimped vials provide pressure to hold the stopper down. It would take extra force to overcome the force holding down the stoppers by the seal. However, the result suggested otherwise. The deformation of the stopper before being totally pushed into the vial neck explains why crimping does not impact either push-in force threshold or push-in depth. As shown in Figure 1, when the stopper is pushed down in the center area, the stopper flange is elongated, during which the thickness of the flange decreases. When the flange thickness reduces about 20%–30%, the pressure from the seal is released, because normally a stopper is sealed at about 20%–30% compression strain. Therefore, crimping has little effect on the push-in force and push-in depth.

Crimping effects on push-in force and depth thresholds.
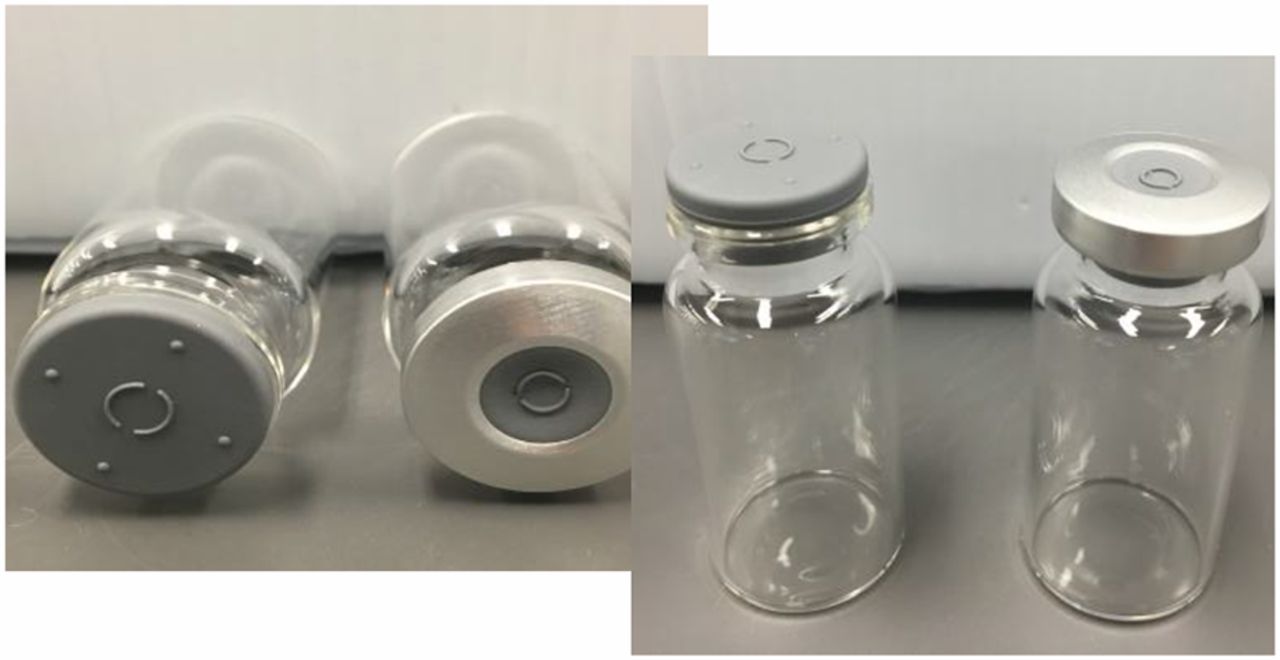
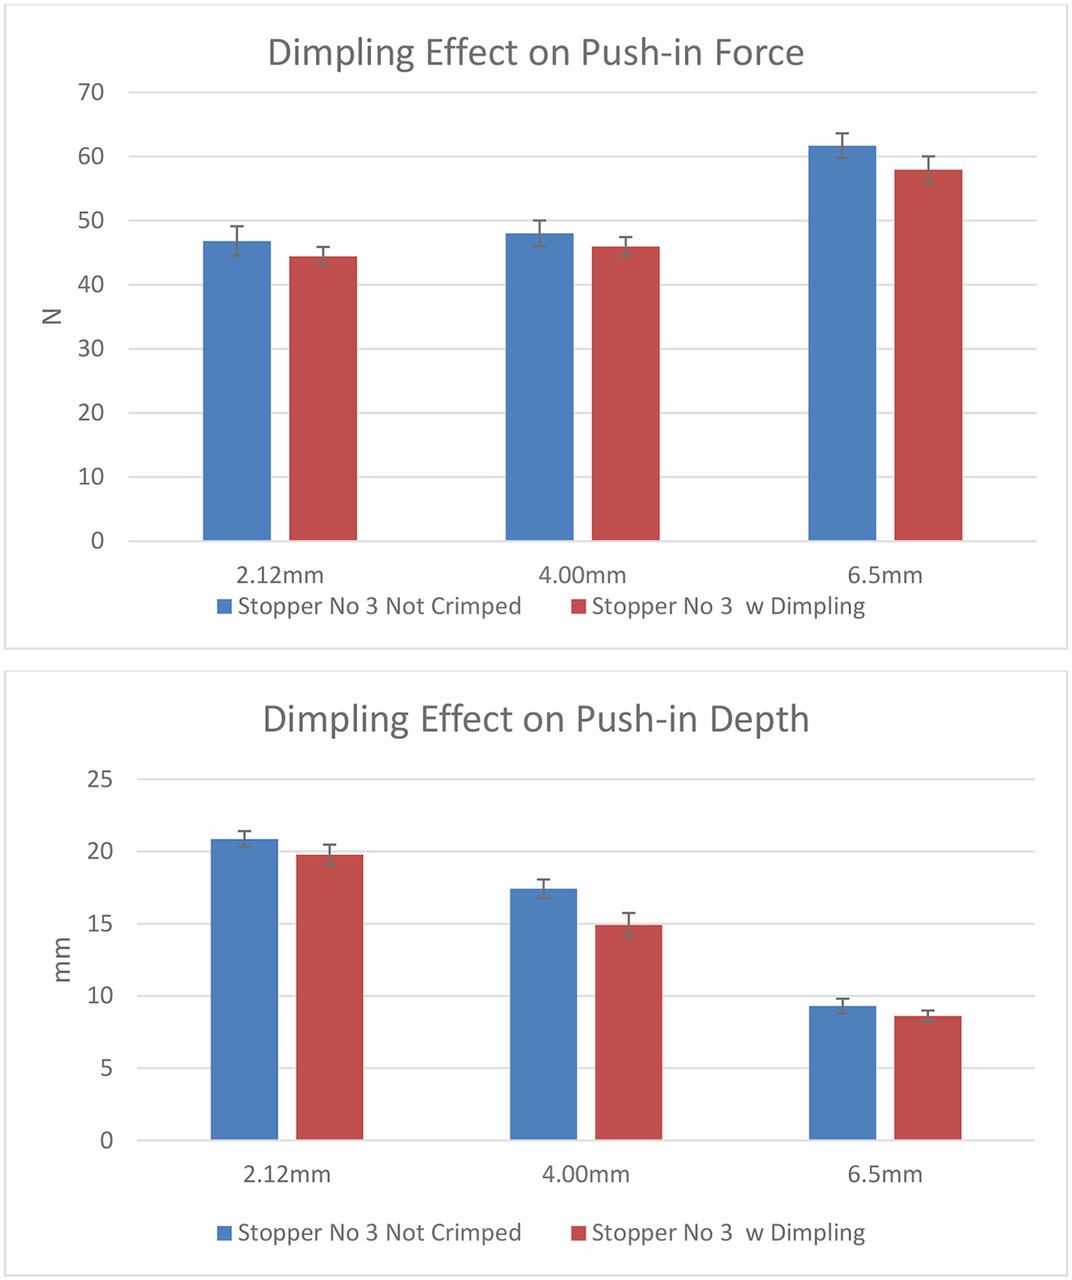
The second question is regarding the dimpling effect. Dimpling occurs only during the crimping of a soft stopper when crimping pressure is excessive. Among the six stoppers chosen for this study, stopper 3 is the only one that can generate dimpling during crimping because of its low hardness. Figure 9 shows an example of stopper dimpling after crimping. Results from the second experiment in Figure 10 indicate that dimpling reduces push-in force threshold and push-in depth marginally because the stopper flange deforms by sinking slightly into the vial neck. The flange deformation during dimpling is in the same direction with push-in deformation, although the deformation of a dimpling is marginal compared with the push-in deformation.

Photo of a crimped dimpling vial.

Dimpling effects on push-in force and depth thresholds.
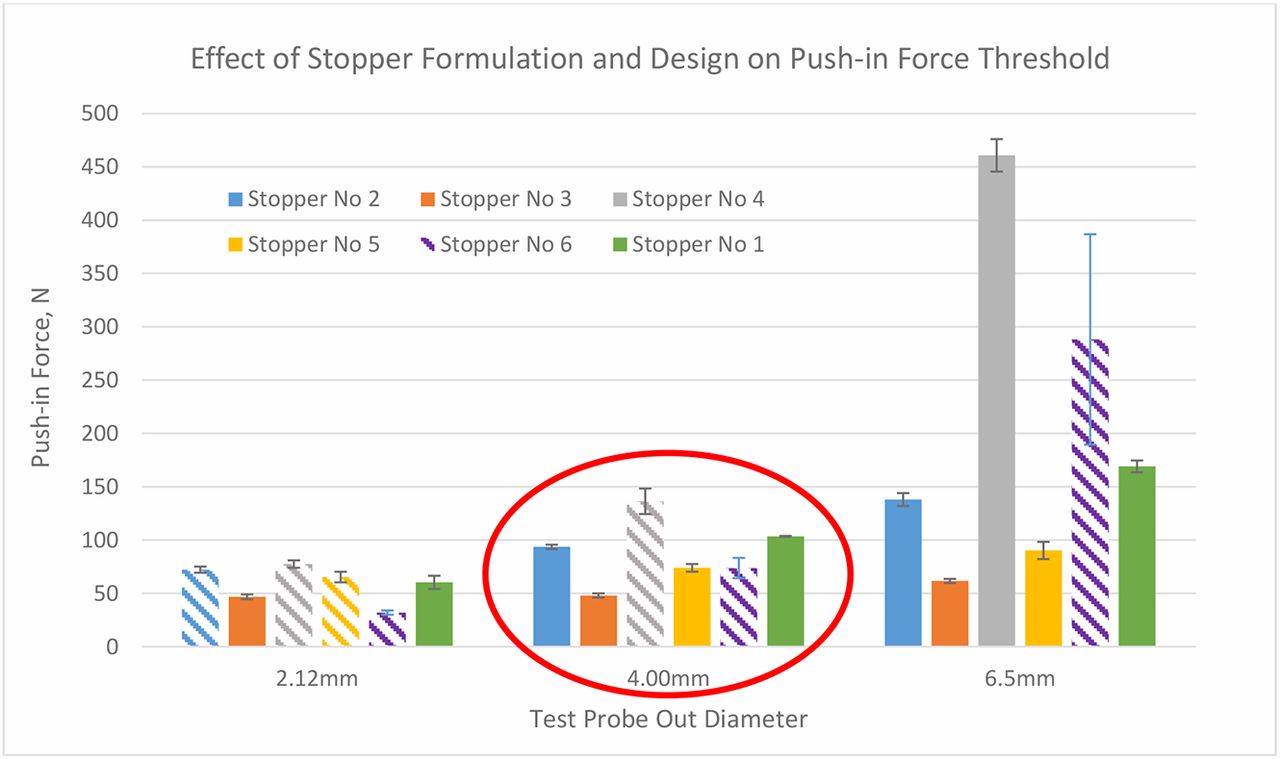
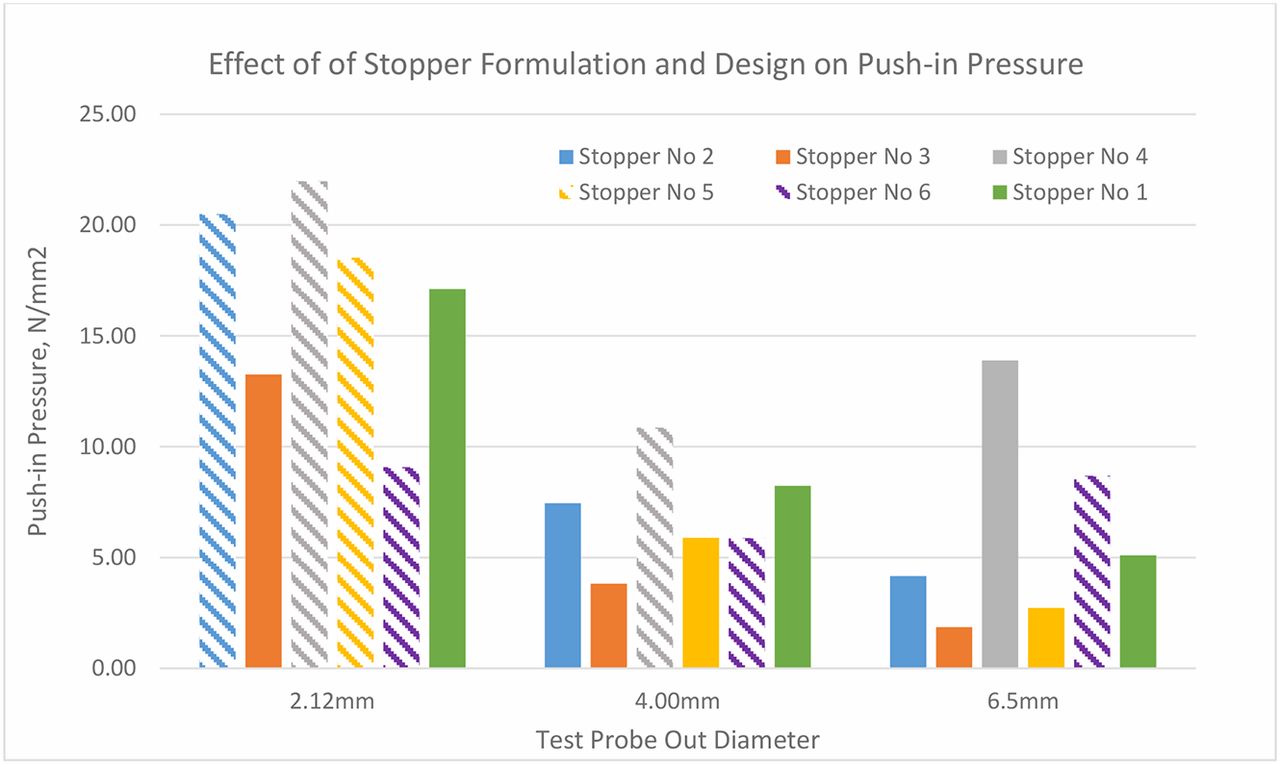
Based on the learning from the above pre-experiments, the push-in force testing was performed with uncrimped vials capped with stoppers. The results in Figure 11 show the push-in forces of the six stoppers with the test probes of three different diameters, 2.12 mm, 4.00 mm, and 6.50 mm. In this bar chart, the bars with solid color represent the real push-in force thresholds at which the stoppers are pushed into the vial. The patterned bars indicate that there are no push-in force thresholds in these cases because the metal test probes punctured the stoppers instead of pushing the stoppers in, even though the test probes have flat tips. Therefore, the values of the patterned bars are indeed puncture forces of the test probes. For example, with the test probe of 2.12 mm in diameter, four of six stoppers were punctured (stoppers 2, 3, 4, and 5). With the test probe of 4.00 mm in diameter, stoppers 4 and 6 were punctured, and with the test probe of 6.50 mm in diameter, only stopper 6 was punctured. Overall, stopper 6 cannot be pushed in with any size spike because it cannot even be pushed in by a flat-tip test probe within the spike diameter range. Thus, from a risk standpoint, stopper 6 has no risk to be pushed in by any size spike. On the other hand, stopper 3 can be pushed in by any parts with a flat top within the diameter range of 2.12–6.50 mm.

Push-in force thresholds of six stoppers with three sizes of test probes.
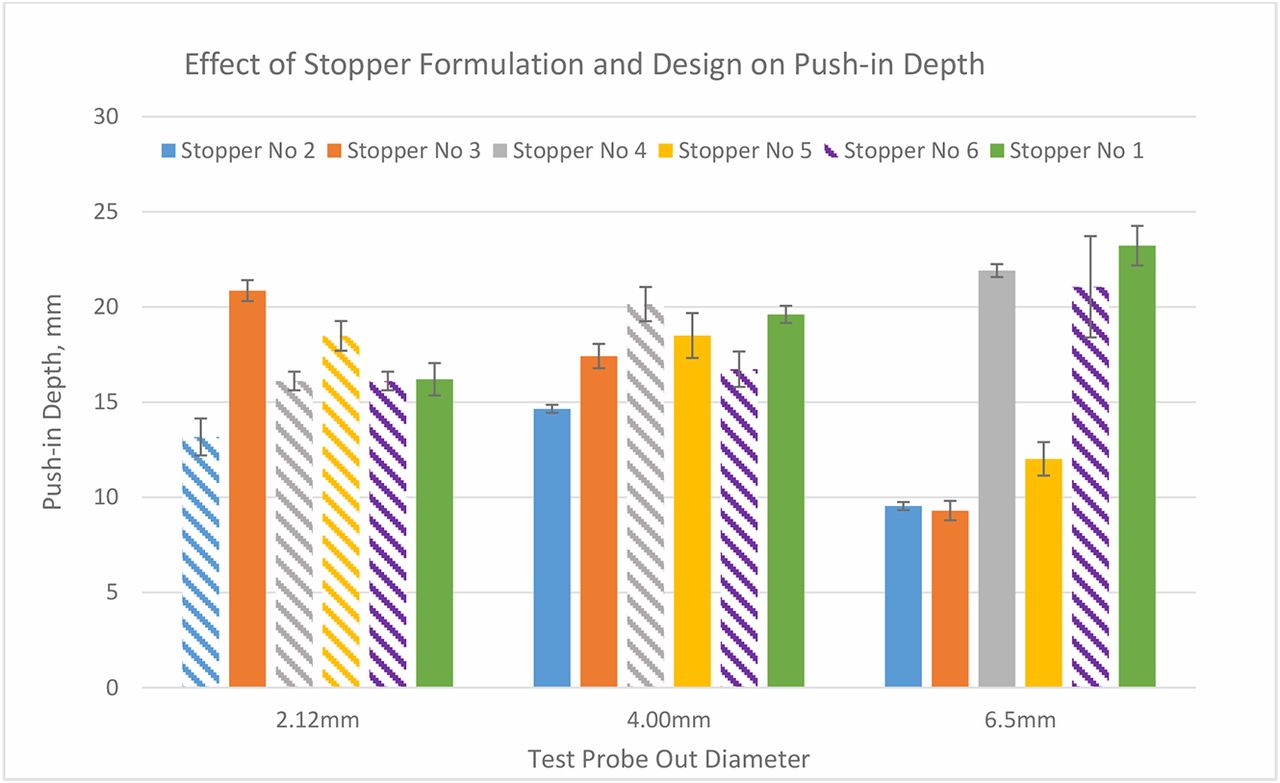
Stopper 6 is made of the same rubber formulation as stoppers 2 and 4 but with a different design. It has the thinnest diaphragm and is not laminated with film. The fact that stopper 2 has higher push-in force thresholds than stopper 3 and that stopper 4 has higher thresholds than stopper 5 indicates that the push-in force thresholds of the harder stoppers with higher moduli are higher than the softer stoppers with lower moduli. The fact that the push-in force of stopper 2 is lower than that of stopper 4 when the 6.50 mm part is used indicates that the lamination with a film makes push-in force threshold lower, although the modulus of the film is higher than the rubber. This can be explained by the push-in depth results in Figure 12, which shows that the push-in depth of laminated stoppers reduces because the plastic film makes the stopper less stretchable/elongatable. The reduction of push-in depth by film lamination is more substantial when the spike is larger. The results in Figure 11 show that formulation also impacts push-in depth by comparing stoppers 4 and 5 when a 6.50 mm part is used. With the increased diameter of the test probe, it depends on the formulation and design whether the push-in depth increases or decreases. The push-in depth decreases with the increase of test probe diameter for film laminated stoppers 2 and 3, but unlaminated stoppers 1 and 5 show opposite trends. The results in Figure 10 also show that the bigger the part diameter, the higher the push-in force.

Push-in depth thresholds of six stoppers with three sizes of test probes.
Why, then, can a smaller part puncture more stoppers than a larger part at much lower forces? This can be explained by push-in pressure taken on the area of the stopper under the tip of the part. Indeed, force is not the determining factor of stopper penetration. Rather, it is the pressure on the stopper area under the tip of the pushing part that determines the stopper puncture. Figure 13 shows that the pressure under a small part is much higher than that under a large part.

Push-in pressure thresholds of six stoppers with three sizes of test probes.
To summarize, the results to test push-in thresholds show that factors affecting push-in force are spike diameter, stopper material such as hardness/or moduli, and stopper design. The larger the spike diameter, the higher the push-in force. The harder the stopper material or the higher the moduli, the higher the push-in force. The thinner the diaphragm of a stopper, the lower the push-in force. If the stopper diaphragm is thin enough, all spikes within the ISO range will puncture the stopper instead of pushing it in, although the spike must be placed correctly in the center of the stopper. Film lamination makes the push-in force threshold lower. The factors that impact push-in depth threshold are spike size, stopper properties such as elasticity, and stopper design such as diaphragm thickness and film lamination. Film lamination lowers push-in depth threshold because of the reduction of elasticity. It is also discovered that if the spike is shorter than the push-in depth threshold of a stopper, the stopper will not be pushed in. Therefore, spike length can be optimized to mitigate stopper push-in risk. From a design perspective, the result is that a stopper with a thin diaphragm and a spike with a shorter length comprise the best combination to produce the lowest risk of stopper push-in.
The vented vial adapter spikes obtained for this study have a cross-section size close to 4.00 mm. Therefore, push-in force thresholds and depths at 4.00 mm will be used as references for the corresponding stoppers to compare with puncture force to provide examples to quantify the risk.
Step 2. Determine Spike Puncture Force:
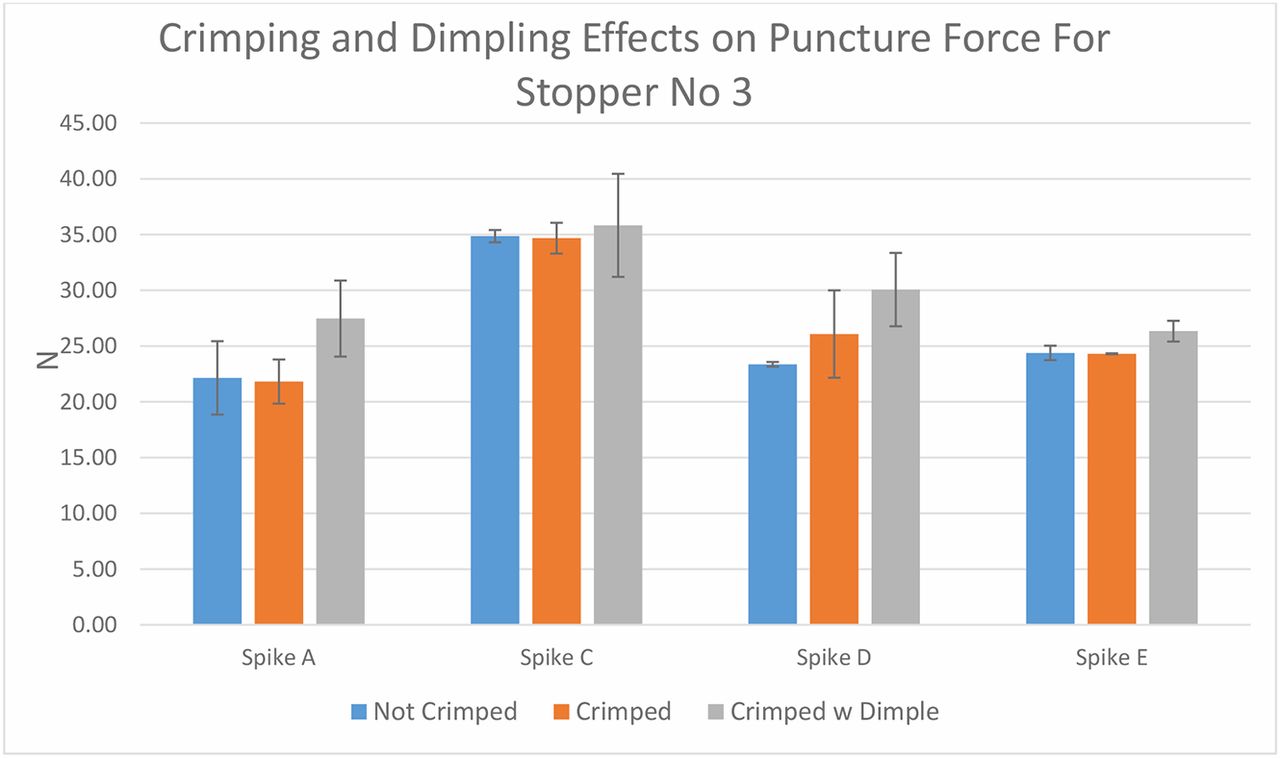
The second step is to compare various spikes' puncture forces on the six different rubber stoppers. As in Step 1, sample preparation for the puncture force test should be determined first. Stopper 3 was selected because it is the only one that is soft enough to create dimpling during crimping. Spikes A, C, D, and E were used. The results in Figure 14 show that crimping without dimpling has a minor impact on puncture force, while crimping with dimpling increases the puncture force in general because the diaphragm thickness increases when dimpling occurs. The puncture test was performed under crimping conditions.

Crimping and dimpling effects on puncture force for stopper 3.
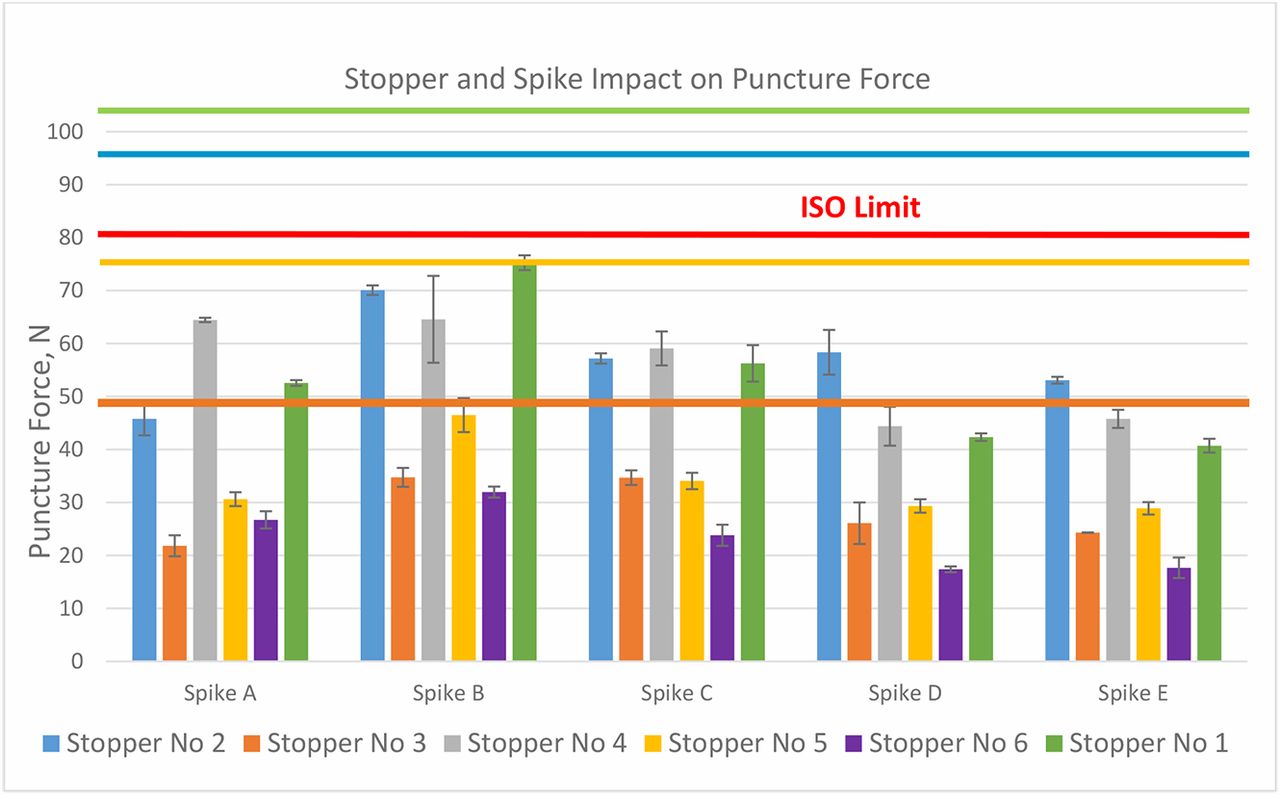
Wings on the spikes were either taken apart or kept open so that they did not interfere with the testing. The puncture force is defined as the force at which the spike punctures the stopper. No stopper push-in incident occurred during the test. The puncture force results are shown in Figure 15. For the same stopper, different spikes provide different puncture forces. Overall, the puncture forces are in the order of spike B > spike A ≈ spike C > spike D ≈ spike E for most stoppers with several exceptions. Although we cannot measure spike sharpness, it is obvious that the spike tip design is a major contributor. From left to right, spikes are in the order from the smallest to the largest. It appears that the spike size does not affect the puncture force because even though spikes D and E are the largest in size, they need the lowest forces to puncture the same stoppers in all cases. The puncture force varies significantly with stopper formulation and design. The harder the stopper, or the higher the rubber modulus, the higher the puncture force. The thinner the stopper diaphragm, the lower the puncture force. Stopper 6 has the thinnest diaphragm thickness and it requires the lowest puncture forces for all spikes. The most interesting factor is the effect of film lamination, because it varies with spikes. Comparing stoppers 2 and 4, stopper 4 requires lower puncture force than stopper 2 when used with spike A, while it requires higher puncture force than stopper 2 when used with spikes D and E, and the two have statistically comparable puncture force for spikes B and C. The puncture force should also be affected by the rubber puncture resistance. The red line in Figure 14 represents the ISO limit for puncture force 80 N. The puncture forces of certain combinations of stoppers and spikes are close to the limit. For example, the puncture force of stopper 1 with spike B is 74 N. The puncture force was measured after taking the wings off spike B. The assembly force is anticipated to be higher with the wings on. However, in this investigation, the target was to assess the risk of stopper push-in rather than the force itself. The other four colorful lines in Figure 14 represent the push-in force thresholds obtained from Figure 10 in the red circle. Because the sizes of the spikes are close to the 4.00 mm test probe, push-in force limits with the 4.00 mm part are used as references, although ideally, a test probe should be made for each spike. Only four of six stoppers are punctured with the 4.00 mm parts. The colors of the lines correspond to the same color of the bar. Each color represents a stopper. The risk of a stopper push-in by a spike is assessed by the difference between the stopper's push-in force threshold and the spike puncture force. Although the combination of stopper 1 and spike B was the combination that drew inquiries of issues with stopper push-in, the assessment of forces did not indicate that it had a higher risk of push-in than the other three stoppers (stoppers 2, 3, and 5). Stopper 6 has no risk to be pushed in if the spike is applied correctly.

Stopper and spike impact on puncture force.
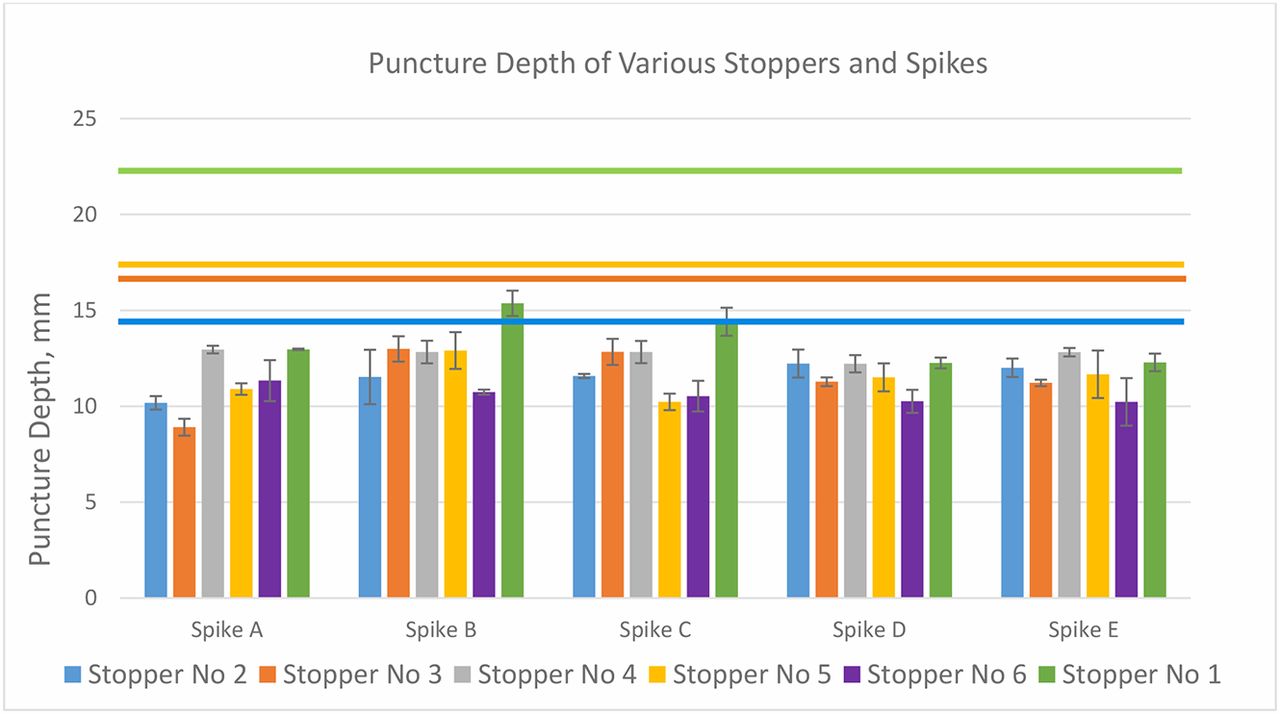
Figure 16 shows the puncture depth, which is the spike travel distance down to the vial neck when it punctures the stopper. This distance is also the stopper deformation at the point of being punctured. Upon its complete puncture, the stopper retracts. The puncture depth should be another factor in risk assessment by comparing it with the push-in depth, at which deformation the stopper snaps into the vial neck. The colorful horizontal lines represent the push-in depth of the stoppers with the corresponding colors. All puncture depths are lower than their corresponding push-in depths. For example, for the original stopper/spike combination of concern consisting of stopper 1 and spike B, although this puncture depth is the highest among all, it is still 7–8 mm away from stopper push-in. Therefore, from a stopper deformation standpoint, the risk of stopper push-in is also very low. Although the assessment on puncture depth and push-in depth shows low risk of stopper push-in for the stopper and spikes in this study, the quantitative assessment methodology can be used in performance evaluation to predict potential risk. Also, this quantitative value can help the spike designer optimize future spike design.

Puncture depth of six stoppers with five spikes.
Step 3. Quantification of the Stopper Push-in Risk:
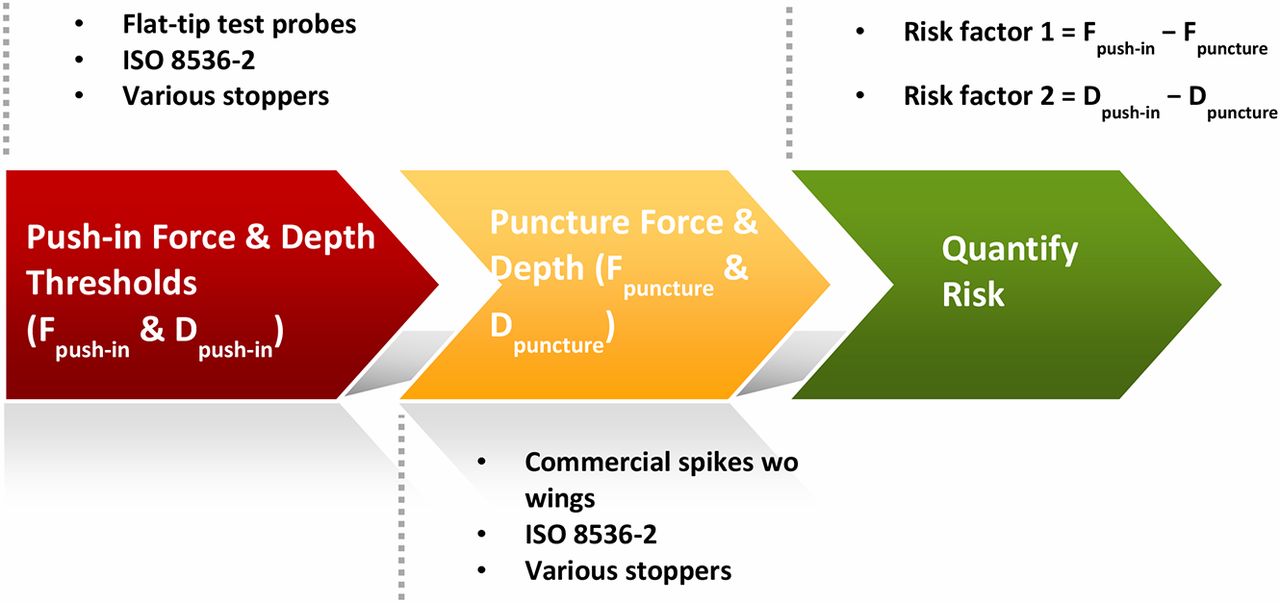
It is recommended to assess stopper push-in risk with the following two quantitative factors:
Risk factor 1 = Fpush-in − Fpuncture
Risk factor 2 = Dpush-in − Dpuncture
Fpush-in: stopper push-in force determined by a test probe with the dimension as close to the spike as possible but without the sharp tip.
Fpuncture: puncture force measured by spike penetration without wings.
Dpush-in: stopper push-in depth determined by a test probe with the dimension as close to the spike as possible but without the sharp tip.
Dpuncture: puncture depth measured by spike penetration without wings.
Figures 14 and 15 have illustrated the two risk factors by comparing the push-in forces and depth thresholds and the puncture forces and depths that correspond to the same stopper, respectively. The explanation has been covered in the discussion of step 2.
Verification of the Risk-Assessment Process
A quantitative three-step process has been developed and used to assess the stopper push-in risk at the device-to-vial interface. The three-step risk assessment process developed in this investigation suggests that 20 mm stoppers paired with the various spikes used in this study present a low risk of push-in from the device-to-vial interface. To validate the process, a 13 mm fluoropolymer laminated stopper was used (Figure 17).

Step 1.
A 4 mm flat-tip test probe was used to measure the push-in force and depth thresholds, because the outer diameter of the three spikes are 3.03–3.85 mm for spike C, 4.07–4.09 mm for spike D, and 3.87–3.96 mm for spike F. The thresholds are:
Fpush-in = 89.17 ± 3.19 N
Dpush-in = 9.45 ± 0.21 mm
Step 2.
Spikes C, D, and F were used to puncture the stopper. Ten samples were tested. Table III shows the puncture testing results. Spikes C and D did not push the stopper in, while spike D was observed to be almost pushed-in before being completely punctured. Spike F pushed the 13 mm stopper into the vial with the first sample.
13 mm Stopper Puncture Testing Results
Step 3.
Calculated risk factors for spikes C and D are shown in Table IV.
13 mm Stopper Push-in Risk Assessment
For spike C, risk factor 1 is 24.21 ± 4.26 N, which shows low risk because it will not fail within 8 sigma. However, if the puncture depth exceeds the push-in depth threshold by 3.03 ± 0.48 mm, the risk factor 2 is negative. Why was the stopper not pushed into the vial if the puncture depth was higher than the push-in depth? This is because the puncture depth is the distance that the spike tip has traveled at the moment when the largest outer diameter of the spike completely punctures the stopper, rather than the stopper deformation depth. The stopper deformation depth should be lower, because as soon as the spike tip punctures the stopper, the stopper starts to retract and no longer travels with the tip of the spike. Therefore, risk factor 2 (the depth difference) cannot be the sole factor to predict the risk. With low risk of risk factor 1 and high risk of risk factor 2, spike C is ranked to have medium risk of stopper push-in. On the other hand, for spike D, risk factor 1 is 14.10 ± 5.12 mm, which indicated that the confidence level is less than 99.7%. This should be considered as high risk. In addition, its risk factor 2 is also negative. Thus, it is considered to have high risk of push-in. The validation of the three-step risk-assessment process of stopper push-in is proved to be a viable process to assess stopper push-in risk at the device-to-vial interface.
Potential Root Causes of 20 mm Stopper Push-In
The three-step quantitative risk-assessment process developed in this investigation shows that 20 mm stoppers paired with the various spikes used in this study present a low risk of push-in from the device-to-vial interface. The risk is determined to be low, but push-in incidents still occurred, even with one stopper–spike combination in this study. What other factors could cause the issue? By going back to the cause analysis, we can see that a wide range of scenarios at the device-to-vial interface have been covered and proved not to be root causes. However, other actions, especially those at the user-to-device interface, remain as potential root causes. The following updated root cause analysis diagram for the 20 mm stopper push-in shows the remaining factors that are not covered in this study. For example, the spike must be pointed at, and hit, the center of the diaphragm area correctly. Missing the center of the stopper may cause the use of higher force on the off-center spot, and this can result in bending the spike (Figure 18).

Another possible cause of the push-in issue is that the healthcare worker may have tilted the spike during the insertion, resulting in the spike hitting the plug portion of the stopper. This can result in excessive force, bending of the spike tip, and pushing-in of the stopper. Thus, the issue of pushing in the stopper, rather than puncturing it, may result (at least in part) from human error in the form of trying to puncture off center and/or at the incorrect angle to the stopper surface.
Healthcare workers inquired about spikes bending. The potential for a spike to bend is of course higher for spikes with smaller diameters, generally around 2.0–3.0 mm. These smaller diameter spikes typically include wings that are designed to aid the user in proper vial attachment/placement. The wings help guide the spike, resulting in a centered penetration through the stopper diaphragm. When used correctly, the risk of spike bending is greatly mitigated; however, if used incorrectly, such as with off-centered spike penetration, a bent or damaged spike could occur. We could not obtain the actual chemo spikes and stoppers about which our customer raised a concern because they were used with hazardous drugs and so could not be handled and shipped. However, our study demonstrates that, because the original stopper/spike combination of concern involves spikes that are smaller in diameter (non-vented) and short, if used correctly, they can puncture the stopper but cannot deform the stopper to the point where the stopper is pushed into the vial. Although it appears that human error, rather than design problems, caused bent spikes, the cause of the inquiries is instructive. If the spike is small, and misses the center mark, it cannot puncture the stopper but can bend, and the bent spike can push the stopper. However, if the spike is large, as shown in Figure 5, and misses the area, resistance may make the healthcare practitioners push with excessive force, and this excessive force may enable a larger spike to push the stopper into the vial. Thus, there is a need for the correct spike, one with optimized design and dimensions; the correct stopper, one that will not unduly resist the small spike; and the correct use of the equipment. Using the right combination of spike and stopper, and puncturing the stopper in the right area, can reasonably be expected to puncture the stopper without the problem of pushing in the stopper. Based on this study, examples of acceptable combinations of spike and stopper are spikes A, D, and E and stoppers 3, 5, and 6.
Conclusion
This case study suggests that to mitigate the risk of stopper push-in at the device-to-vial interface, a three-step risk-assessment process should be applied as shown in Figure 19.

The stopper push-in incidents should not occur during spiking for any combination of the 20 mm stoppers, as well as those spikes included in this investigation, provided the spikes target the center of the stoppers correctly. However, if the spike does not hit the right area, and spike entry is difficult, the difficulty may generate a high puncture force that may indirectly contribute to pushing in the stopper.
Both stopper (material and design) and spike (dimension and design) determine the stopper push-in and puncture forces. Spike length could especially impact push-in; if the total spike length is shorter than the push-in depth limit, the stopper would not be pushed in.
It takes industry effort to fill the device-to-vial gap and mitigate the risk for hazardous drug exposure while transferring drugs out of vials:
Industry standards groups to set new standards for the proper vial spike designs and applications.
Stopper manufacturers to optimize stopper materials and designs to spikes and prove performance.
Spike manufacturers to optimize spike design and dimension to be compatible to stoppers and prove performance.
Pharmaceutical manufacturers to select the optimized vial stoppers.
Device manufacturers to select or design the optimized spikes.
Hospitals to put together a process to purchase an optimized spike system and provide adequate training on the proper practice.
The risk-assessment methodology developed in this case study applies to only the stopper–spike compatibility at the device-to-vial interface with the correct use of the spike. It is ultimately important that healthcare workers use the proper procedures to avoid misuse. If spikes are used incorrectly, such as by pushing the wrong area on the stopper surface, stoppers can be pushed into the vials no matter what stoppers and spikes are used.
Declaration
Because studies in this area are still relatively new, the conclusions drawn from the six stoppers included in this study may not be applicable to other stoppers from other manufacturers or of different designs. We do not recommended extrapolating the conclusions/trends from this study to predict risks associated with other types of stoppers without additional validation.
Conflict of Interest Declaration
The authors declare that they have no competing interests.
Acknowledgment
The authors wish to thank Kevin Gribowicz for his support on test probes development and procurement. The authors wish to thank Louis Brasten from West Analytical Lab for providing photos of the inquired spikes and stoppers. The authors also wish to sincerely thank Naresh Budhavaram and Lei Li from Eli Lilly and Yongming Liu from Shire for the significant amount of reviewing efforts and high-quality and constructive comments and suggestions.
- © PDA, Inc. 2019


