
Abstract
While no recognized industry standard currently exists for mycoplasma clearance testing of membrane filters, several methods have been used by membrane manufacturers and contract test laboratories. This validation exercise documents one approach to mycoplasma clearance testing and incorporates validation guidelines recognized in the biopharmaceutical industry today. The benefits of this method are (1) the consistent production of small monodisperse cells, 0.37 × 0.41 μm, at titers in excess of 1 × 10⁹ CFU mL−1 within 20–24 h of incubation; (2) the consistent detection of low levels of Acholeplasma laidlawii with an absence of false negative results; and (3) the ability to distinguish among membrane filters with different bubble points.
The results of the validation exercise demonstrate that the equipment, materials, and test methods of the A. laidlawii filter challenge test are suitably understood and in a state of control. This method is appropriate to characterize the performance of membrane filters used in biopharmaceutical applications.
- Acholeplasma laidlawii
- Mycoplasma
- Mollicutes
- Mycoplasma clearance
- Bacterial challenge test
- Method validation
- Membrane filtration
Introduction
Biopharmaceutical manufacturers continually seek to increase the effectiveness and efficiency of their processes for recombinant protein production and purification. Careful preparation of cell culture media is of vital importance to ensure sterility of the cell culture batch and subsequent purification processing. Mycoplasma contamination would result in dire consequences in this type of process.
Mycoplasma is the trivial name associated with a class of bacteria called Mollicutes. There are more than 120 species in six genera (1). Two of the genera most relevant to biopharmaceutical processes are Mycoplasma and Acholeplasma. Mollicutes are cell wall-deficient bacteria recognized to represent many of the smallest bacteria thriving in cell cultures. While many species are considered slow-growing and fastidious in their nutritional requirements, Acholeplasma laidlawii is one mollicute that can be cultivated to high titers within 24 h in serum-free media (2).
Users often select 0.2-μm-rated membrane filters for liquid additions into their bioreactor processes in the belief that serum-free media, supplements, or other additives are not at risk of mollicute contamination. This is not necessarily the case. A. laidlawii was isolated from soybean casein digest broth and a serum-free cell culture medium that had been processed through 0.2-μm sterilizing-grade filters (3, 4). Consequently, the 0.2-μm sterilizing-grade filters used for liquid applications in many bioreactor processes are being replaced with 0.1-μm sterilizing-grade filters to minimize the risk of mycoplasma contamination. Moreover, USP 〈1211〉 “Sterilization and Sterility Assurance of Compendial Articles” recommends that filter membranes with a low nominal rating (less than 0.22 μm) be tested with a culture of A. laidlawii or other mollicutes (5).
When a membrane filter is selected for biopharmaceutical production, many parameters are assessed, such as flow rate, capacity, extractables, leachables, adsorption, and bacterial removal (6–8). Bacterial challenge tests are used to assess the behavior of microporous membrane filters. Filter manufacturers use this type of test during membrane and device development for performance characterization. Bacterial challenge tests can be used for lot release tests in manufacturing to verify that a membrane or device continues to perform to validated parameters. Filter users conduct bacterial challenge tests during filter validation to verify that a membrane will function appropriately when it is in contact with their process fluid under their processing conditions (6–8).
A bacterial challenge system consists of both microbiological (cultivation and recovery) elements as well as physical (test apparatus, pressure, flow rate, duration) elements. It also consists of preparatory, test execution, and recovery operations over multiple days. Each element can be examined for suitability in a validation exercise based upon function.
While PDA Technical Report 26 provides comprehensive guidance on bacterial challenge testing, currently there are no published standards for comparative evaluation of 0.1-μm-rated filters for mycoplasma clearance (8). Several laboratories have published studies using A. laidlawii ATCC 23206 (9–14) or small waterborne Gram-negative bacteria such as Hydrogenophaga or Burkholderia species (15, 16). A. laidlawii is relevant to biopharmaceutical applications due to its common contaminant status, smaller size, and difficulty to detect in culture (17). Another advantage to using A. laidlawii, as compared to other mollicutes, is that A. laidlawii can reach workable titers within a 24-h period in a variety of different serum-containing or serum-free growth media in both ambient and CO2-enriched environments.
While employing the same strain of A. laidlawii, most labs have developed unique methods for cultivating A. laidlawii and for performing their respective clearance tests. Unfortunately, some of these published methods do not provide sufficient detail about the media and methods used to make meaningful performance comparisons (10–14). Furthermore, there is no evidence in the literature of the validation of mollicute clearance methods themselves.
A paper by Bates et al. presented an approach to cultivation and recovery of A. laidlawii for bacterial challenge tests relevant to a biopharmaceutical process (2). This method was developed in our laboratory. The objective of this article is to describe the validation exercise conducted to confirm suitability of the A. laidlawii cultivation and recovery method for bacterial challenge tests. Validation of this mycoplasma clearance test would provide an improved level of assurance and a reliable framework for evaluation of 0.1-μm membranes.
Since there is no standard challenge test method, as discussed previously, several elements for conducting the A. laidlawii test were based upon the ASTM International method for the Brevundimonas (formerly Pseudomonas) diminuta challenge test for sterilizing-grade membranes; these include test pressure, challenge concentration, and recovery of test filtrate using the membrane filtration (MF) method (18). The validation acceptance criteria for the A. laidlawii test were based upon pre-validation development work as well as industry practices (19–21).
Prior to validation, several scoping evaluations were performed to define key parameters of the test method. The mycoplasma clearance test was separated into several activities: equipment preparation and sterilization, A. laidlawii cultivation, filter challenge execution, and recovery assay. Refer to Figure 1. The filter challenge test system was evaluated for pressure drop across the manifold. Because the test manifold can test 10 samples simultaneously, it was important to determine whether or not valve sequencing (opening all valves simultaneously or sequentially) had an effect on test results. Test sample preparation such as the effect of force applied to membrane samples in finger-tightened or fully torqued filter holders prior to sterilization was also examined. The development of the serum-free cultivation broth, recovery agar, and assay were documented in a study by Bates et al. (2). Additional factors examined during test method development were the hold time for the culture after harvest but prior to resuspension, the hold time for the challenge suspension before the challenge test, and the hold time for the test filtrate prior to the assay. Once the test method and the validation protocol were developed (and approved), the validation exercise was performed.

Acholeplasma laidlawii bacterial challenge test: method validation elements.
Validation of the A. laidlawii bacterial challenge test focused upon critical method parameters that were defined and characterized during method development. This multi-variable approach was designed to document the interactions of the key method conditions such as pressure, medium pH, cell concentration, and different labs and analysts. Ensuring adequate recovery of A. laidlawii cells was also an important criterion of the method validation. Filters used for recovery (0.22-μm polyvinylidene fluoride, PVDF) of A. laidlawii cells from large volumes of effluent were tested for accuracy, precision, linearity, range, and limit of quantitation in comparison to traditional A. laidlawii recovery methods.
Materials and Methods
Culture Media
Glucose Hydrolysate Broth (GHB) Medium:
GHB was compounded from a basal medium, a sterile supplement, and fatty acid supplements. The GHB basal medium consisted of 4% w/v polypeptone (Becton Dickson 211910) in ASTM Type I water. The GHB basal medium was sterilized by autoclaving in a validated, slow-exhaust cycle at a minimum of 121.1 °C for 20 min of exposure time. The GHB sterile supplement consisted of 0.5% w/v Trizma base (2-Amino-2-(hydroxymethyl)-1,3-propanediol, Sigma Aldrich T6791), 0.78% glucose (Sigma Aldrich Fluka 49158), 0.4% bovine serum albumin (BSA) (Sigma Aldrich A6003) in Type 1 water. The GHB sterile supplement was filter-sterilized through 0.2-μm polyethersulfone membrane filters (Millipore SCGPU02RE). These components were stored separately at 4 ± 1 °C until required.
Oleic (Sigma-Aldrich O1008-5G) and palmitic acids (Sigma-Aldrich P0500-1) were prepared in 100% ethanol (Acros 61509-0020) to achieve a concentration of 10 mg mL−1 each. Fatty acid solutions were filter-sterilized through 0.2-μm PVDF membrane filters (Millipore SCGVU02RE) then stored at −20 ± 1 °C until required.
For the GHB broth preparation all components were brought to ambient temperature. GHB sterile supplement was aseptically added to GHB basal medium. Oleic acid and palmitic acid were aseptically added to deliver a final concentration of 0.002% w/v each. Next, the final broth formulation was dispensed in 25-mL aliquots into sterile, 250-mL polystyrene tissue culture flasks.
Glucose Mycoplasma Agar (GMA):
GMA was compounded from a basal medium, a sterile supplement, an agar base, and fatty acid supplements. GMA basal medium consisted of 2% w/v mycoplasma broth base (Becton Dickinson 211458), 0.5% w/v Trizma base, and ASTM Type 1 water. The agar base was prepared by resuspending 1.2 % (w/v) agar, (Oxoid LP0013) in Type 1 water. GMA basal medium and the agar base were autoclaved separately in a validated, slow-exhaust autoclave cycle at a minimum of 121.1 °C for 20 min of exposure time. The GMA sterile supplement consisted of 0.78% w/v glucose and 0.4% w/v BSA in Type 1 water, filter-sterilized through a 0.2-μm polyethersulfone membrane filter (Millipore SCGPU02RE). The GMA basal medium, the agar base, and the GMA sterile supplement were stored separately at 4 °C until required.
Just prior to use, the agar base was melted and brought to a temperature of 57–60 °C. The GMA basal medium and GMA sterile supplement were brought to a temperature of 37–40 °C and aseptically combined with the agar base to arrive at a dispensing temperature of 43–45 °C. Oleic acid and palmitic acid, prepared as described above under the heading Glucose Hydrolysate Broth Medium, were aseptically added to deliver a final concentration of 0.002% w/v each. The final agar formulation was dispensed into 60-mm sterile polystyrene Petri dishes for use in the MF method or held at the dispensing temperature for use in pour-plating.
Diluent and Resuspension Buffer:
To make the mycoplasma phosphate buffer, sodium phosphate monobasic, NaH2PO4, (Sigma S0751) 28 mM, and sodium phosphate dibasic, Na2HPO4 (Sigma S0876), 72 mM were dissolved in Type 1 water and adjusted to pH 7.1 ± 0.2. The buffer was sterilized by autoclaving in a validated, slow-exhaust cycle at a minimum of 121.1 °C.
Bacterial Strains and Stocks
A. laidlawii, ATCC 23206, was obtained as a lyophilized culture from the American Type Culture Collection (Manassas, VA). The lyophilized culture was reconstituted in 7 mL of GHB broth. The primary culture was incubated at 37 ± 2 °C, with 6 ± 1% CO2 in air for 22 ± 2 h. Post-incubation, 5 mL of primary culture was inoculated into a 250-mL flask containing 100 mL of GHB broth. This secondary culture was incubated at 37 ± 2 °C, with 6 ± 1% CO2 for 22 ± 2 h. Post-incubation, the secondary culture was mixed 1:1 with a 30% (v/v) glycerol solution to achieve a 15% (v/v) glycerol final concentration. The stock suspension was dispensed into cryovials in 1-mL aliquots and frozen to −70 °C in 6 h. Storage was at −70 ± 1 °C. No further stock passaging was permitted. Once a supply of frozen stock was exhausted, a new set of stocks was prepared from a new lyophilized ATCC vial.
Broth Cultivation
An A. laidlawii frozen stock vial was rapidly thawed in a heating block set at 44 °C for 4 ± 1 min. Next, thawed stock was transferred to GHB broth to achieve a final concentration of 4% (v/v) inoculum to broth. Cultures were incubated at 37 ± 2 °C, with 6 ± 1% CO2 for 22 ± 2 h unless otherwise specified. Uninoculated GHB was included as a negative control during each experiment.
Enumeration by Plate Count
Serial dilutions of the A. laidlawii culture were prepared in mycoplasma phosphate buffer and assayed by the pour-plate method using GMA as the growth agar medium. Samples were analyzed in triplicate per dilution: 100-μL aliquots of bacterial suspension were dispensed into sterile 100-mm Petri dishes followed by molten agar with a temperature of 44 ± 1 °C. Plates were swirled to mix then allowed to solidify prior to incubation at 37 ± 2 °C, with 6 ± 1% CO2 for 96 to 144 h. Post-incubation plates were enumerated under 20–40× magnification. Colonies were white and easily distinguishable from the agar matrix. For this reason, Dienes stain was not employed for pour plates in this study, though it was permissible to employ the stain.
Collection and Enumeration by Membrane Filtration (MF) Method
The MF method was used for the large-volume samples with low concentrations of cells. The primary application of the MF method in this study was as the assay membrane for analysis of a challenge test filter filtrate. Samples were collected in sterile flasks, and then filtered through Durapore® 0.2-μm PVDF 47-mm discs (Millipore GVWP04700) by vacuum. Assay membranes were then transferred to GMA agar and incubated at 37 ± 2 °C, with 6 ± 1% CO2 for 96 to 144 h. Plate counts were performed in triplicate per dilution. Post-incubation MF plates were treated with Dienes stain, drained of excess stain, and then enumerated under 20–40× magnification. Dienes stain was necessary in order to visualize and accurately enumerate the white colonies on the white membrane background.
Bacterial Challenge Test
The A. laidlawii bacterial challenge test was based, in part, on industry standards and guidelines for the rating of sterilizing-grade filters by B. diminuta (6–8, 18). Briefly, 47-mm test membrane filter discs were installed in filter holders and sterilized. The test system was aseptically assembled according to Figure 2. System sterility was assessed by filtering 100 mL of sterile mycoplasma phosphate buffer through each test membrane filter at a specified differential pressure. Filtrate was processed through separate assay membranes as described in the section Collection and Enumeration by Membrane Filtration (MF) Method. Next, A. laidlawii from a 20–24-h culture in GHB was diluted into mycoplasma phosphate buffer to a minimum final target concentration of 1 × 10⁷ CFU/cm2 of membrane-effective frontal surface area. The filter holders provided an effective frontal area (EFA) of 13.8 cm2. Challenge suspensions were transferred to pressure vessels where filtered, compressed air at the pressure specified in each study delivered 100 mL through each test membrane. Each test filtrate was collected into a separate, sterile flask followed by a 100-mL sterile mycoplasma phosphate buffer flush of each test filter at the specified test pressure. The flush filtrate was collected into the same flask as the challenge filtrate.

A. laidlawii bacterial challenge test system.
The MF method was employed for enumeration of colonies in the filtrate. When the test filters were expected to be retentive or to have low-level passage (<300 colony-forming units, CFU), the entire pooled challenge/flush sample was filtered through an assay membrane (MF method). When the test filter was expected to exhibit >300 CFU, fractions of the pooled challenge/flush were filtered through separate assay membranes. Assay membranes from the system sterility verification and from the pooled challenge/flush were plated and incubated as described in the section Collection and Enumeration by Membrane Filtration (MF) Method. The bacterial challenge concentration in CFU/filter and the total passage in CFU/filter were determined, then the log reduction value (LRV) was calculated to evaluate membrane filter performance: LRV = log10(Total Challenge/Total Passage). The challenge per EFA (EFA Challenge) was calculated to ensure that the bacterial challenge met a minimum challenge concentration: EFA Challenge (CFU/cm2) = Total Challenge per filter/filter surface area.
Harvest Growth Curve
Cultures of A. laidlawii were prepared as described in the Broth Cultivation section. During incubation, samples were removed at 18, 19, 20, 21, 22, 23, and 24 h for enumeration. The culture was returned to the incubator after sample removal. Serial dilutions (1:10) of each culture were prepared in mycoplasma phosphate buffer and assayed as described in the section Enumeration by Plate Count.
Culture Titer Stability
To document that the cultivation process could produce A. laidlawii at a consistent concentration, cultures were prepared as described in the Broth Cultivation section. During incubation, samples were removed at the target 22-h harvest time point for enumeration. Serial dilutions (1:10) of each culture were prepared in mycoplasma phosphate buffer and assayed as described in the section Enumeration by Plate Count. Two different analysts performed five tests on five different days using different broth cultures for a total of 10 data sets. Different batches of GHB broth and different batches of GMA agar were assessed.
Media Shelf Life
Two separate batches of GHB broth and GMA agar were prepared. Each batch contained a different set of manufacturers’ lots of raw materials. The same two batches of the test broth and test agar media were used for the duration of this study. Basal media and supplements were prepared as described in the Culture Media section and held at the specified storage temperatures for the duration of the study. The same lot of A. laidlawii frozen stock was used throughout the study. The following assessments were performed at each time point: Time initial (T0), Day 5, Day 10, Day 15, Day 20, Day 25, Day 30, Day 35, and Day 40 (±2 days to allow for weekends).
To assess the broth, the broth components were removed from storage and combined at each time point. The pH of each lot of broth was measured. Next, two flasks of each GHB broth batch were inoculated with A. laidlawii to achieve a 4% v/v concentration as described in the Broth Cultivation section. Samples were incubated at 37 ± 2 °C with 6 ± 1% CO2 for 22 h ± 2 h, then enumerated as described in the section Enumeration by Plate Count.
To assess the agar, the agar components were removed from storage and combined at each time point. The pH of each lot of agar was measured. Next, A. laidlawii frozen stocks were thawed and directly diluted (1:10) in mycoplasma phosphate buffer then assayed using each lot of GMA agar as described in the section Enumeration by Plate Count.
Frozen Stock Shelf Life
The cell concentration of the A. laidlawii frozen stocks was monitored over time. The objective was to establish an expiration date and to establish a stocking schedule. At each time point, frozen stock samples were rapidly thawed in a heating block set at 44 °C for 4 ± 1 min. Thawed stock was serially diluted (1:10) in mycoplasma phosphate buffer and assayed as described in the section Enumeration by Plate Count.
Agar Growth Promotion
Data from multiple lots of GMA agar were trended in comparison to previous lots to determine if GMA would support consistent growth of A. laidlawii. Twenty-two-hour (±2 h) A. laidlawii cultures in GHB broth were serially diluted (1:10) in mycoplasma phosphate buffer and assayed as described in the section Enumeration by Plate Count.
Recovery Assay
The objective of this study was to document that A. laidlawii could be recovered and enumerated accurately. The assay was performed six times, with two analysts using a minimum of two different assay filter lot numbers for the membrane filter recovery portion of the assay. GHB was inoculated with A. laidlawii to achieve a 4% (v/v) concentration of the stock culture suspension and incubated at 37 ± 2 °C, with 6 ± 1% CO2 for 22 ± 2 h. Post-incubation, samples were serially diluted to a target working concentration of approximately 200 CFU/mL. The working concentration was further diluted (1:2) into mycoplasma phosphate buffer to a target concentration of ≤10 CFU/mL. One hundred-microliter (100-μL) aliquots from selected dilutions were prepared by both the pour-plate and MF methods for recovery comparison. The assay membranes were assembled in separate Sterifil® Aseptic Systems (Millipore XX1104710) consisting of filter holders and filtrate receiver flasks. Filtrate was collected downstream of each assay membrane into double-strength GHB for the presence–absence test. Refer to Figure 3.

A. laidlawii recovery assay with presence–absence verification of filtrate.
Pour-plates and MF plates were incubated at 37 ± 2 °C, with 6 ± 1% CO2 for 96 to 144 h. The Sterifil receiver flasks were incubated at 37 ± 2 °C) with 6 ± 1% CO2 for 168 h. Post-incubation MF plates were treated with Dienes stain and drained of excess stain. Pour plates and MF plates were enumerated under 20–40× magnification. Recovery flasks were scored for the presence or absence of A. laidlawii as evidenced by turbidity when compared to positive and negative controls. Turbidity was assessed by microscopic examination and colony morphology on agar.
Cell Size
Cell size was evaluated using field emission scanning electron microscopy (FESEM). Cultures of A. laidlawii were prepared as described in the Broth Cultivation section. Aliquots of A. laidlawii culture were harvested after 22 h and filtered through Durapore 0.1-μm PVDF membranes (Millipore SJ1J166102) by vacuum. Samples were fixed by sequential immersion in fixatives as follows: 1 h in 5% (v/v) glutaraldehyde solution (Electron Microscopy Sciences 16320) in mycoplasma phosphate buffer; 30 min in 1% (w/v) sucrose solution (Fisher FL-03-0297) in ASTM Type I water; 30 min in 2% (v/v) osmium tetroxide solution (Electron Microscopy Sciences 20186-12-0) in mycoplasma phosphate buffer. Samples were rinsed three times in mycoplasma phosphate buffer, 5 min each. Sample dehydration was performed in ethanol (Fisher Acros AC61509-0020) at the following concentrations: 15, 25, 35, 45, 55, 65, 75, 85, and 95% (v/v) in Type I water. Dehydration was initiated by transferring samples for 5 min into each ethanol solution starting at 15% and continuing through 95%. Samples were then transferred into three separate anhydrous ethanol steps for 5 min each. The samples were exchanged in hexamethyldisilazane (Electron Microscopy Sciences 16700) and air-dried at room temperature for 5 min. Samples were mounted on an aluminum stub with conductive carbon tape, sputter-coated with approximately 4 nm of gold/palladium, and imaged in high-vacuum mode with a Quanta™ 200F field emission scanning microscope (FEI Company). Cells were sized by length and width using Image Pro® Plus version 6.0 software and analyzed using Minitab version 14.02 software.
Challenge Suspension Aggregation Challenge Test
This study was performed to document that the A. laidlawii challenge test can discriminate among membranes with different bubble points. The challenge tests were performed over 2 days using two analyst teams and different A. laidlawii cultures. Two membrane polymers with different 100% isopropanol bubble points were examined: PVDF (159-kilopascal (kPa) bubble point) and polyethersulfone PES (296-kPa and 345-kPa bubble points). Testing was performed as described in the Bacterial Challenge Test section at a standard EFA challenge target of 2 to 3 × 10⁷ CFU/cm2 using a test pressure of 207 kPa.
Challenge Test Robustness
A full-factorial experimental design examined the effect of slight changes in pH of GHB broth and mycoplasma phosphate buffer on LRV. The challenge concentration and pressure targets were set at the high end of the acceptable test range previously determined during protocol development. PES membranes at three different bubble point targets were selected to trend LRV. Testing was performed as described in the Bacterial Challenge Test section. The pH levels for GHB broth were 7.8, 8.1 (control), and 8.4. The pH levels for mycoplasma phosphate buffer were 6.9, 7.1 (control), and 7.5. The EFA challenge concentration was set at 5–6 × 10⁷ CFU/cm2 and the test pressure was set at 228 kPa. PES membrane 100% isopropanol bubble points were 296, 310, and 345 kPa. Refer to Figure 4for study design.

Robustness test study design.
Challenge Test Ruggedness: Lab versus Analyst versus Day
This full-factorial study examined the reproducibility of A. laidlawii challenge tests when performed in two laboratories located at different sites. Each laboratory contained different test equipment and incubators. Two analyst teams executed the study over 2 days. Two membrane polymers with different 100% isopropanol bubble points were examined: PVDF (159-kPa bubble point) and PES (296-kPa and 345-kPa bubble points). Refer to Figure 5 for study design. Testing was performed as described in the Bacterial Challenge Test section at the EFA challenge target of 2–3 × 10⁷ CFU/cm2 using a 207-kPa test pressure.

Ruggedness: lab versus analyst versus day study design.
Challenge Test Ruggedness: Media and A. laidlawii Stocks
This full-factorial study examined the reproducibility of LRV test results when different batches of GHB broth and GMA agar, as well as different lots of A. laidlawii frozen stock, were used. Each GHB broth and GMA agar component was weighed, mixed, and sterile-filtered or autoclaved separately. Each A. laidlawii frozen stock lot was made with different lots of GHB broth. Two membrane polymers with different 100% isopropanol bubble points were examined: PVDF (159-kPa bubble point) and PES (296-kPa and 345-kPa bubble points). Refer to Figure 6 for study design. Testing was performed as described in the Bacterial Challenge Test section using the EFA challenge target of 2–3 × 10⁷ CFU/cm2 at a 207-kPa test pressure.

Ruggedness: media and A. laidlawii stocks study design.
Results
Harvest Growth Curve
The objective of this study was to establish an operating window between 18 and 24 h that would provide a consistent cell titer where no significant change to cell concentration occurs. The 18–24-h window was established in development studies not reported here. Four trials were performed over 2 days. Each trial was performed using a different batch of GHB broth medium and GMA agar. Each batch of GHB broth and GMA agar was weighed, mixed, and sterile-filtered or autoclaved separately. Two different lots of A. laidlawii frozen stock were used. Plating was performed in triplicate per dilution concentration. The target was no significant change to cell concentration at a 95% confidence level. There was no significant change to cell concentration throughout the harvest window (18 h through 24 h). Analysis of the four trials was performed using Minitab version 14.02: analysis of variance (ANOVA) α = 0.05 and P = 0.566. Refer to Figure 7.

A. laidlawii harvest growth curves.
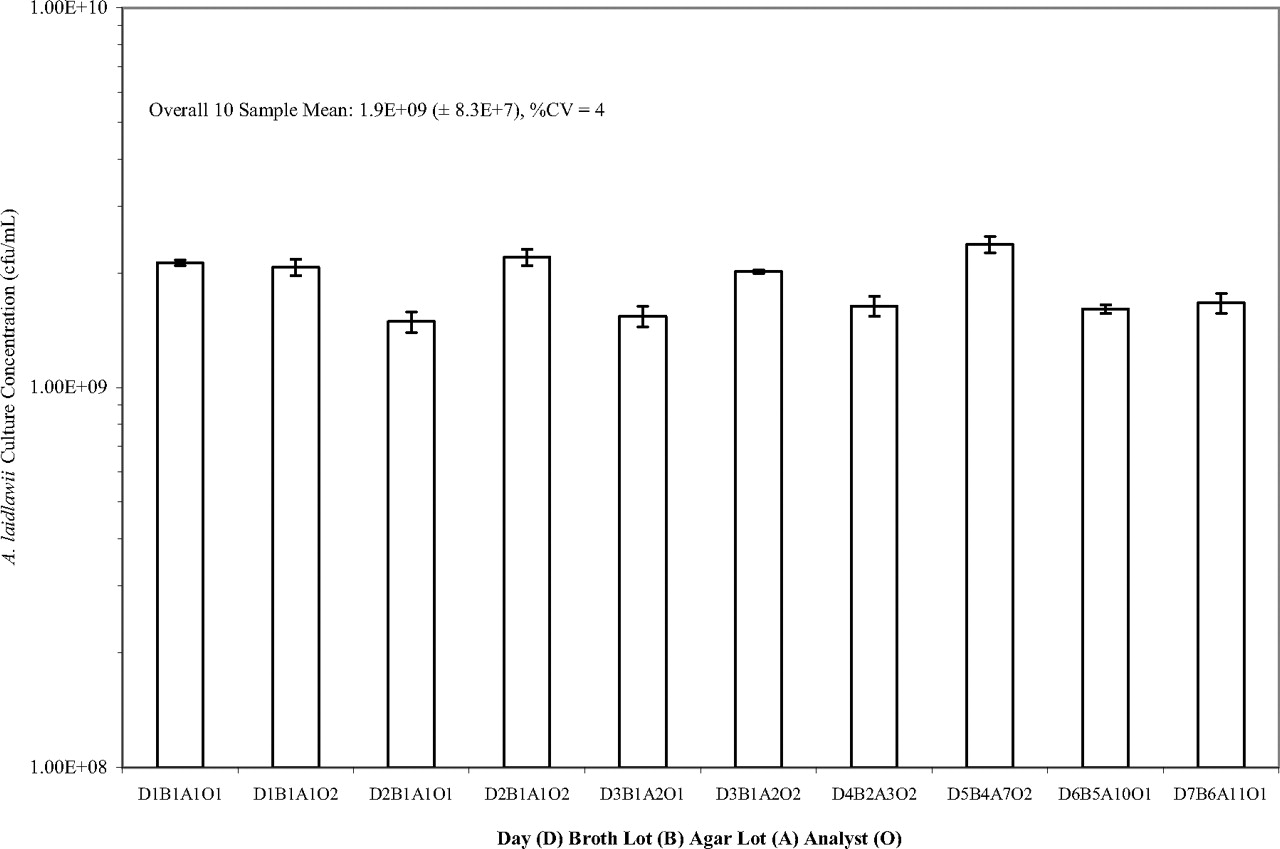
Culture Titer Stability
The objective of this study was to establish that the culturing process could produce A. laidlawii to a consistent concentration. Two different analysts assessed the titer of A. laidlawii cultivated in GHB broth using different lots of broth and agar. Plating was performed in triplicate per dilution concentration. Each analyst performed five trials each on different days with different broth cultures for a total of 10 data sets. The results met the acceptance criterion of producing an average titer ≥1 × 10⁹ CFU/mL, standard deviation ≤1 × 10⁹ CFU/mL, and percent coefficient of variation (%CV) ≤35. The actual results were 1.9 × 10⁹ ± 8.3 × 10⁷ CFU/mL, CV = 4. Refer to Figure 8.

A. laidlawii culture titer stability.
Media Shelf Life
The objective of this study was to demonstrate the broth and agar media can consistently support growth of A. laidlawii for a minimum of 30 days from the date of preparation. The results met the acceptance criterion that the titers of A. laidlawii for each batch of media must not drift more than 0.5 logs over the course of 30 days and the pH must be within a range of ±0.5 units over the course of 30 days. Refer to Figure 9.

Media shelf life for GHB broth and GMA agar.
Frozen Stock Shelf Life
The objective of this study was to establish the effective workable life of A. laidlawii stocks. These data can be used to establish a stocking schedule. There are at least 52 weeks of data on A. laidlawii stock concentration for three lots of frozen stock. Refer to Figure 10. The mean concentration over the sampling time was 7.5 × 10⁸ ± 2.1 × 10⁸ for lot AL FS 121506, 5.2 × 10⁸ ± 8.3 × 10⁷ for lot AL FS 012407, and 8.7 × 10⁸ ± 1.2 × 10⁸ for lot AL FS 060707. These lots continue to be examined in order to establish an expiration date. One lot, AL FS 121506, exhibited what may be an anomalous data set at 6 weeks; its previous and subsequent time points trend with the other two frozen stock lots.

A. laidlawii frozen stock shelf life.
Agar Growth Promotion
The objective of this study was to demonstrate that the agar batches have consistent and adequate growth promotion characteristics. The overall, initial 10-lot average was 1.9 × 10⁹ ± 4.0 × 10⁸, 21 %CV. Eighteen additional lots have met the acceptance criterion of ±25 %CV using the rolling 10-lot average. The overall mean for 28 lots was 2.2 × 10⁹ ± 4.2 × 10⁸, 19 %CV. Refer to Figure 11.

Agar growth promotion 10-lot rolling average.
Recovery Assay
The two objectives of the recovery assay were to (1) demonstrate the agar can reproducibly recover A. laidlawii and be enumerated accurately and precisely over the applicable range, and (2) document that the recovery membrane was suitable and did not promote false negative results. The target assay range in the recovery assay exercise was 20 to 200 CFU per agar plate (23, 24). The delivered assay range was 1 to 215 CFU for the MF method and 2 to 204 CFU for the pour-plate method.
The acceptance criterion for ≥70% recovery for the MF method (n = 150) compared to pour-plate method (n = 150) was met for accuracy. The overall percent recovery was 114% with the MF method recovering equal to better than the pour-plate method. Data for the MF method was plotted against data for the pour-plate method. The slope was 1.1 and the correlation coefficient (r2) was 0.94 meeting the linearity acceptance criterion of a slope between 0.8 and 1.2 and r2 of > 0.9. Refer to Figure 12.

MF versus pour-plate counts for A. laidlawii.
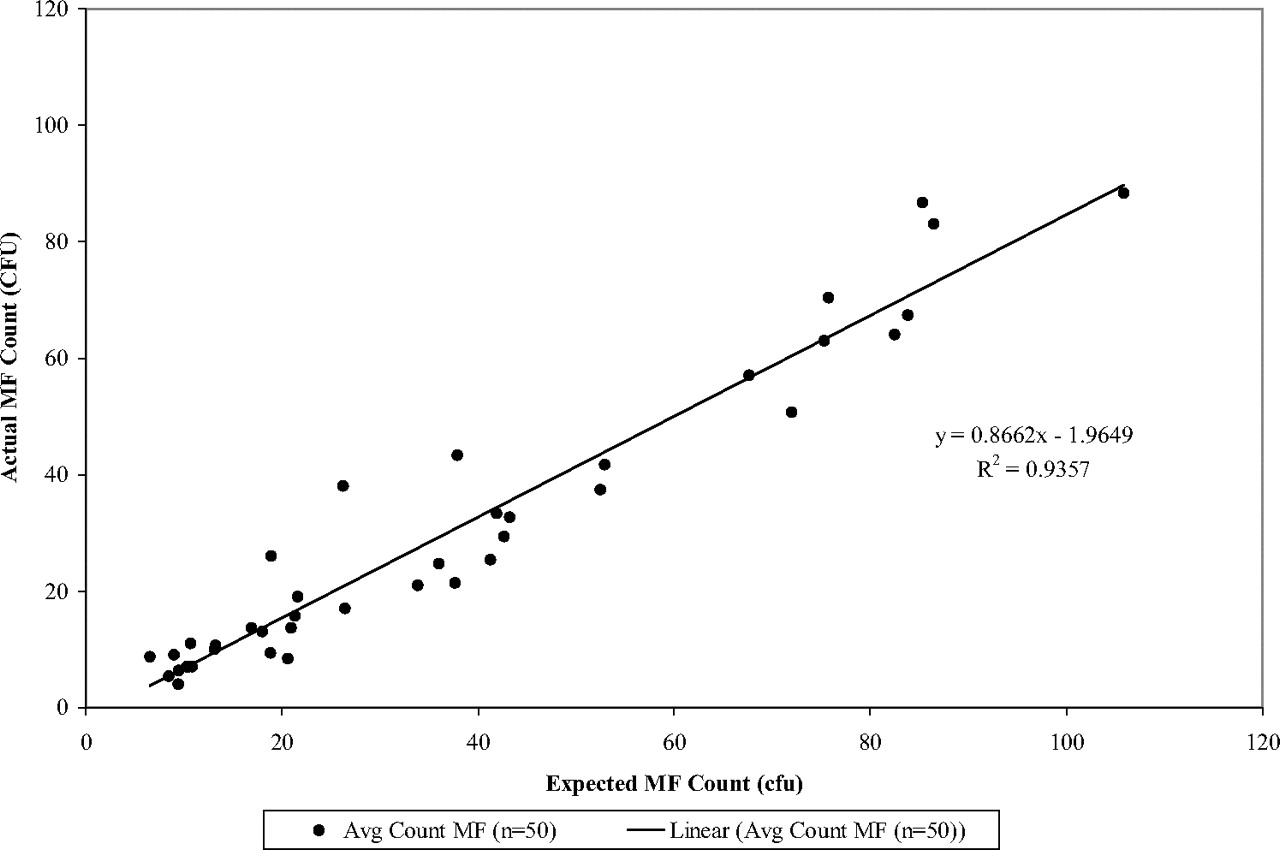
Linearity was also examined separately for each method by plotting data for actual plate counts against the expected plate count. The expected plate count was calculated using the starting count divided by the dilution factor. The slope was determined to be 0.9 for both the MF and the pour-plate methods. The r2 values were 0.94 for the MF method and 0.93 for the pour-plate method. Refer to Figures 13 and 14.

Linearity of MF for Acholeplasma laidlawii: actual recovery versus expected counts.

Linearity of pour-plate method for Acholeplasma laidlawii: actual recovery versus expected counts.
The Limit of quantitation (LOQ) may be defined as the lowest number of microorganisms that can be determined with acceptable precision and accuracy under the stated experimental conditions (19). The lowest dilution that delivered an average 35 %CV was used to establish the LOQ. The mean, standard deviation, and %CV were calculated at each dilution and plotted on a log-log scale with 95% confidence bands around the fitted line. ANOVA methods were used for estimating the LOQ of the pour-plate and MF methods. For both methods, the estimated %CV at 20 CFU is 35, which met the acceptance criterion. Refer to Figure 15.

Limit of quantitation for A. laidlawii.
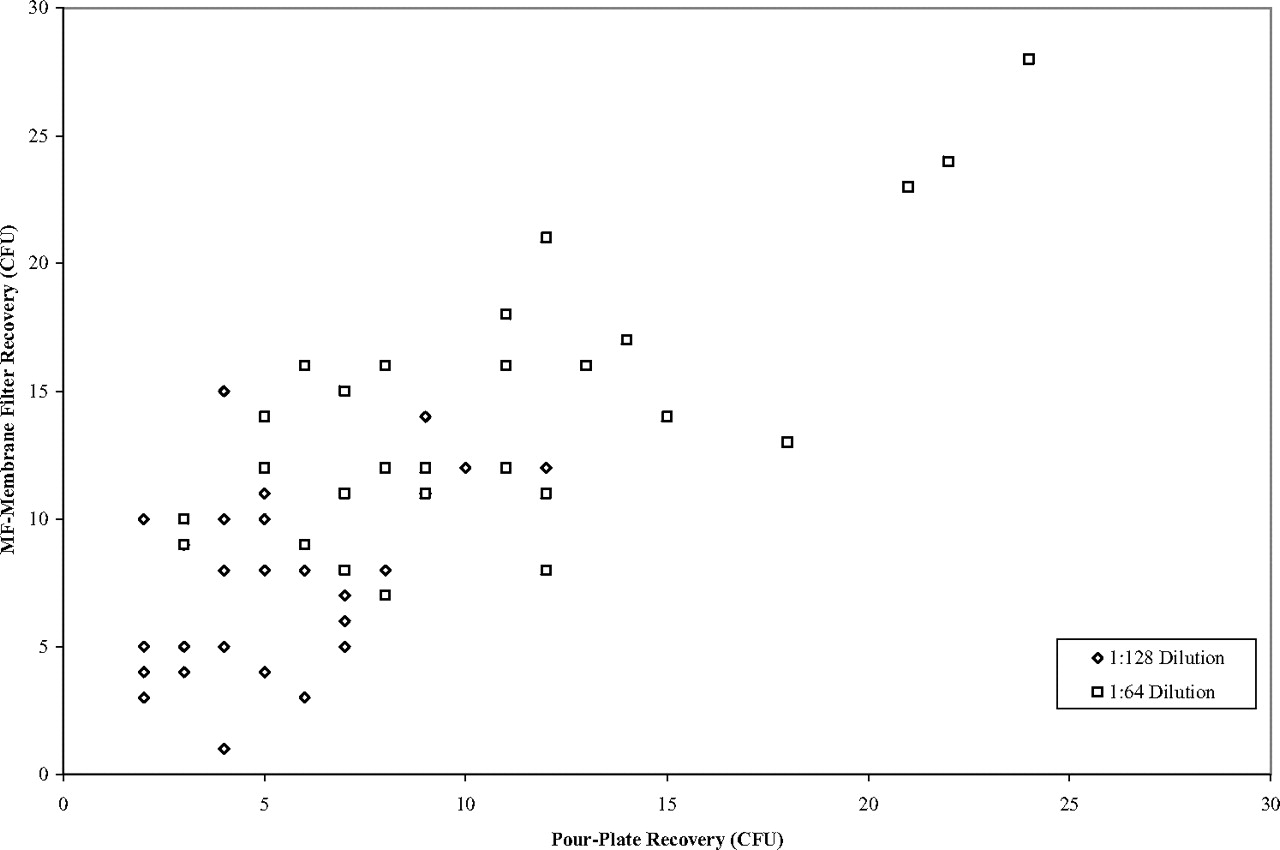
The limit of detection (LOD) refers to the lowest number of microorganisms that are present in the original sample, but not necessarily quantified, before the incubation step (19). In the case of the A. laidlawii bacterial challenge test, all of the filtrate downstream of the test filter is collected and processed through the analytical membrane filter. Thus, the limit of detection for the MF assay could be considered 1 CFU in the sample volume filtered. The actual recovery data for the MF and pour-plate methods was examined by plotting the MF versus pour-plate recovery data for the two dilutions in the study that tended to capture those counts less than or equal to 20 CFU. Refer to Figure 16. The 1:128 dilution generally provided counts less than or equal to 10 CFU and represents the lowest possible data set for evaluating the LOD for this study. Refer to Table I. In this range, the MF method had significantly higher average CFUs than the pour-plate method, both based upon a 100-μL volume, near the detection limit in the A. laidlawii assay. The average difference was 2.2 ± 1.6 CFU. This difference is significant (paired t-test, P = 0.002). Thus, the assay with the MF method is capable of meeting (and exceeding) a 1-CFU detection limit of the reference pour-plate method.

Performance of MF and pour-plate methods for recovery of A. laidlawii at 20 CFU or lower.
Limit of Detection: Difference in Pour-Plate and MF Recovery Methods
To assess whether or not false negative results would be obtained by the collection of cells on a 0.2-μm PVDF analytical membrane filter, the recovery assay filtrate from each analytical membrane filter was collected in double-strength GHB broth and incubated. Post-incubation, the filtrate from each analytical membrane filter was scored for the presence or absence of A. laidlawii. The results for 60 presence–absence tests (n = 12 each at 5 different 1:2 dilutions) demonstrated absence of growth downstream of the collection filter. The MF method using 0.2-μm PVDF analytical membranes exhibited a 0% false negative rate in this study. Unspiked negative controls exhibited absence of growth. Positive controls spiked with low levels of A. laidlawii cells at a target of <20 CFU/sample exhibited growth.
Cell Size and Morphology
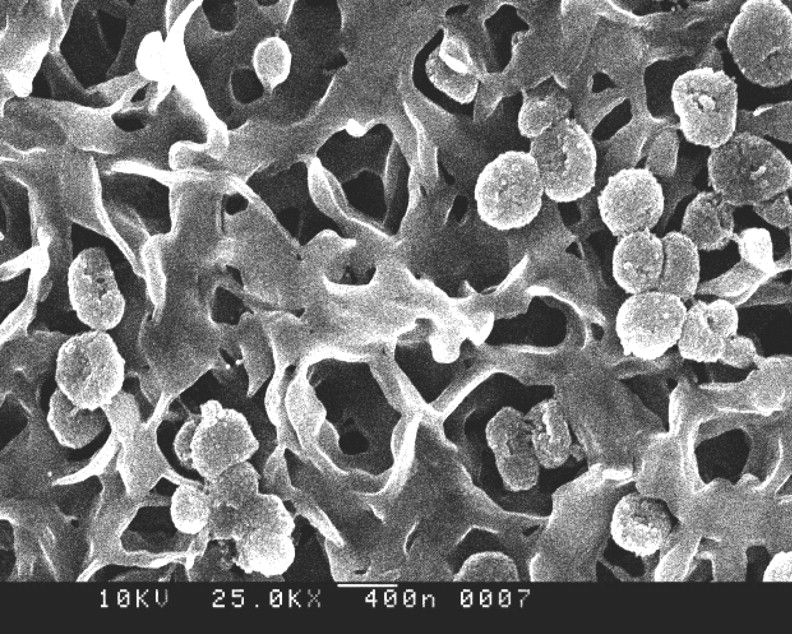
A size analysis was performed on three different cultures of A. laidlawii in GHB broth. Three different vials of frozen stock were inoculated into separate flasks of GHB broth and incubated at 37 ± 2 °C), with 6 ± 1% CO2 for 22 ± 2 h. Post-incubation aliquots from each culture were prepared for FESEM analysis. Several microscopic fields were randomly selected to image for each culture. Cells with unobscured margins were randomly selected from each image for sizing. The overall average size was 0.37 by 0.41 μm. Refer to Table II and Figures 17 and 18. Sizing data will be trended over time for comparative purposes. For challenge tests, the cell size will be qualitatively assessed using positive (expect passage of A. laidlawii) and negative (expect retention of A. laidlawii) membrane controls.
Relative Cell Size of A. Laidlawii by FESEM

Histogram length and width of A. laidlawii prepared for FESEM. Average of three separate GHB broth cultures harvested after 22 h at 37 °C, 6% CO2.

FESEM micrograph of A. laidlawii on a microporous membrane substrate.
Challenge Suspension Aggregation
The objective of this study was to demonstrate that the A. laidlawii challenge test can distinguish among membranes with different bubble points. Selection of membranes that provide different retention or passage outcomes can be used to determine the degree of aggregation in the challenge suspension. This test was performed using two analyst teams on two different days. One A. laidlawii stock lot, two different broth lots, and two different agar lots were examined. A total of four GHB/A. laidlawii cultures were tested. This study demonstrated that the A. laidlawii clearance test could differentiate among membranes with different bubble points and meets this acceptance criterion. Refer to Figure 19. All test pressures and bubble points reported in this study were converted to kPa from psig.

Challenge suspension aggregation.
Challenge Test Robustness
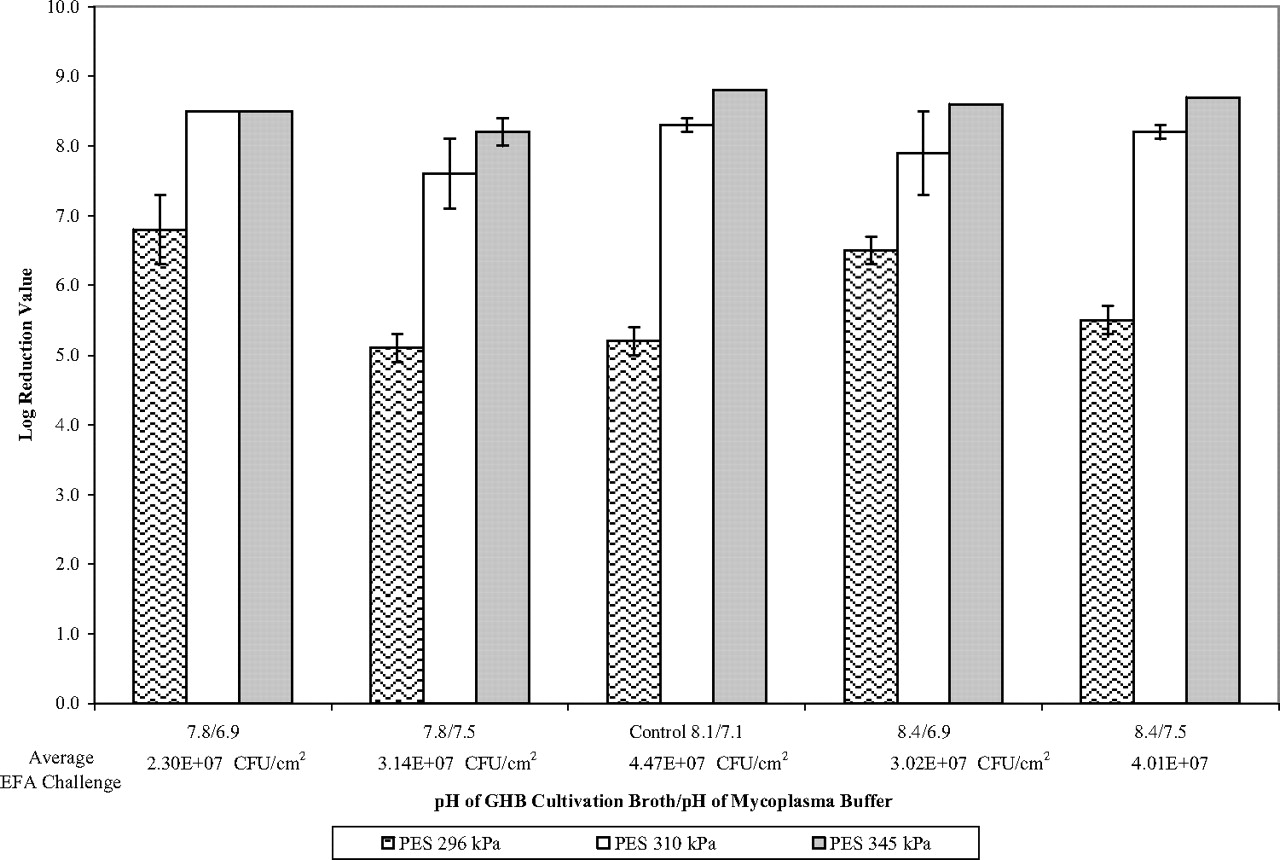
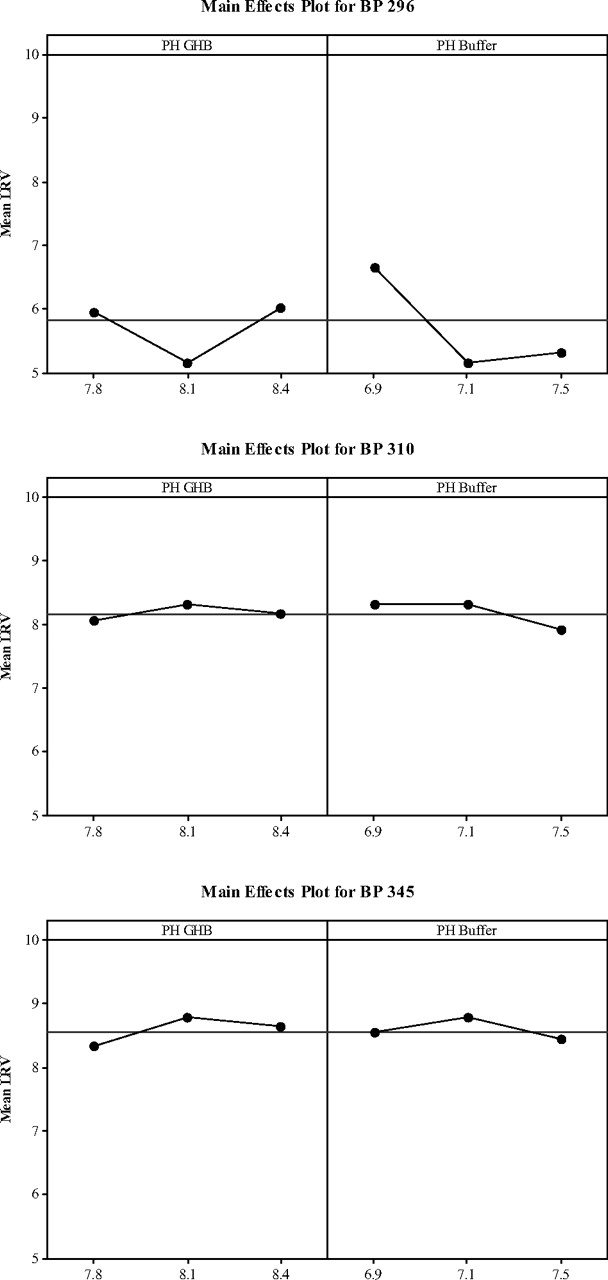
The standard pH range for the buffer and cultivation broth was established during method development. The objective of this study was to determine if the test method was affected by small but deliberate changes to pH that challenged the limits of the pH range. Refer to Figure 20. The more open, 296-kPa bubble point indicated that pH had an effect on LRV; however, the magnitude of this effect was ≤0.5 logs. Refer to Figure 21 for the main effects plots. Depending on the degree of pH control, it was concluded that the method robustness was acceptable, although there is pH sensitivity. The ability to control pH for these media is excellent. The mycoplasma buffer is stable and GHB broth is buffered. The pH range of both the mycoplasma buffer and GHB broth was tightened based upon these data, and the pH will be verified prior to use.

Challenge test robustness: LRV versus pH for PES membrane at three target bubble points.

Main effects plots challenge test robustness: LRV versus pH for PES membrane at three target bubble points.
Challenge Test Ruggedness: Lab versus Analyst versus Day
The objective of this study was to determine the reproducibility of the test results by conducting challenges with different analysts in different laboratories on different days. In this study, eight test runs were completed. Four runs were in laboratory location 1 (Lab 1), and four were in laboratory location 2 (Lab 2). The laboratories were located at different sites. Two teams of analysts conducted the tests in each lab on two different days.
In each run, 10 membrane samples were tested: four PES 296-kPa bubble point, three PES 345-kPa bubble point, and three PVDF 159-kPa bubble point positive control membranes. Each of these membranes was expected to have different LRV outcomes.
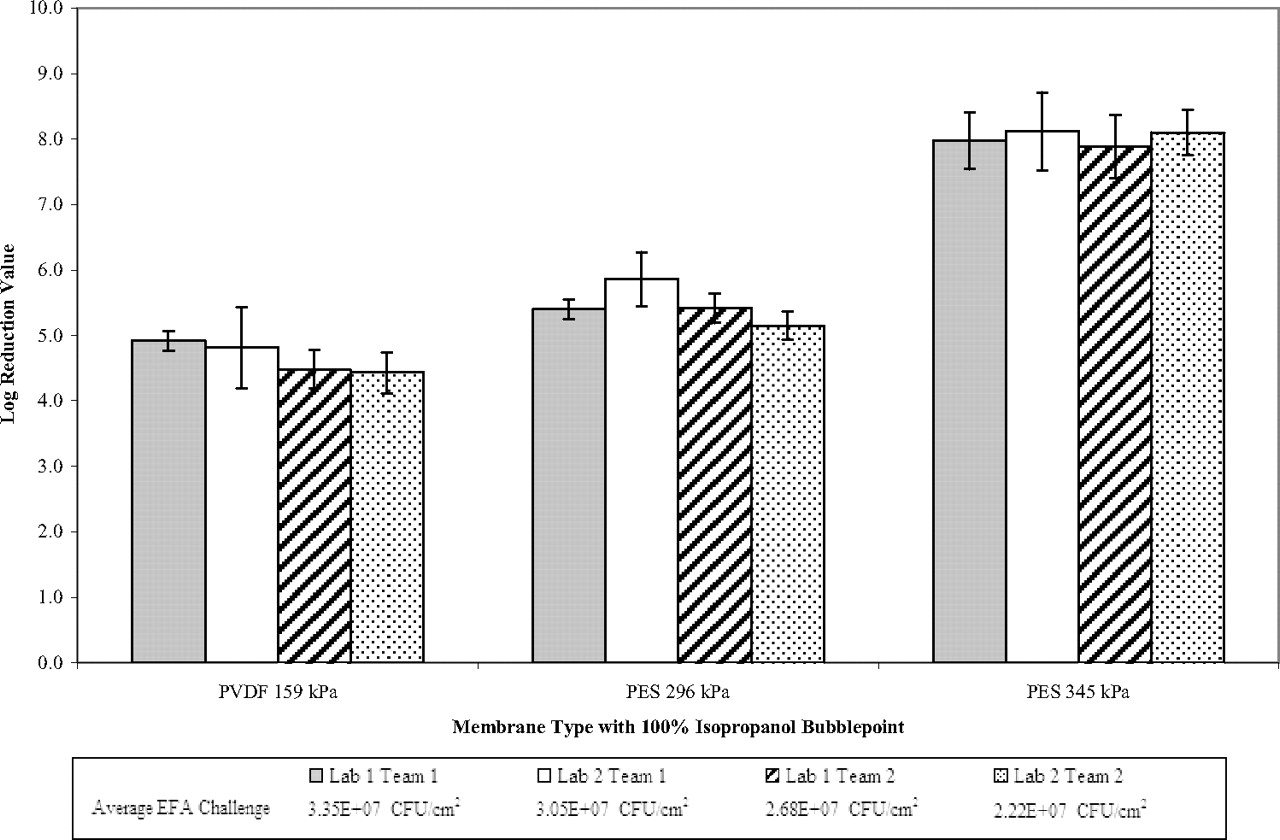
This study demonstrated that the test could differentiate among membranes with different bubble points. The PVDF 159-kPa membrane average LRV was 4.7 ± 0.32 for Lab 1 and 4.6 ± 0.50 for Lab 2. The PES 296-kPa membrane average LRV was 5.4 ± 0.18 for Lab 1 and 5.5 ± 0.50 for Lab 2. For PES 345-kPa bubble point samples, 15 of 24 results were completely retentive. The average LRV was about 8, and the standard deviation of samples that had a countable outcome was 0.27. These results were within the variability observed with the other membranes. The test met the acceptance criteria of differentiating among membrane types and delivering a standard deviation of ≤0.5. Refer to Figure 22.

Challenge test ruggedness: lab versus analyst team average LRV.
Challenge Test Ruggedness: Media and A. laidlawii Stocks
The objective of this study was to determine the reproducibility of the test results by conducting challenges with different batches of GHB broth, GMA agar, mycoplasma buffer, and A. laidlawii stocks. In this study, four media preparations made with different combinations of frozen stock, GMA agar, and GHB broth were evaluated. Triplicate samples of PES 296-kPa bubble point membrane were tested with each preparation, along with single samples of PES 345-kPa and PVDF 159-kPa bubble point membranes. Each A. laidlawii frozen stock lot was made with different lots of GHB broth; however, only one lot of lyophilized A. laidlawii was available from ATCC at the time of the study.
Results are shown in Figure 23 by membrane type. PES at 296 kPa had an average LRV of 5.1 ± 0.15. The average LRVs for each run were 4.9 to 5.2. Although a possible statistical difference could be detected (ANOVA F-test; P = 0.05), the magnitude was not of practical importance, as it was well within typical LRV assay standard deviation of 0.5 LRV. PES at 345 kPa had more variation, reflecting the variation of the assay near its detection limit. PVDF at 159 kPa had variation similar to PES at 296 kPa.

Challenge test ruggedness: media and A. laidlawii stocks average LRV.
Discussion
A serum-free cultivation broth and recovery agar for use in 0.1-μm-rated filter characterization and validation studies for biopharmaceutical applications were developed in our laboratory using A. laidlawii as the test microorganism (2). The validation study described here was conducted to ensure that the broth medium GHA broth and recovery agar GHA agar we developed are suitable for conducting bacterial retention studies for the determination of A. laidlawii clearance. Bacterial retention tests have several individual elements that need to be examined for their contribution to test variability. Once these elements are characterized and understood, one can perform tests consistently and interpret data appropriately.
This study focused upon evaluating the test method. Membranes were selected to examine different degrees of bacterial passage. It was not the intention of this study to establish A. laidlawii clearance claims for a particular class of membrane or to validate membrane performance.
The harvest growth curve study was performed to verify that the time at which the culture is used is within a window when no significant change to cell concentration occurs. Establishing a window for harvesting cells for bacterial challenge tests allows for both consistency and flexibility in testing.
Culture titer was assessed over multiple days using different analysts and different media batches to determine the degree of variation in cell concentration at a specific harvest time. The cell concentration has a direct effect on LRV where LRV = log10 (Total Challenge/Total Passage). Therefore, conditions that produce a consistent titer will allow for an accurate assessment of membrane lot performance over time.
The shelf life study demonstrated that GHB broth and GMA agar consistently supported growth of A. laidlawii for a minimum of 30 days from date of preparation. The media used for A. laidlawii studies are typically consumed within 1–2 days of preparation; 30 days was selected as a reasonable endpoint to assess in this study. The frozen stock shelf life supports a minimum 1-year expiration from the date of preparation, and these lots continue to be titered to determine how long these stocks may be used and to establish a stocking schedule.
Agar growth promotion demonstrated that GMA agar batches had consistent and adequate growth promotion characteristics during the validation exercise. Agar growth promotion continues to be trended over time and continues to show consistent recovery from batch to batch.
The recovery assay demonstrated (1) the analytical membrane filter assay reproducibly recovered A. laidlawii, (2) cell counts were determined accurately and precisely over the applicable range, and (3) low levels of cells were recovered on the assay filter with an absence of false negatives.
The recovery assay is used in the bacterial challenge test to quantitatively assess the filtrate collected downstream of the test membrane for the presence of the test bacterium. Therefore the suitability of the recovery membrane to detect A. laidlawii in a large volume of filtrate without false negative results is a critical design parameter. A common question arises in bacterial challenge tests as to why one would use an analytical membrane with a larger pore size than the test membrane. This question was first addressed for 0.45-μm analytical membrane filters used in Brevundimonas (formerly Pseudomonas) diminuta challenge tests by Carter (25). A similar argument was presented for the use of 0.2-μm analytical membranes for recovery of A. laidlawii. Typically in a bacterial challenge test, the entire filtrate volume is processed through a single assay membrane; the presence of a single colony recovered on the assay membrane is significant and suggestive of a non-retentive filter. The data in this study supports the use of 0.2-μm PVDF assay membranes to recover low concentrations of A. laidlawii with an absence of false negatives. Conversely, high level passage through the test filter would result in a too-numerous-to-count (TNTC) score for that analytical membrane. In this example, as in Carter's, the upper LOQ restricts the assay, not the analytical membrane bacterial retention rating.
FESEM was used as a comparative tool in this study. FESEM provides useful information on morphology, aggregation, and relative size. It is important to note that different fixation methodologies can affect cell size and that valid comparisons for cell size can only be made using the same sizing method in conjunction with qualified analysts. In addition, all FESEM fixation procedures dehydrate the cells and the actual hydrated size may be larger. For this reason, FESEM cell size is used as a trending tool, not an acceptance criterion for this bacterial challenge test.
Cell size and aggregation in a bacterial challenge test are assessed using the bacterial challenge suspension and positive membrane filter controls. If the challenge suspension concentration meets the minimum EFA challenge and the test bacterium penetrates the control membrane in a consistent and reproducible manner, then the challenge test is valid. In this validation exercise, three membranes were selected to provide different LRV outcomes in order to demonstrate that the A. laidlawii bacterial challenge test can distinguish among membranes with different bubble points.
The objective of the robustness portion of the validation exercise was to determine the reproducibility of the test results when small but deliberate changes in critical method parameters were induced. The standard test pressure used in our laboratory for bacterial challenge tests is 207 kPa. An initial screening study with A. laidlawii showed the difference in LRV at test pressures between 186 kPa and 228 kPa was not statistically significant. Therefore the upper end of the operating range, 228 kPa, was selected as the test pressure for this study. The minimum challenge target was set at 1 × 10⁷ CFU/cm2 with a standard challenge target of 2–3 × 10⁷ CFU/cm2 and an upper acceptance limit of 5–6 × 10⁷ CFU/cm2. As the challenge level increases, the degree of bacterial penetration in open membranes can increase. This can cause variability in the data. Therefore, it is important to control the challenge concentration delivered in each test. Again membranes with different bubble points were tested, as different LRV outcomes would pick up the variations in this study. In this case, PES membranes at 296-kPa, 310-kPa, and 345-kPa bubble points were tested.
As mentioned above, the upper acceptance limit for EFA challenge target was tested in the ruggedness exercise. Currently there is no industry standard for a minimum challenge target for mycoplasma challenge testing. The 107-CFU/cm2 range was selected for two reasons. First, the B. diminuta challenge test is conducted at this level (18). Secondly, it is difficult to analyze the effectiveness of detecting differences if the outcomes are simply retentive (0 CFU passage) or non-retentive, so the 107-CFU/cm2 level allowed increased signal for assessing variability.
The ruggedness exercises were designed to determine the reproducibility of bacterial challenge tests by evaluating LRV under a variety of normal test conditions, such as different lots of media and A. laidlawii stocks, as well as testing on different days, with different analyst teams, labs, and equipment. The ruggedness study has three benefits: (1) it documented that the test method could be performed in different labs at different sites with different analysts using different lots of stock and media; (2) it demonstrated that the new lab could begin to perform studies routinely; and (3) it can serve as the basis for future proficiency testing among analysts and laboratories.
This group of studies offers one approach to validating a bacterial challenge test using A. laidlawii as the model test microorganism for mycoplasma clearance and supports a consistent, reproducible method.
Acknowledgements
We would like to thank Guy Caze and Jeff Wiese for their participation in this study and to recognize David Bell, Susan Connolly, and Chris Santeufemio of the Millipore Imaging Lab for FESEM images.
- © PDA, Inc. 2009


