
Abstract
This study describes a comprehensive analytical approach for evaluating potential leachables from product-contacting material surfaces in the manufacture of bulk drug substance (BDS) for use in parenteral products. A qualitative step-by-step evaluation of the process stream for the production, purification, and storage of the BDS was performed. The product-contact equipment surfaces were then grouped based on their materials of construction and prioritized according to the potential risk of contributing leachables to the BDS. Based on this evaluation, 13 potential leachable species were identified and classified either as volatile organic compounds (VOCs), semi-volatile organic compounds (SVOCs), anions, cations, or trace metals.
The BDS was first screened for the presence of VOCs, SVOCs, anions, cations, and trace metals using analytical methods that were qualified for their application with the BDS. Thirteen potential leachables were then spiked in the BDS and in the water for injection for spike-recovery studies.
The analysis of the BDS for potential leachables showed that the potential impurities were not present in the BDS except for a trace amount of silicon, and that the residual solvent concentrations were lower than the recommended limits established by the International Committee on Harmonisation. The spike-recovery studies confirmed that the analytical methods could effectively determine the leachable compounds in the BDS. Moreover, the 13 contaminants did not form a complex with the protein in the BDS and did not represent a potential risk to the BDS's safety and stability.
- Disposable
- Leachable
- Extractable
- Bulk drug substance
- Final drug product
- Risk evaluation
- Volatile organic compounds
- Formaldehyde
- Silicon
- International Conference on Harmonisation
Introduction
The use of disposable materials such as polymers and elastomers is increasing considerably in biopharmaceutical processing. However, polymers and elastomers may have a higher risk of releasing soluble materials into the product stream than do traditional materials such as glass and stainless steel. The ability to evaluate and quantify leachables and extractables from disposable materials is clearly important in today's biopharmaceutical processing.
Extractables are chemical components that are removed from a material by application of an exaggerated force, that is, solvent, temperature, and time. Leachables are a subset of extractables and are defined as chemical species that have migrated from storage containers or other components into the product under normal conditions of use or during stability studies.
The purpose of this article is to illustrate one of the approaches that can be used to evaluate leachables in bulk drug substance (BDS) manufacturing. The approach discussed in this article is a risk-based process that is suggested by the paper by the Biopharmaceutical Process Extractables Core Team, “Evaluation of Extractables from Product-Contact Surfaces”, in BioPharm International, December 2002 (1).
The first part this article will cover the BDS manufacturing process and a risk assessment procedure to identify the potential materials and steps for the introduction of leachables. The risk assessment is a qualitative analysis to select potential leachable compounds for spike-recovery in analytical method qualification. The second part of the study describes a quantity analysis to ensure that the potential leachable impurities are not present in the BDS and the residual solvent concentrations are lower than the recommended limits established by the International Conference on Harmonisation (ICH) Q3C “Impurities: Residual Solvents” (2) limit. Spike-recovery studies of BDS and water for injection (WFI) were performed with 13 potential leachables in the BDS in order to confirm that analytical methods can be used to quantify the leachable compounds and the leachable compounds will not be lost during the sample preparation. Moreover, test were performed in order to ensure that the potential leachable compounds will not form a complex with the protein in the BDS.
BDS Manufacturing Process
In this study, the final drug product (FDP) is a vaccine containing recombinant protective antigen (rPA) protein. The FDP protein concentration is about 0.2 mg/mL in a pre-filled, ready-to-use syringe. The drug product is intended to be administered in a three-dose regiment over a 1-month period. A 10-fold dilution of the BDS is performed to obtain the FDP formulation.
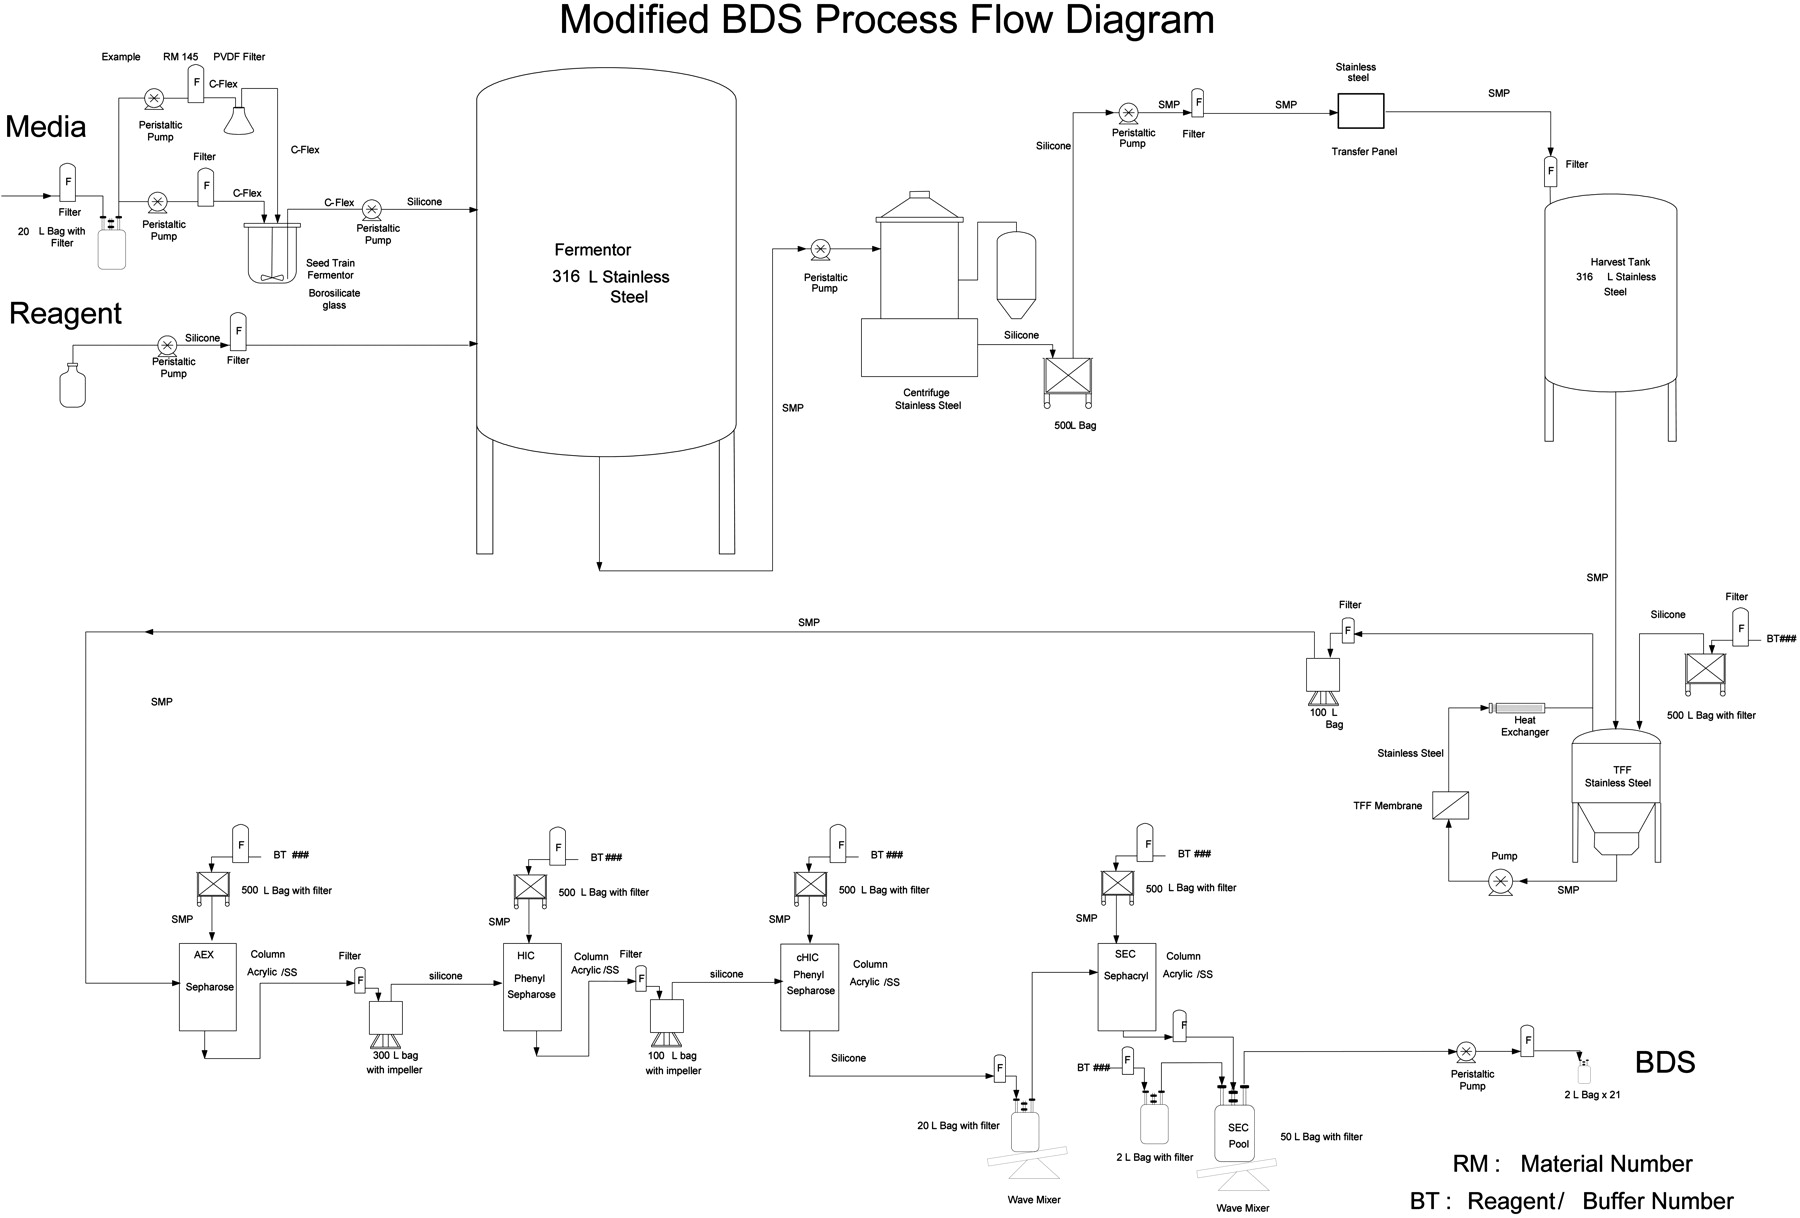
The BDS is produced using bacterial fermentation in a stainless steel fermentor, harvested by centrifugation, clarified by filtration, concentrated and diafiltered by tangential flow filtration, and purified in a series of chromatography steps prior to final formulation and freezing. The BDS is dispensed and frozen in 2-L bioprocess bags. A simplified process flow diagram of the manufacturing process is shown in Figure 1.

Modified Process Flow Diagram
The bulk manufacturing equipment used for the process steps described above is constructed of glass or 316 L stainless steel with gaskets and valve diaphragms constructed of silicone rubber, Tufsteel® (PTFE [polytetrafluoroethylene] and 316 L stainless steel), and Teflon®-coated EDPM (ethylene propylene diene monomer). Buffer and stored product in-process are placed in two types of single-use, flexible containers constructed of multiple layers of various plastics. The product-contact layers are LDPE (low-density polyethylene) and PE (polyethylene).
The solutions are transferred through 316 L stainless steel, platinum-cured silicone or fluoropolymer tubing and hoses. Filtration is through filters composed of membranes of PVDF (polyvinylidenedifluoride), cellulose acetate, polyethersulfone, stabilized cellulose, or cellulose/inorganic filter aid/mixed cellulose esters. The filter supports and housings are constructed of polypropylene, polyetherimide, polycarbonate, or polysulfone. Purification is performed on the chromatography resins: Sepharose®, Phenyl Sepharose®, and Sephacryl®, and the frozen BDS is filled and frozen in 2-L bags and shipped frozen to a formulation/fill/finish facility.
Materials in Product Contact
A process flow diagram was prepared based upon the batch records, raw material specifications, standard operating procedures (SOPs), and a physical verification in the plant to determine the items in contact with the process solutions. After the items in product contact were identified, a series of spreadsheets with a detailed description of the material used in the production process were compiled as part of a review process. Items constructed of stainless steel and glass were excluded from this review because they present minimal risk of contributing leachable substances. These spreadsheets documented the following information for each item: Raw Material Specification Number; Vendor; Catalogue Number; Available Vendor Literature; Vendor Testing Performed (The United States Pharmacopeia [USP] 〈88〉 In Vivo Biological Reactivity Testing [Class VI]) (3), if available; Materials of Construction, Where Used In the Process, Process Solution Contacted, Surface Area, Process Temperature, and Contact Time.
The product-contact items were grouped into families with identical materials of construction and type, but different sizes. A total of 22 material families were identified in this study.
Risk Evaluation
The various contact materials were prioritized with respect to their relative risk of contributing leachable substances to the product via a qualitative and subjective process that has been previously proposed for use with bioprocessing systems. Such an assessment considered the following eight properties of the contact materials: compatibility, proximity to the BDS, extraction capacity of the solvent, contact time, surface area, USP Class VI testing status, temperature of contacts, and resistance to extraction.
Compatibility: The item's construction materials were evaluated against the solutions they contacted based on vendor literature and other technical resources and classified as “Excellent”, “Very Good”, or “Good”. Note: Items with a lower than “good” compatibility were not used in the BDS manufacturing process.
Proximity to BDS: Whether the materials were used upstream in the fermentation process, where they are less likely to contribute leachable substances to the BDS, or further downstream in the purification or formulation processes, where they are more likely to contribute leachable substances into the final BDS.
Extraction Capability of Solvent: Each family was assigned a risk value based on the potential for the process solutions to interact with the elastomeric and polymeric materials and extract compounds. Organic solvents have the greatest potential to extract, and ionic buffer solutions the least. The formulation buffer and BDS, which contain surfactant, have a greater potential to extract compounds than those solutions that do not contain surfactant.
Contact Time: The length of time the item was in contact with the process solution(s).
Surface Area: The amount of surface area in contact with the process solution.
USP Class VI—Whether USP Class VI testing has been performed that demonstrates that the materials do not exhibit systemic or intracutaneous toxicity.
Temperature: Temperature at which the materials contact the process solution.
Resistance to Extraction: The materials' inherent resistance to extraction based upon their physicochemical nature.
A project team consisting of engineering, process development, manufacturing, and quality control sections evaluated and assessed all 22 material families. An example of a relative risk evaluation worksheet for Filter Family 1 is shown in Table I.
An Example of Relative Risk Evaluation Worksheet
Relative Risk Evaluation Summary
The material families were ranked according to the total relative risk factor based on the above eight properties. The results are summarized in Table II and the materials with the highest risk factors highlighted. Based on such an assessment, the chromatography resins were identified as the system components with the highest risk and were thus targeted for further assessment. The high-risk factors were due primarily to the high surface areas, the lack of USP Class VI testing (chromatography resins), and the possibility that contact with the final formulation buffer and BDS may increase the solutions' potential to extract compounds. The bioprocess bags, which have by far the largest surface area and contact time with the process solutions, were also determined to be high risk.
Relative Risk Evaluation Summary
Based on the relatively higher risk of seven material families shown in Table II, potential leachable compounds were identified from the vendor-provided data and the chemical composition of each material family. The selection of the spike-recovery compounds was based on a collective evaluation of the project team. This risk evaluation was based upon potential toxicity concerns and the existence of ICH limits or because they are known to be toxic and/or carcinogenic. Moreover, the availability of the compound as a spike-standard material was also considered. At least one representative compound was selected for each material family, and more representative compounds were selected for the higher risk material families. The final 13 representative compounds were selected for spike-recovery/method qualification to demonstrate that the sample preparation and analytical test methods were capable of quantitatively recovering these known potential leachable substances. These compounds are reported in Table III.
Compounds for Spike Recovery
Analytical Methods
Volatile Organic Compounds (VOCs)
The analysis of the volatile organic compounds (VOCs) was performed using a Solid Phase Micro-Extraction (SPME) and an HP 6890 Gas Chromatography system equipped with a flame ionization detector (GC-FID). The SPME GC method was validated for trace levels of 18 volatile organic compounds (molecular weight MW < 225). The target VOCs are residual solvents commonly found as organic contaminants from polymeric materials used in pharmaceutical processing. The following chromatographic conditions were used:
Identification of each target volatile compound in the chromatographs was based on its retention time compared to a standard solution. The GC-FID was calibrated using the 18 NIST (National Institute of Standards and Technology)-traceable VOC standards with a five-point calibration curve. The chromatographs were optimized and the peak area vs concentration was plotted to obtain a correlation coefficient: R2 ≥ 0.990. Samples were quantified by comparing the peak area of each target compound in the sample chromatograph to the peak area of the calibration curve for each of the 18 standard VOCs. Two ultra-pure water (UPW) blanks were processed as internal controls using the same procedure as for the samples. Two spike concentration levels were used for each target VOC to verify method accuracy. Samples were prepared and analyzed in duplicate to verify method precision. The reporting detection limit (RDL) is 50 ppb.
Semi-Volatile and Non-Volatile Organic Compounds (SVOCs and NVOCs)
The analysis of the semi-volatile and non-volatile organic compounds (SVOCs and NVOCs, respectively) was performed by solvent extraction followed by analysis with an HP 6890 GC system and an HP 5973 Mass Selective Detector (MSD). Before the extraction procedure, an internal calibration standard was added to the WFI rinsate and the filtered BDS solution and, after repeated extractions, the combined extracts were concentrated and analyzed by GC-MS. Two UPW blanks were processed as an internal control using the same procedure as for the samples. The following chromatographic conditions were used:
Semi-quantitation of the potential leachables was based on the response factor of the internal calibration standard. SVOCs were identified by a computer-aided search of the NIST mass spectra library cataloguing 195,000 spectra. Samples were prepared and analyzed in duplicate to verify method precision. The RDL is 10 ppb.
The same concentrated extracts used for SVOC analysis were used for the NVOC analysis by GC-MS. To analyze the NVOCs by GC-MS, the GC injection port temperature was raised to 280 °C. Therefore, non-volatile organics with flash points ≤ 280 °C could be vaporized and analyzed. Only the additional chromatographic peaks other than those found in the SVOC analysis were identified and reported.
Anions
The analysis of standard anions was performed using a validated method for a DX500 ion chromatography (IC) system equipped with a conductivity detector, a GP50 gradient pump, and an AS50 autosampler a 750-μL sample loop, an Ionpac AG11 guard column, an Ionpac AS11 analytical column, and an ASRS-Ultra II 4-mm self-regenerating suppressor. The chromatographic analysis was performed using a gradient program that mixes UPW, 20 mM eluent, and a 100 mM NaOH eluent so that the concentration of NaOH increases through the run. The eluent flow rate was 2 mL per min. The standard anion panel includes fluoride, chloride, nitrite, bromide, nitrate, sulfate, and phosphate. Additionally, a method for the detection and quantitation of acetate and formate was qualified on the same instrument. The instrument was calibrated using five anion standard concentrations. For the acetate and formate, calibration was performed with a six-point calibration curve. The chromatographs were optimized and the peak area vs concentration was plotted to obtain a correlation coefficient: R2 ≥ 0.996. Method accuracy was verified using one spike analysis for each target ion. The RDLs were 2 ppm for the standard anion panel and 0.5 ppm for acetate and formate ions.
Cations
The analysis of standard cations was performed using a validated method for a DX300 IC system equipped with a gradient pump and a conductivity detector, a 750-μL sample loop, an Ionpac CG12A guard column, an Ionpac CS12A analytical column, and a CSRS-Ultra II 4-mm self-regenerating suppressor. The chromatographic analysis was performed using an isocratic program of 20 mN MSA (methanesulfonic acid). The eluent flow rate was 1 mL per min. The standard cation panel includes lithium, sodium, ammonium, potassium, magnesium, and calcium. Additionally, a method for the detection of glycidyltrimethyl ammonium ion was qualified on the same instrument. The instrument was calibrated using five cation standard concentrations. For the glycidyltrimethyl ammonium ion, calibration was performed with a four-point calibration curve. The chromatographs were optimized and the peak area vs concentration was plotted to obtain a correlation coefficient: R2 ≥ 0.996. Method accuracy was verified using one spike analysis for each target ion. The RDLs are 2 ppm for the standard cation panel and 1 ppm for the glycidyltrimethyl ion.
Formaldehyde
The analysis of formaldehyde was performed using a qualified method using derivatization followed by analysis with a HP 1100 Liquid Chromatograph (LC) and G-1315A Diode Array Detector (DAD). The pH of each WFI rinsate and BDS sample was adjusted to pH 5 using a buffer solution, then 2,4-dinitrophenylhydrazine (DNPH) was added to each sample to derivatize formaldehyde. The samples were extracted several times with methylene chloride, and the combined extracts were concentrated to dryness, re-dissolved in acetonitrile, and analyzed by LC-DAD. An acetonitrile blank was processed as an internal control using the same procedure as for the samples. The chromatographic analysis was performed using the following isocratic program:
For the qualification of the method, the instrument was calibrated using a four-point calibration curve in duplicate. The chromatographs were optimized and the peak area vs concentration was plotted to obtain a correlation coefficient: R2 ≥ 0.996. Two spike concentration levels were used to verify method accuracy. Samples were prepared and analyzed in duplicate to verify method precision. The RDL is 100 ppb.
Silicon
The analysis of total silicon was performed using a qualified method for a Varian Vista AX ICP-AES (Inductively Coupled Plasma Atomic Emission Spectroscopy). Calibration standards were prepared based on NIST-traceable standard solutions. A quality control standard was also analyzed to confirm accuracy. The following conditions were used for the analysis:
The ICP-AES was calibrated for silicon using a three-point calibration curve. The spectra were optimized and the intensity vs concentration was plotted to obtain a linear calibration response with correlation coefficient: R2 ≥ 0.996. The RDL is 5 ppb.
Materials
VaxGen provided six aliquots of BDS in amber glass bottles supplied by Metron Technology-ChemTrace Services. Each aliquot contained ∼250 mL test solution and was stored in a temperature monitored refrigerator in a Class 1000 cleanroom at 2–8 °C. WFI was used as a control for the filtration procedure and purchased from Baxter, Deerfield, IL. An Amicon stirred ultrafiltration cell unit Model 8200® was provided by VaxGen and purchased from Millipore. The standards for the calibration of the gas chromatography (GC) and the gas chromatography/mass spectrometry (GC-MS) methods were provided by Environmental Resource Associates (Arvada, CO). The standards for the quality control of the GC and the GC-MS methods were obtained from Supelco (Bellefonte, PA). The standards used for the calibration of the IC system were purchased from EM Science Suprapur Grade.
Sample Preparation
The protein concentration of the BDS (∼2 mg/mL) interferes with the analysis of the compounds by the analytical methods to be used. An ultrafiltration technique was therefore used to remove the protein according to the procedure described below.
The WFI and BDS test samples were filtered using the ultrafiltration unit equipped with an Amicon regenerated cellulose ultrafiltration membrane (10-kDa nominal molecular weight cut-off) as detailed below.
The ultrafiltration membrane was soaked in WFI for approximately 5 min.
The filtering apparatus was assembled according to the Millipore instructions using the WFI-soaked membrane.
The WFI used to soak the membrane was poured into the ultrafiltration unit, the unit was capped, the pressure of the nitrogen line was set to 60 psig, and the solution was then stirred.
A portion of the WFI rinsate was collected in pre-cleaned, amber glass bottles and analyzed by SPME GC-FID extraction, followed by GC-MS and LC-DAD. The remaining WFI rinsate was collected in two polypropylene bottles and analyzed by IC and ICP-AES. These WFI rinsate samples represented the background control for contaminants originating from either the filtration unit and/or from the environment.
Using the same filter set-up, the BDS samples were filtered and collected in the same way as the WFI samples. A portion of the filtered BDS was collected in pre-cleaned, amber glass bottles and analyzed by SPME GC-FID extraction, followed by GC-FID, GC-MS, and LC-DAD. The remaining filtered BDS was collected in two polypropylene bottles and analyzed by IC and ICP-AES.
Spiked BDS samples for the spike recovery study were treated in a similar manner. First, WFI was filtered through the ultrafiltration unit prior to filtering the spiked BDS. The BDS was spiked with the compounds listed in Table III.
Volatile Organic Compounds (VOCs): Approximately 60 g of BDS was spiked with ∼8.2 ppm of ethanol, acetone, and isopropanol and ∼11 ppm of toluene and epichlorohydrin. After collecting the WFI rinsate, the spiked BDS was poured into the ultrafiltration apparatus, which was cooled using dry ice. The filtration took approximately 1 h. The WFI rinsate and the filtered/spiked BDS sample were immediately analyzed by SPME GC-FID.
Semi-Volatile Organic Compounds (SVOCs): Approximately 200 g of BDS was spiked with ∼450 ppb of caprolactam, ∼2200 ppb of 3-phenoxy-1,2-propanediol, and ∼160 ppb of 2,4-di-tert-butyl phenol. After collecting the WFI rinsate, the spiked BDS was poured into the ultrafiltration apparatus and filtered at room temperature. The filtration procedure took approximately 3 h. The WFI rinsate and the filtered/spiked BDS sample were immediately stored in a refrigerator at 2–8 °C and analyzed by DCM (dichloromethane) extraction followed by GC-MS.
Ionic Species: Approximately 50 g of BDS was spiked with ∼200 ppm of formate and acetate and ∼4.9 ppm of glycidyltrimethyl ammonium. After collecting the WFI rinsate, the spiked BDS was poured into the ultrafiltration apparatus and filtered at room temperature. The filtration procedure took approximately 1 h. The WFI rinsate and the filtered/spiked BDS sample were immediately analyzed by IC.
Formaldehyde: Approximately 85 g of BDS was spiked with ∼250 ppb of formaldehyde. After collecting the WFI rinsate, the spiked BDS was poured into the ultrafiltration apparatus and filtered at room temperature. The WFI rinsate and the filtered/spiked BDS sample were immediately analyzed by LC-DAD.
Silicon: Approximately 50 g of BDS was spiked with ∼200 ppb of silicon standard solution. After collecting the WFI rinsate, the spiked BDS was poured into the ultrafiltration apparatus and filtered at room temperature. The WFI rinsate and the filtered/spiked BDS sample were immediately analyzed by ICP-AES.
Spiked WFI controls for the spike-recovery study were also treated using the same procedure. The WFI was filtered through the ultrafiltration unit prior to filtering the WFI that was spiked with the compounds listed in Table III.
Volatile Organic Compounds (VOCs): Approximately 100 g of WFI was spiked with ∼200 ppb of ethanol, acetone, isopropanol, toluene, and epichlorohydrin. After collecting the WFI rinsate, the spiked WFI was poured into the ultrafiltration apparatus and filtered at room temperature. The WFI rinsate and the filtered/spiked WFI sample were immediately analyzed by SPME GC-FID.
Semi-Volatile Organic Compounds (SVOCs): Approximately 180 g of WFI was spiked with ∼1,000 ppb of caprolactam and 2,4-di-tert-butyl phenol, and ∼5,100 ppb of 3-phenoxy-1,2-propanediol. After collecting the WFI rinsate, the spiked WFI was poured into the ultrafiltration apparatus and filtered at room temperature. The WFI rinsate and the filtered/spiked WFI sample were immediately analyzed by DCM extraction followed by GC-MS.
Ionic Species: Approximately 60 g of WFI was spiked with ∼950 ppb of formate and acetate anions and ∼4,700 ppb of the glycidyltrimethyl ammonium cation. After collecting the WFI rinsate, the spiked WFI was poured into the ultrafiltration apparatus and filtered at room temperature. The WFI rinsate and the filtered/spiked WFI sample were immediately analyzed by IC.
Formaldehyde: Approximately 100g of WFI was spiked with ∼200 ppb of the formaldehyde. After collecting the WFI rinsate, the spiked WFI was poured into the ultrafiltration apparatus and filtered at room temperature. The WFI rinsate and the filtered/spiked WFI sample were immediately analyzed by LC-DAD.
Silicon: Approximately 55 g of WFI was spiked with ∼200 ppb of silicon standard solution. After collecting the WFI rinsate, the spiked WFI was poured into the ultrafiltration apparatus and filtered at room temperature. The WFI rinsate and the filtered/spiked WFI sample were immediately analyzed by ICP-AES.
Results and Discussion
1. Screening Analysis for the Quantitation of Potential Leachable Compounds Introduced During the Manufacturing Process
The goal of the screening analysis was to quantify the potential leachable impurities. The control blank (WFI rinsate) and the filtered BDS were analyzed for VOCs, SVOCs, NVOCs, ionic species, formaldehyde, and silicon.
Volatile, Semi-Volatile, and Non-Volatile Organic Compounds
The WFI rinsate and filtered BDS samples were analyzed to determine the presence of VOCs using SPME coupled with GC-FID.
Table IV shows the level of VOCs detected in the WFI rinsate and the filtered BDS sample solutions, with the elevated VOCs shown in bold type. Isopropanol was detected at 120 ppb in the WFI rinsate. This finding was anticipated, as this solvent is commonly used for laboratory sanitization purposes and it may have been an environmental contaminant rather than an impurity originating from the filtration apparatus.
Screening Analysis of BDS for VOCs, SVOCs, and NVOCs
For the filtered BDS sample, ethanol, acetone, and isopropanol were the only organic contaminants detected, at concentrations of 5600, 300, and 5300 ppb, respectively. The results indicated that these impurities may have been introduced into the manufacturing stream by single use disposable supplies such as the PVDF filters and the phenyl sepharose resin.
The WFI rinsate and the filtered BDS samples were analyzed to determine the presence of SVOCs and NVOCs using solvent extraction followed by GS-MS analysis. As shown in Table IV, the analysis of the WFI rinsate for SVOCs showed that traces of 3,5-dimethyl benzaldehyde were present in the WFI rinsate. These traces most likely originated from the Amicon® filtration apparatus. However, no methylene chloride extractable SVOCs or NVOCs were detected in any of the samples.
Ionic Species
The WFI rinsate and the filtered BDS samples were analyzed using IC to determine the presence of ionic species. As shown in Table V, six ionic contaminants were detected in the WFI rinsate sample analyzed in this study: chloride (49 ppb), sulfate (35 ppb), sodium (160 ppb), ammonium (8 ppb), potassium (7 ppb), and calcium (7 ppb). In order to establish if these contaminants originated from the filtration device or if they were part of the WFI composition, a sample of unfiltered WFI was analyzed. The results showed all the species were detected in the unfiltered WFI at approximately the same concentration, indicating that these species were not present in the membrane used for the filtration apparatus.
Screening Analysis of BDS for Anions, Cations, Formaldehyde, and Silicon
As expected, the only species present in the BDS sample were sodium and chloride ions as they are part of the buffer solution.
The WFI rinsate and the filtered BDS samples were analyzed using IC to determine the presence of acetate and formate. The data collected showed that these organic acids were not present in either sample.
Formaldehyde and Silicon
The WFI rinsate and the filtered BDS samples were analyzed using LC-DAD to determine the presence of formaldehyde. This species was not detectable in either sample.
The WFI rinsate and the filtered BDS samples were analyzed using ICP-AES to determine the presence of silicon. As shown in Table V, silicon was not detected in the WFI rinsate sample used as background check for leachable species originating from the filtration unit and the environment. However, this compound was detected in the BDS sample at the concentration level of 150 ppb.
This contaminant may have leached into the BDS solution from the silicon rubber platinum-cured tubing used in the manufacturing process of the BDS.
2. Spike-Recovery Study of Spiked BDS and Spiked WFI
The goal of the spike-recovery study was to confirm that potential leachable compounds are not lost during the sample preparation. These analytical methods can be used to quantify the leachable compounds in the BDS. Moreover, this study verifies that the 13 potential leachable compounds will not form a complex with the protein in the BDS, which may cause an undesired change in the final drug formulation.
For the purpose of the study, the acceptable recovery range for each leachable was within 75%–125% and, for those species that showed recovery outside that range, an additional investigation was performed. The analytical result for those low recovery compounds will be corrected by the percent recovery for evaluation.
Volatile Organic Compounds
Ethanol, acetone, isopropanol, epichlorohydrin, and toluene were the VOCs spiked in the BDS solution. The solution was then filtered and the concentration of these compounds after the filtration was determined by SPME and GC-FID analysis. Table VI shows the recovery data for the BDS sample after the filtration procedure at room temperature. Ethanol, acetone, isopropanol, epichlorohydrin, and toluene recoveries in BDS were 37%, 50%, 50%, 51%, and 14%, respectively.
To increase the recovery of epichlorohydrin and toluene, the spike recovery study for these compounds was repeated at a lower temperature by cooling the filtration apparatus in dry ice. This approach did not improve the recovery of the two VOCs, as their recovery was 47% and 14%, respectively. The recovery of the five VOCs spiked in the solution may depend on the following factors: VOC-protein interaction, VOC-cellulose membrane interaction, volatility and solubility of the VOCs, set-up of the filtration apparatus, and length of filtration time.
The influence of the VOC–protein interaction factor on the recovery was investigated by spiking toluene in the protein-free BDS sample. The recovery of toluene was 28%, which is comparable to that observed for this species spiked in the presence of the protein. Therefore, the VOC-protein interaction most likely does not affect the recovery process.
The VOC-cellulose membrane interaction may have a partial influence on the recovery of the five solvents because the membrane may non-specifically bind or trap the VOCs.
The low recovery of these species may be due primarily to their volatility, their low miscibility with the aqueous buffer combined with the filtration set-up, and the time required for the filtration process. Because the headspace of the system was significantly high (i.e., the filtration device had approximately half of its volume occupied by the BDS solution) and the sample was flushed with nitrogen at high pressure for about an hour, the five VOCs may have percolated out of the headspace and dispersed during the filtration process.
In order to establish if the process was influenced by the nature of the BDS solution, the spike recovery experiment was performed using WFI as the model solution to determine the recovery of the 13 leachable compounds in the absence of the drug protein. As shown in Table VI, the percent recovery of spiked WFI for ethanol, acetone, and isopropanol was 91%, 81%, and 100%, respectively, whereas the percent recovery for epichlorohydrin and toluene was again below 50%.
In this experiment, the filtration process for spiked WFI required approximately 20 min (the filtration of the BDS sample required 1 h) due to the absence of the protein. This factor, together with the high solubility of ethanol, acetone, and isopropanol, significantly improved recoveries in the WFI. The yield for epichlorohydrin and toluene did not improve, primarily due to their low solubility in the WFI as well as their high volatility. Therefore, this experiment suggested that the set-up of the filtration apparatus and the time required for the filtration process might affect the percent recovery of the five VOCs when spiked in the BDS sample. More importantly, this also indicated that the five VOCs do not form a complex with the protein and therefore affect the final formulation of the drug.
Spike Recovery Study of BDS and WFI
Semi-Volatile Organic Compounds
Table VI shows the recovery data of the SVOCs for both BDS and WFI samples after the filtration procedure at room temperature. Also in this case, caprolactam, 3-phenoxy-1,2-propanediol, and 2,4-di-tert-butyl phenol were spiked in the BDS solution. The solution was then filtered and the concentration of these compounds after the filtration was determined by solvent extraction and GC-MS analysis. Caprolactam, 3-phenoxy-1,2-propanediol, and 2,4-di-tert-butyl phenol recoveries in BDS were 115%, 120%, and 11%, respectively.
The effect of volatility and solubility of 2,4-di-tert-butyl phenol, the set-up of the filtration apparatus, and the length of filtration time were investigated again using WFI as the model solution to determine the cause of the low recovery of this species. Caprolactam, 3-phenoxy-1,2-propanediol, and 2,4-di-tert-butyl phenol recoveries in WFI were 85%, 113%, and 47%, respectively.
The recovery results for the WFI confirmed the data collected for the spiked BDS solution with only a slight improvement in the recovery of 2,4-di-tert-butyl phenol. As the volatility of this compound is similar to that of 3-phenoxy-1,2-propanediol (the retention times are very close), only the solubility of the compound, the set-up of the apparatus, and the time required for the filtration process might affect the percent recovery.
Ionic Species
For the spike-recovery study of acetate, formate, and glycidyltrimethyl ammonium ions, the spiked BDS sample recoveries were 95%, 100%, and 78%, respectively. As shown in Table VI, the recovery of the three ions in both BDS and WFI samples were within the range of 75–125%.
Formaldehyde and Silicon
For the spike recovery study of formaldehyde and silicon, the spiked BDS sample recoveries were 100% and 80%, respectively. As shown in Table VI, the recovery of two compounds in both BDS and WFI samples were within the range of 75–125%.
Conclusion
This study showed that a step-by-step leachable evaluation of product-contact materials used for the manufacturing of a drug can be successfully performed based on a thorough knowledge of the process stream information and by assessing the probable product-contact materials that may leach into the final product.
The product-contact materials review allowed for the determination of the appropriate analytical methods for screening the BDS sample for VOCs, SVOCs, and NVOCs, anions, cations, and trace metals. The 13 compounds specific to the production process were analyzed by spike-recovery study in order to validate the analytical methods.
Ethanol, isopropanol, sodium, and chloride were the only extractable species detected at ppm levels in the filtered BDS sample. Sodium and chloride are constituents of the buffer composition and were expected to be detectable. Ethanol and isopropanol might have been introduced into the manufacturing stream by single-use disposable supplies such as the PVDF filters for isopropanol and the phenyl sepharose resin for ethanol. These residual solvent concentrations are well within the ICH limit for final drug product daily exposure.
The analytical methods were qualified in order to ensure that potential leachable compounds were not lost during sample preparation. Spike recovery experiments were completed for the 13 leachable contaminants identified in Table III for both the BDS and WFI (used as model solvent), showing that the recoveries for all species spiked into the BDS were either equal to or slightly lower than the recoveries from the spiked WFI samples as shown in Table VI. This data strongly suggests that these analytical methods can be used to quantify the level of leachable contaminants in the BDS. The potential leachable compounds show no significant loss during sample preparation. Moreover, the presence of the protein does not affect the recovery of the 13 potential leachable contaminants. Therefore, the potential leachables do not represent a potential risk to BDS safety and stability.
Acknowledgments
The following individuals were part of the project team and contributed to the success of this project.
Samantha Tan, Technical Director, Applied Materials
Mark Eitel, Lab Manager, Applied Materials
Emerson Chau, Process Engineer, VaxGen, Inc.
Stephen Decker, Associate Director of Production, VaxGen, Inc.
Dr. Sridhar Reddy, Associate Director of Fermentation, VaxGen, Inc.
Haihwa Kao, Director of QC, VaxGen, Inc.
Vincent Wu, Consultant, VLW Associates
Robert Baird, Senior Consultant, Pacific BioDevelopment, LLC
Footnotes
- © PDA, Inc. 2009


