
Abstract
Cleanroom microflora are of importance for microbiologists and quality control personnel in order to assess changes in trends. Shifts in the types of microflora may indicate deviations from the “norm” such as resistant strains or problems with cleaning practices. Given the few published studies of the typical microflora, this paper uniquely reviews over 9000 microbial isolates from a range of different grades of cleanroom. The paper concludes that the typical flora are primarily those associated with human skin (Gram-positive cocci), although microorganisms from other sources such as the environment (Gram-positive rods) and water (Gram-negative rods) are also detected, although in lower numbers.
LAY ABSTRACT: It is of importance that pharmaceutical manufacturers and healthcare pharmacies review the types and numbers of microorganisms found within their clean areas. Such examination should be carried out over a long period of time so that the complete picture can be revealed. This is important in order to understand if certain species are being recovered pose a product or environmental risk and to check if the cleaning and sanitization practices are effective.
Introduction
Studying the range, types and patterns of microorganisms found in cleanrooms (the collective “microflora”) can provide essential information for microbiologists and quality control personnel in understanding cleanroom environments and for assisting with contamination control. This helps to establish a “norm” and provide a measure for trending purposes (such as noting the frequency of occurrence of isolates by genera or species over time and across cleanrooms or locations within cleanrooms) (1). Furthermore, the need for microbial identification is detailed in a number of pharmacopoeial chapters in both the European Pharmacopoeia and in the USP. USP Chapter 〈1116〉 addresses establishing the normal microbial flora and using microbial identification to assess the effectiveness of the cleaning and sanitization program and to investigate the source of microbial contamination, especially when environmental monitoring action levels are exceeded (2). There is, however, no direct reference to trending, although characterizing cleanroom microflora should form part of current good manufacturing practice (GMP) (3, 4).
Notwithstanding the importance of such information, there have been very few studies of pharmaceutical cleanroom microflora published in recent years. Despite the low number of published analyses, such studies can prove to be very useful for microbiologists in benchmarking the types and frequency of incidence of the more common microorganisms likely to occur in cleanrooms. This is an important feature of ensuring good microbiological control. Most importantly, examinations of the microflora allow microbiologists to make comparisons with their own data against that collected from similar organizations.
The microbial ecology of the human body is complex, and many of the species of microorganisms that form the microbiota are unknown (5). There is considerable diversity of species and variation between different locations on the body and across individuals over time (6). Nevertheless, there are some genera of bacteria which are generally represented (7, 8). When research of the bacteria biota of human skin is compared with published work of cleanroom microorganisms, there is an association between the microorganisms commonly found in cleanrooms and those which are transient to (short-term or long term-residents on) human skin (9, 10). In addition other types of microorganisms present in cleanrooms, such as Bacillus spp. (11), are those present in soil. Such microorganisms may be transferred into the cleanrooms via personnel, dust, and material transfer (12, 13). Occasional, low-level incidences of microorganisms resident within the human body can also be detected. In lower-grade cleanrooms, where there is a water source, some microorganisms associated with water systems will be detected (albeit often in relatively low numbers; otherwise the cleaning and sanitization regime may be considered to be ineffective) (14). In relation to this general profile there are commonly considered to be four main sources of microbial contamination (12, 13):
People
Room surfaces
Room air
Water (where applicable)
The most common microorganisms in cleanrooms are Gram-positive bacteria. These microorganismsoften have a close phylogenetic affiliation as indicated by comparative analysis of partial 16S rDNA studies (16) (such as between the Micrococci and Staphylococci) (17). In addition, there are, in fewer numbers, certain fungi associated with cleanrooms. Cleanroom microfloraare predominantly of Gram-positive bacteria (17). Common species commonly include (17–21)
Micrococcus spp.
Staphylococcus spp.
Corynebacterium spp.
Bacillus spp.
Aspergillusspp
Pencillin spp.
With the genera Staphylococcus and Micrococcus, many of the species are indigenous to humans (22). Although Gram-positive microorganism are ubiquitous in cleanrooms and make up the overwhelming majority of isolates, there is little published work relating to the expected proportion of microorganisms found in cleanrooms, except that the majority isolated are Gram-positive cocci (17, 20).
The vast majority of bacteria isolated from cleanrooms are mesophilic aerobic or facultatively aerobic bacteria. Where specialist gases are used, and sometimes in association with freeze dryers, bacteria that can grow and survive in anaerobic conditions may be found. With thermophiles and extremotolerant bacteria, the literature suggests that occurrences of such microorganisms in standard cleanrooms are very infrequent, if existent at all (23). With fungi specifically, a review by Bartnettet et al. in 2007 (24) concluded that the most common fungi in cleanrooms are Aspergillus, Penicillium, and Trychophyton.
Microorganisms will be recovered from cleanrooms, even those of more stringent classifications and where personnel are fully gowned, where masks and full body covers are worn, aseptic technique is practiced, and there is no water source (25). Given that the outer layer of the human skin can host up to 1 × 10⁶ microorganisms per square centimeter (26), it is not unexpected to detect low numbers of microorganisms in cleanrooms (27, 28).
In accepting the arguments for the need to trend cleanroom microflora, this paper sets out to set a benchmark from long-term studies of two groups of cleanrooms. The first group are Grade B (equivalent to ISO 14644 class 7 dynamic) cleanrooms (some of which contain Grade A/ISO class 5 cleanzones); and the second group are Grade C (ISO class 8 dynamic) and Grade D (ISO class 9 dynamic) cleanrooms. In the U.K., cleanrooms used for the pharmaceutical manufacturing of blood and plasma products are all located in England and Wales.
Limitations
There are two significant limitations with any type of microflora review. The first relates to the type and locations of the cleanrooms. All cleanrooms differ in design and function, and with the types of products processed. The type of cleanroom, including whether it operates at EU GMP Grades A, B, C, or D, will have an impact upon the range of microorganisms recovered. Here there will be differences with the temperature and humidity of the cleanroom, whether there is a water source, the number of personnel present, and so on (15). Furthermore, the geographical location of the cleanrooms is also a factor. While these limitations are accepted, this paper attempts to provide a benchmark by dividing the analysis into Grade A and B areas (ambient temperature with no water source), and Grade C and D areas (with some water sources).
The second limitation relates to the microbial identification method. The key variables here are the size and scope of the databases used to compare cleanroom isolates and the types of methods used for analysis (whether the method is phenotypic or genotypic, and then the various technological variations of these methods). The database determines which microorganism will be characterized once all of the required tests have been completed. Many identification systems have databases that are biased towards medical microbiology and are more limited with respect to industrial and pharmaceutical microbiology. This limitation is acknowledged and, although reference is made to different species in this paper, greater importance should be given to the genera of the microorganisms.
Microbial identification methods are usually separated into two general categories, those that examine genotypic characteristics (relating to the microorganisms genetic makeup, including the nature of the microorganisms constituent nucleic acids and genes); and those that examine phenotypic characteristics (based on the microorganisms observable characteristics) (29). With respect to the type of identification system, the gradual shift towards genotypic molecular identification methods is leading to the characterization of species hitherto unrecorded or previously misidentified (30, 31). Although genotypic methods, involving DNA sequencing, have been in development since the mid-1970s (32), the use of genotypic identification systems for routine laboratory identification is a 21st century application. Identifications using genotypic systems are considered more accurate than phenotypic methods because phenotypic methods are influenced by factors which impact upon the microbial cell, such as temperature, age of the culture, growth medium and so on; whereas, in contrast, the analysis of microbial DNA is less influenced by environmental factors (33). Nonetheless, in the author's experience phenotypic methods remain, for the time being at least, the most commonly used in pharmaceutical microbiology laboratories.
In analysing microflora data a limitation could, therefore, be the shift between phenotypic and genotypic characterizations during the period of collecting data. This issue is partly unavoidable, although the vast majority of microorganisms were identified using phenotypic methods. There are other limitations that could be considered in relation to different sampling techniques and in relation to seasonality. While such considerations are undoubtedly of interest, they are not pursued further in this paper.
Microbial Taxonomy
One difficulty with a long review of microflora is the potential for the reclassification of microorganisms. (This is through the Committee on Systematics of Prokaryotes, who operate a list containing in excess of 22,000 names. For a microorganism name or new or a re-classified species to be accepted it has to be approved by the Judicial Commission of the International Association of Microbiological Societies and be accepted in an approved publication.) A microorganism may be known by one species name at one point in time and then subsequently reclassified as another species. While there are various sources for bacterial taxonomic systems, arguably the most influential is Bergey's Manual (34). Bergey's Manual characterizes microorganisms based on phenotypic characteristics in conjunction with information gathered from mapping phylogentic differences derived from ribosomal DNA sequencing. Each of the microorganisms characterized in this paper has been referenced in Bergey's Manual.
Samples
The cleanrooms examined in this report represented
40 Grade B cleanrooms (of which five had Grade A cleanzones)
35 Grade C cleanrooms
20 Grade D cleanrooms
The cleanrooms were located in various pharmaceutical establishments in England and Wales used for the manufacturer of blood and plasma products. The data was gathered between 2001 and 2009. Each of the microbial isolates from the study was recovered using soya-bean casein digest medium (commercially prepared trypticase soya agar). This is a general growth medium and suitable for most common industrial and environmental microorganisms. The environmental monitoring plates were incubated at a temperature 30–35°C for not less than 2 days followed by a temperature of 20–25°C for not less than 5 days. It is recognised that the microorganisms profiled are only those which will grow on this culture medium, at the selected incubation temperature, and within the duration of the selected incubation time. No selective culture media were used. A variety of conventional techniques (35) were used to take the samples, namely:
a) Active, viable air sampling using volumetric air samplers
b) Passive air sampling using settle plates
c) Swabs
d) Finger plates, taken from the gloved hands during filling operations
e) Contact plates, from surfaces or from personnel
It stands that conventional environmental monitoring techniques can only detect a small portion of what is actually present in cleanrooms (36). This is due to the limitations of environmental monitoring methods, and because many bacteria, although maintaining metabolic activity, are non-culturable due to their physiology, fastidiousness, or mechanisms for adaptation to the environment (23, 37). Some research suggests that less than 10% of bacteria found in cleanrooms are culturable (23). The term viable but non-culturable is often used to describe these microorganisms (38). Nevertheless, given the use of conventional environmental monitoring methods, the microorganisms detected will be representative of the common microflora present.
Data Review
Grade A and B Cleanrooms and Cleanzones
With the Grade A and B clean areas 6729 isolates were recovered. Species-level identification was not performed for all isolates due to occasional loss of cell viability or due to invalid identification or where the identification kit test result was one of low discrimination. The pattern of the results was as expected according to the literature (17, 39, 40). In terms of morphological type and differential staining, 97% of the isolates were Gram-positive microorganisms (of which 81% were Gram-positive cocci, 13% were sporing rods, and 3% non-sporing rods), 2% were Gram-negative microorganisms, and 1% were fungi. The ratio between these populations remained relatively consistent over time. The distribution of isolates is shown in Figure 1.
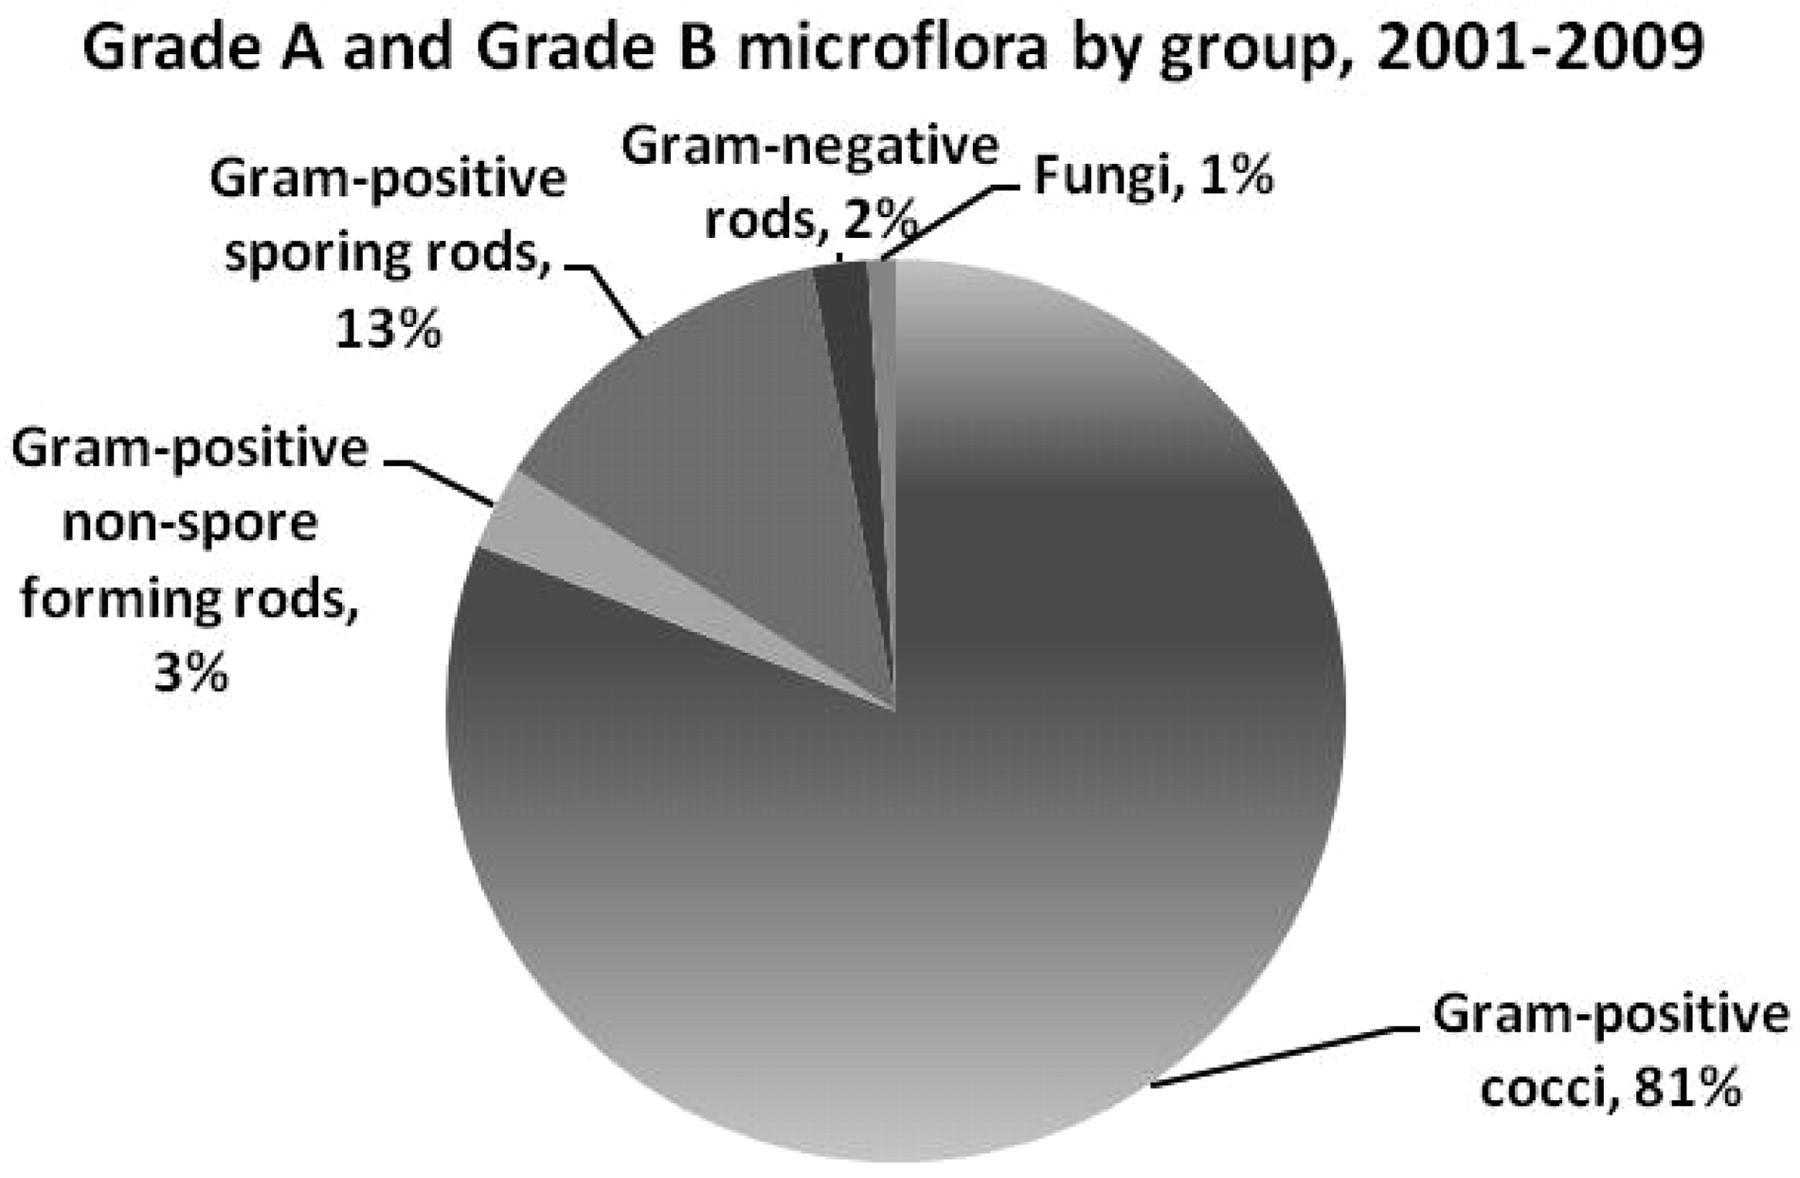
Piechart showing distribution of Grade A and Grade B cleanroom isolates by type.
Major Genera
Microorganisms recovered were represented by six main genera. Table I list the proportion of each genera of microorganism recovered.
Categorization of Isolates into Major Species Genera, 2001–2009
Table I indicates that skin-related microflora represent the most common genera isolated, with the family Micrococcaceae (the collected term for the genera Micrococci and Staphylococci) representing >50% of the isolates. The second most common genera are species of Bacillus (and related genera) at 13% of the isolates. A low number of Gram-negative bacteria were detected across the cleanrooms. Although these are unexpected in areas with no water sources, a low number may be transferred from changing rooms or relate to personnel hygiene issues (such as coughing or sneezing).
The major taxonomic groups in Table I provide an indication of the relatively limited diversity of Grade A and B clean area microflora. Furthermore the majority of recovered microorganisms fell within one of the six genera (Table II).
Number of Isolates Falling into One of the Six Main Genera
The significance of presenting the data in Table II is that it provides an indication of the diversity of different genera. The closer the figure is to 100%, then the lower the level of species diversity. Arguably the ideal situation for cleanroom control is little diversity and a relatively static microflora, for a change could signal the development of resistant strains or contamination arising from unknown or unusual sources. The common trend from Table II is for approximately ∼80% or more of all isolates to fall within the major genera. This suggests that the isolation of new species is relatively rare.
Major Species
The ten most commonly occurring species, from the total of 6729 identified microorganisms is displayed in Table III.
Table of the Ten Most Commonly Occurring Species
The table of the ten most prevalent species indicates that genera of Gram-positive cocci that inhabit the air and skin: Micrococcus luteus and Micrococcus lylae, two obligate aerobes, are the most commonly identified microorganisms. The Gram-positve cocci account for eight of the top ten isolates and represent 57% of all of the isolates from the higher-grade cleanrooms. This finding is again consistent with the earlier analysis by morphological type and genera. Other than the Gram-positive cocci, the other microorganism in the table are Gram-positive sporing rods. Given that such microorganisms can be carried into clean areas on footwear or by equipment transfer, a low level is not unexpected. The key concern with such microorganisms is their consistency recovery within a short duration of time or on successive occasions, as this may indicate inadequate cleaning practices.
The distribution of the most common species also demonstrated a consistent pattern over time. In Table IV, species have been broken down as year-by-year totals for the period 2001–2009.
Variation in the Recovery of Different Species over Time
The data reflects the patterns seen earlier in that Micrococcus luteus was the most commonly represented microorganisms over the 9 year period, followed by other Gram-positive cocci. What is most interesting from the table is that the species distribution patterns are generally consistent. Shifts between different species of Micrococcus most probably relate to small variations in the phenotypic identification techniques employed by different laboratories and are not of significance in terms of unusual patterns or shifts in the overall microflora.
Different Sample Types
The above data provides a broad overview of the trends of the microorganisms over the 9 year period across a range of Grade A and B clean areas. The analysis can be furthered by considering how the distribution of microbial species relates to different types of samples. This analysis was not available for all of the different types of isolates; thus a more limited sample set is presented. Furthermore, due toall of the isolates not being speciated, the data is presented by morphological type.
For example, the data can be subdivided into surface samples and air samples; finger dabs and exit cleanroom suit (gown) contact plates.
With surface samples, 340 isolates were available for analysis, and with air samples, 1564 isolates were available for analysis. The isolates conformed to the morphological types indicated in Table V.
Subdivision of Surface Sample and Air Sample Isolates by Morphological Type
With finger dabs, 424 isolates were available to be examined, and with suit plates, 362 isolates were analysed. The isolates conformed to the following different morphological types (refer to Table VI).
Subdivision of Finger Dab and Suit Plate Isolates by Morphological Type
With this sample set of recovered microorganisms, Gram-positive microorganisms represent the majority of the isolates and again the Gram-positive cocci predominate. This is unsurprising given the earlier data. Beyond this there are some interesting observations in that Gram-positive cocci occur most frequently within air samples. This is consistent with personnel in cleanrooms being the primary source of contamination and that people will shed skin flakes and thus skin-based flora are the most likely types of microorganisms to be found in the air (either free-floating or more probably attached to skin or dust particles). With surfaces, the distribution between Gram-positive cocci and Gram-positive rods is slightly closer, with a 34% occurrence of Gram-positive rods (of which 6% are spore-bearing microorganisms). This data is more consistent with literature which suggests that Gram-positive rods can be transported into clean areas through dust or via equipment (12, 13). With the personnel-related samples (finger dabs and suit contact plates) the numbers of Gram-positive cocci remain high, which is consistent with the association of such microorganisms with skin cells. The numbers of Gram-positive rods are proportionately higher than for air and surface samples, which may suggest a tendency for personnel to touch surfaces. The numbers of Gram-negative rods and fungi, across each category, remain very low, which is expected for higher-grade cleanrooms.
Grade C and D Cleanrooms
With the Grade C and D clean areas 2500 isolates were characterized between 2001 and 2009. The pattern of the results displayed far greater variety compared with the Grade A and B areas examined above. This was partly a reflection of the lower grade and level of control, plus a higher personnel presence, and a reflection of the fact that many of the cleanrooms contained a water source (such as sinks and water outlets connected to equipment) or were located adjacent to such areas.
Major Genera
Microorganisms recovered were represented by six main genera. Table VII displays the proportion of each genera of microorganism recovered.
Categorization of Isolates into Major Species Groups, 2000–2009
The main taxonomic divisions (illustrated in Table VII), indicates that the Gram-positive microorganisms represent the majority of the isolates (averaging at 78% when all 2500 isolates were considered). Of these, the skin-based flora represent the majority of the isolates and thus a parallel can be made with the results from the Grade A and B cleanrooms. Irrespective of cleanroom grade, microorganisms associated with personnel represent the primary source of contamination in cleanrooms. The numbers of Gram-positive rods are relatively higher in Grade C and D cleanrooms, indicating the greater opportunities for such microorganisms to be transported into cleanrooms. Unlike Grade A and B clean areas, where many items entering the cleanrooms would have been subject to some type of sterilization, equipment entering lower-grade cleanrooms is often subject to less stringent controls. The proportion of Gram-negative rods are indicative of the water sources and the extent that contamination can be transferred from water aerosols onto surfaces and of some of the problems that can arise if puddles of water are not dealt with promptly.
Major Species
The primary species recovered are listed in Table VIII.
Categorization of Isolates into Major Species Groups
Table VIII details the major species recovered from the Grade C and D areas. Here the diversity of isolates is greater than that determined for the Grade B areas examined earlier. Within the Gram-positive microorganisms recovered there exists a division between rods and cocci. Lower down on the list, different types of Gram-negative rods associated with water are recorded.
Analysis by Sample Type
The Grade C and D microflora distributed by sample type is presented in Table IX.
Categorization of Isolates by Sample Type
The data in Table IX indicates that a higher proportion of Gram-positive cocci are recovered from air samples than from surface samples, and this group remains the most commonly recovered from both sample types. This is consistent with the findings from the Grade B area and is consistent with the literature whereby personnel will shed such microorganisms (41, 42). Gram-positive rods occur in slightly higher numbers for surface samples. This proportion is consistent with the theory that the majority of Gram-positive rods will be carried or deposited from footwear, especially through the transmission of soil or from incoming materials or equipment. The higher proportion of Gram-negative rods in the air probably relates to the operation wet areas and washbays. Although water can remain on the floor, it is more common for aerosols to be produced (either through equipment operation or by splashing). The data suggests that incidents of fungi are very low and there is no bias towards the recovery of fungi from any sampling method.
Differences between Grade C and D Areas
For Grade C and Grade D areas the proportion of isolates by morphological group is shown in Table X.
Grade C and D Microflora by Morphological Type
Table X indicates that Gram-positive coccci make up the majority of both Grade C and Grade D microflora. With Grade C areas, the second highest proportion is with Gram-positive rods (of which non-spore bearing rods are the larger category). Gram-negative rods make up only a far smaller part of the proportion, which probably relates to the fewer water sources in these types of cleanrooms (generally confined to equipment connections). Similarly, the incidences of fungi are very low. With the Grade D cleanrooms, Gram-negative rods make up a far larger proportion of the isolates. This probably reflects the greater number of water sources found in these areas (sinks and wash-bays). Furthermore, the incidences of fungi are higher, which could also reflect the higher humidity in some of the cleanrooms. This data suggests that the grade of the cleanroom, where this relates to a different use, can result in a different microflora profile.
Discussion
This paper has centred on the characterization and trending of cleanroom microflora. Over a 9 year period >9000 isolates were examined. The objective was to provide a benchmark of typical cleanroom microflora, noting some of the exceptions and limitations with such data as discussed earlier. The data has indicated that across all grades of cleanroom the microorganisms associated with personnel and which are likely to be shed associated with skin flakes are the most common. These are the Gram-positive cocci: the Micrococci and Staphylococci. The second largest group are the Gram-positive rods, with lower incidents of Gram-negative rods and fungi. Gram-negative rods tend to occur where water sources are present in lower grade cleanrooms. These findings, particularly in relation to the incidences of Gram-positive cocci and Gram-positive rods, provide empirical support for the more theoretical literature on cleanroom microflora (17, 39, 40).
There are some issues that warrant further discussion from this review. These relate to how representative the data is and what can be done with the data. One issue that could be levelled at the data collated in this paper relates to the reliability and representativeness of the findings. The cleanrooms were under-represented in terms of Grade A zones, and all of the cleanrooms were located in the United Kingdom. It can be argued that the results are only applicable to the manufacture of certain types of products in certain geographical locations. This was overcome partially by surveying a range of different grades of cleanrooms, and the data collated bears a strong resemblance to that of earlier studies and published work (17–20). In particular, Johnson notes that the types of microorganisms recovered from cleanrooms in the USA and Europe are very similar and would typically be Staphylococcus hominis, Staphylococcus epidermidis, Micrococcus spp., Bacillus spp., and yeast, from an aseptic processing area (21). These findings are not dissimilar from the data presented in this paper. With the issue of the advancement of genotypic molecular methods (such as DNA extraction, amplification of 16S rRNA genes, and cloning) and more recent publications on the microbial characterization of skin and environmental bacteria (5, 6, 9, 10)—while such findings indicate that bacterial diversity observed in cleanrooms is much broader than expected based on phenotypic identification methods, the findings presented in this paper nevertheless show commonality with such studies in terms of the different genera of bacteria and their probable origins (resident or transient to the people working within cleanrooms).
In terms of interpreting the findings, collating data relating to cleanroom microflora serves no real purpose beyond general academic interest unless something meaningful can be done with data. Also of importance is the context. Identifying a different species of Staphylococcus means little, whereas finding a Pseudomonad-like microorganism in a Grade B cleanroom means much more and has a far greater impact. The key aspect is relating the data to contamination control. Consistency with the microflora, especially where there is a predominance of Gram-positive cocci, is indicative that the cleanroom continues to function within the norm, whereas changes with the microflora may indicate concerns with cleaning and disinfection. The key emphasis should be on trending. For more specific analyses, comparing different microflora (such as between a Grade A and Grade B area) may help with batch-specific decisions, such as demonstrating if any contamination could have been transferred from the Grade B area into the Grade A zone. While the identification is important, microbiologists must not lose sight of the numbers and frequency of microorganisms isolated.
Another application of the data relates to the quality control of culture media. Although there are arguments for and against the use of environmental isolates for media growth promotion, it is often a regulatory expectation that isolates form part of media testing regimes. Thus the common microflora can be used to select representative microorganisms for the nutritive properties testing of culture media.
In drawing together the data trends and data interpretation, this paper has attempted not only to provide a benchmark for microbiologists to compare the cleanroom microflora in their facilities to, it has also attempted to explain why and when the characterization of microflora is important and what that data means for pharmaceutical quality control personnel.
Conflict of Interest Declaration
The author is a volunteer committee member of Pharmig but has no financial interest in the organization.
Acknowledgements
The author would like to thank the U.K. Pharmaceutical Microbiology Interest Group (Pharmig) for assistance with the preparation of this paper.
- © PDA, Inc. 2011
References


Jump to section
Related Articles
Cited By...
- Expanding the Use of Moist Heat for Terminal Sterilization
- Best Practices for Microbial Challenge In-Use Studies to Evaluate the Microbial Growth Potential of Parenteral Biological Products; Industry and Regulatory Considerations
- Establishment of a Single Temperature Incubation Approach for Environmental Monitoring Samples with Focus on Mold Recoveries
- Environmental and Personnel Monitoring Programs--A Risk-Based Case Study of Cutibacterium acnes
- Increasing Patient Safety by Closing the Sterile Production Gap--Part 3--Moist Heat Resistance of Bioburden
- Comparison of Different Incubation Conditions for Microbiological Environmental Monitoring
- Justification for the Use of Aseptic Filling for Sterile Injectable Products
- Comparison of Different Fungal Agar for the Environmental Monitoring of Pharmaceutical-Grade Cleanrooms