
Abstract
Regulatory authorities require proof that lyophilization (freeze drying) cycles have been developed logically and demonstrate uniformity. One measure of uniformity can be consistency of residual water content throughout a batch. In primary drying, heat transfer is effected by gaseous convection and conduction as well as the degree of shelf contact and evenness of heat applied; therefore residual water can be affected by container location, degree of container/tray/shelf contact, radiative heating, packing density, product formulation, and the cycle conditions themselves. In this study we have used frequency modulation spectroscopy (FMS) to create a map of headspace moisture (HSM) for 100% of vials within a number of freeze-dried batches. Karl Fischer (KF)/HSM correlations were investigated in parallel with the moisture mapping studies. A clear, linear relationship was observed between HSM and KF values for vials containing freeze-dried sucrose, implying a relatively straightforward interaction between water and the lyophilized cake for this material. Mannitol demonstrated a more complex correlation, with the interaction of different crystalline forms giving important information on the uniformity of the material produced. It was observed that annealing had a significant impact on the importance of heat transfer by conduction for vials in direct and non-direct contact with the shelf. Moisture mapping of all vials within the freeze dryer enabled further information to be obtained on the relationship of the formulation, process conditions, and equipment geometry on the intra-batch variability in HSM level. The ability of FMS to allow 100% inspection could mean that this method could play an important part in process validation and quality assurance.
LAY ABSTRACT: Lyophilization, also known as freeze drying, is a relatively old technique that has been used in its most basic form for thousands of years (e.g., preservation of fish and meat products). In its more advanced form it is used to preserve many medical products; for example, many vaccines are not stable in solution and therefore need to be dried to allow long-term storage. In order to produce a freeze-dried vaccine, a complex understanding of the processes and critical temperatures is required. Once these have been understood, the material is dried to give relatively low moisture content (e.g., 2% w/w.) This low moisture content is critical for the long-term stability of the product, allowing doctors/chemists to store these goods on site for use when required. This research paper provides further information on a technique called frequency modulation spectroscopy (FMS) that has been used to map the moisture variation across samples within a freeze dryer, enabling us to increase our understanding of the role various processing conditions play on the relationship between the product and water. It has demonstrated its potential application for 100% batch monitoring and the validation of a system or assessment of changes made. This method could assist in improving quality assurance and ultimately the final product that reaches the consumer.
Introduction
Freeze drying (lyophilization) is used to prolong the shelf life of material and is commonly used in the pharmaceutical, biotechnology, and food industries. The process involves removal of solvent (usually water) from a frozen material, and this takes place in three main stages. First, the product is frozen below its critical temperature(s); next ice is removed during primary drying by sublimation under vacuum. Finally, in secondary drying (typically at a higher temperature and lower pressure), most of the remaining unfrozen water may be desorbed under vacuum.
Efficient and successful freeze drying during the above stages relies on a careful balance of heat transfer from the temperature-controlled shelves to the product material. It is important to supply enough heat to cause sublimation of ice during primary drying, while not heating up the product above its critical temperature. Too much heat may cause the product to collapse, leading to poor product appearance and rehydration properties of the final dried material as well as possible damage to the active ingredients. Several factors play a role in effecting the degree of heat transfer during the freeze drying process; these are conduction, convection, and radiative heat. The level of conduction is affected by the degree of direct shelf contact, which can vary with container shape (particularly the flatness of the base), direct or non-direct contact of the container on the shelf (e.g., tray insert, well plate holder), with the container material itself also affecting the efficiency of the heat transfer. Pressure has a direct effect on the degree of gaseous convection, with higher pressures allowing more heat transfer due to the proximity and density of molecules, enabling a faster transfer of heat. Radiative heat is affected by the design of the freeze dryer, material used (absorbance and reflective capabilities), and shelf size.
One of the most important parameters to measure for a freeze-dried product is the moisture content. The residual water content of a lyophilized product is commonly measured in terms of total water. Karl Fischer (KF) titration, a well-established and U.S. Food and Drug Administration–recognized technique, is generally considered to measure the total water within the vial containing the freeze-dried cake, providing the sample is 100% soluble in KF medium.
KF titration is time-intensive and involves destruction of the sample. In contrast, frequency modulation spectroscopy (FMS) measures equilibrium free moisture in the headspace and is a non-destructive technique. The sample can be analysed in less than 5 seconds and the same sealed container may be reanalyzed over time. May et al. (1) stated “vapor pressure moisture data provides additional information on the state of dryness of the headspace of the final container vial” and that “this data complements residual moisture results obtained for the freeze dried cake.” Duncan et al. (2) have shown that a given amount of HSM can be correlated to the degradation of an active ingredient over a period of time. Lin et al. (3) studied the effect that the FMS laser had on a lyophilized protein formulation; this stability data indicated that laser exposure of the sample did not cause any significant adverse effects on the protein studied. This technique allows 100% inspection of a freeze-dried batch, providing a much larger data set compared to KF, where only a small subset of moisture data can be gathered with no possibility of being able to evaluate the location of the water within a sealed container of material. Studying the processing conditions and material types has allowed us to identify the relative importance of various factors and how they can vary with each set of conditions. This HSM method could potentially provide a useful technique for the validation of lyophilization cycles, assessment of equipment changes, scale-up, and product quality assurance.
Materials and Methods
This study was conducted using VCDIN6R clear tubular type 1 glass 6 mL vials (Schott, St. Gallen, Switzerland) and 20 mm diameter lyophilization, igloo-type, bromobutyl stoppers (FDW20Rts); these were manufactured by West Pharmaceutical Services and supplied by Adelphi Tubes Ltd. (Haywards Heath, UK). Sucrose was supplied by BDH (Poole, Dorset, UK), and D-mannitol was supplied by Sigma-Aldrich (Gillingham, Dorset, UK). Table I summarizes the material type, critical temperature, concentration, and fill volume.
Excipient Details
Freeze-Drying Microscopy
Freeze-drying microscopy was carried out with the Lyostat2 instrument (Biopharma Technology Ltd., Winchester, UK) to determine the applicable collapse (Tc) or eutectic (Teu) temperatures for the materials prior to freeze drying. Where Tc is noted, this is the temperature of the onset of collapse and thus represents the lower temperature limit of the event, as described in Table I.
Freeze-Drying Cycle Details
A number of freeze-drying cycles were completed with Virtis Genesis freeze dryers (models 12EL and 25EL, with 12 kg and 25 kg condenser capacities, respectively), both having a total shelf area of 0.5 m2 and equipped with Wizard 2 control systems. Cycles were conducted based on the critical temperatures of each solution. A conservative primary drying temperature was used to ensure any HSM variations were not due to partial collapse or microcollapse. Type T thermocouple temperature probes placed at the bottom of each vial were used to monitor the progress of each cycle and to indicate when primary drying was complete and the duration of secondary drying. At the end of each cycle, all vials were sealed under a pressure of 50 mTorr unless otherwise stated. The samples for moisture mapping were freeze-dried using a cycle that was based on observations of temperature probes placed in vials in direct contact. Table II gives a summary of the cycle parameters employed.
Cycle Details
Frequency Modulation Spectroscopy (FMS)
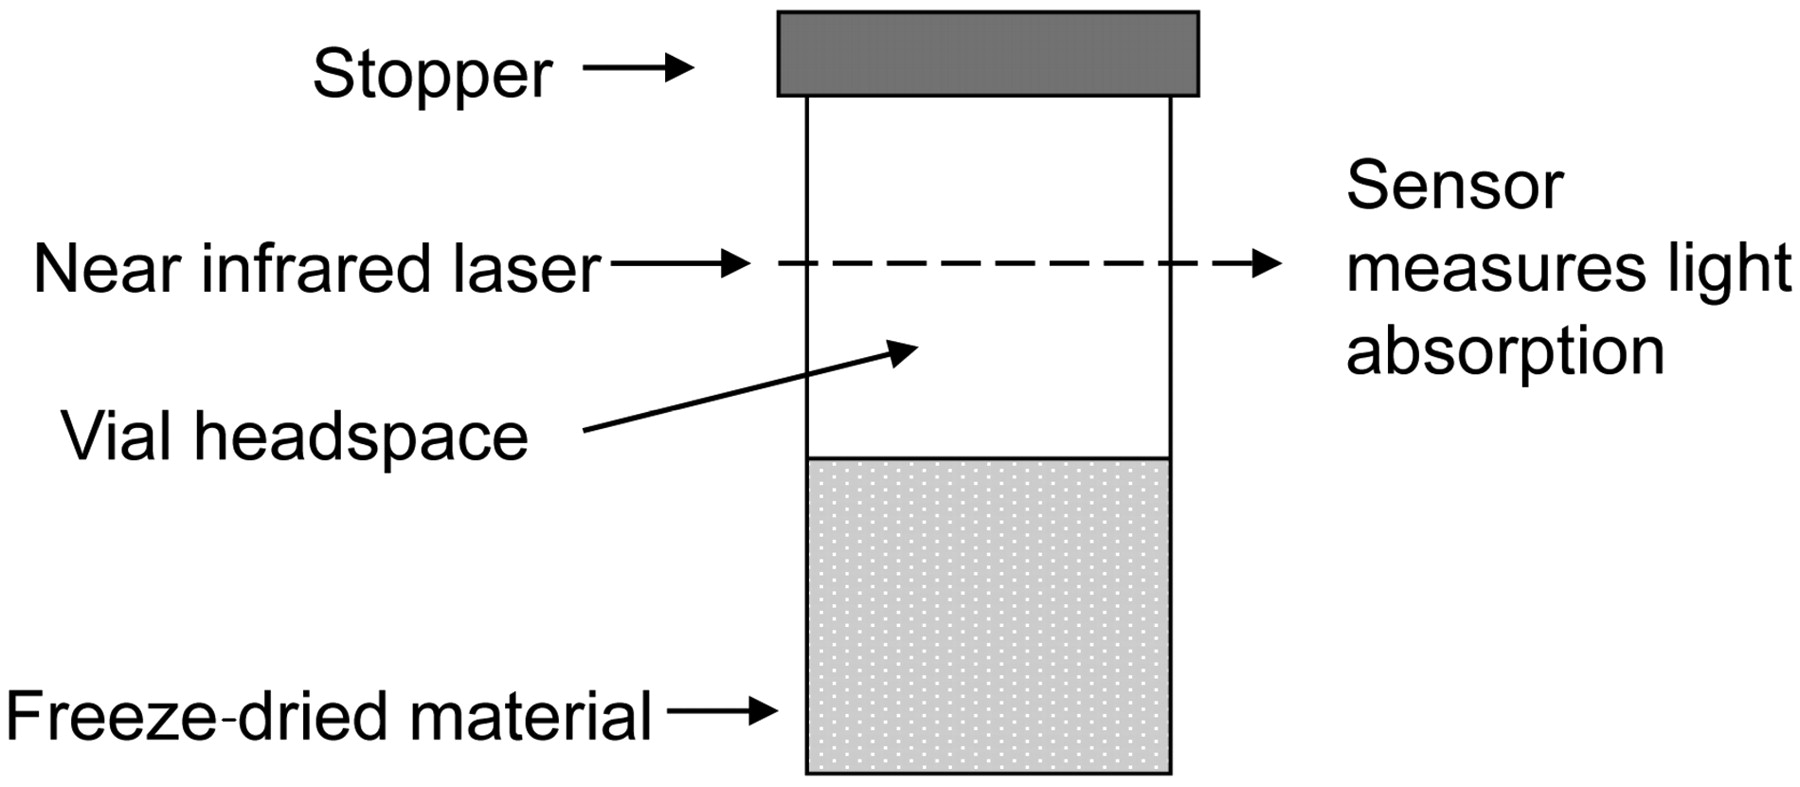
A benchtop FMS (FMS-1400, Lighthouse Instruments, Charlottesville, VA, USA) enables the measurement of water and pressure within the headspace of the vial (Figure 1). The laser is tuned to match the internal absorption frequency of a water molecule at 1400 nm. The amount of laser light absorbed is proportional to the water vapour concentration and the absorption width of the signal is proportional to the pressure. HSM values are quoted as partial pressure in units of Torr. A nitrogen purge rate of 4.5 L/min was used for all analyses to remove signal noise contributed from background ambient moisture; this value is supported by Lin et al. (3). A set of moisture standards was manufactured by Lighthouse Instruments using the same vials used for freeze drying, whereby the neck of each vial was heated and formed into a tip to create a sealed ampoule. A more in-depth description of the fundamentals of frequency modulation spectroscopy is provided by Mahajan et al. (4).

Vial headspace measurement.
Karl Fischer (KF) Analysis
Coulometric KF (Cou-Lo Aquamax and Cou-Lo Compact, GRS Scientific, Ampthill, UK) was used to measure the total water within the freeze-dried cake. KF measurements were taken once monitoring showed FMS readings had become constant; the results are given as percent w/w water.
Differential Thermal Analysis (DTA) and Impedance Analysis
Differential thermal analysis (DTA) and impedance analysis was carried out with a Lyotherm2 instrument (Biopharma Technology Ltd., Winchester, UK) to gain further understanding of changes in the material in the frozen state. DTA allows for the observation of exothermic and endothermic changes, while impedance analysis can provide additional information relating to changes in mobility in the frozen solute phase, which can indicate softening events, glass transitions (T′g), and structural rearrangements.
Results and Discussion
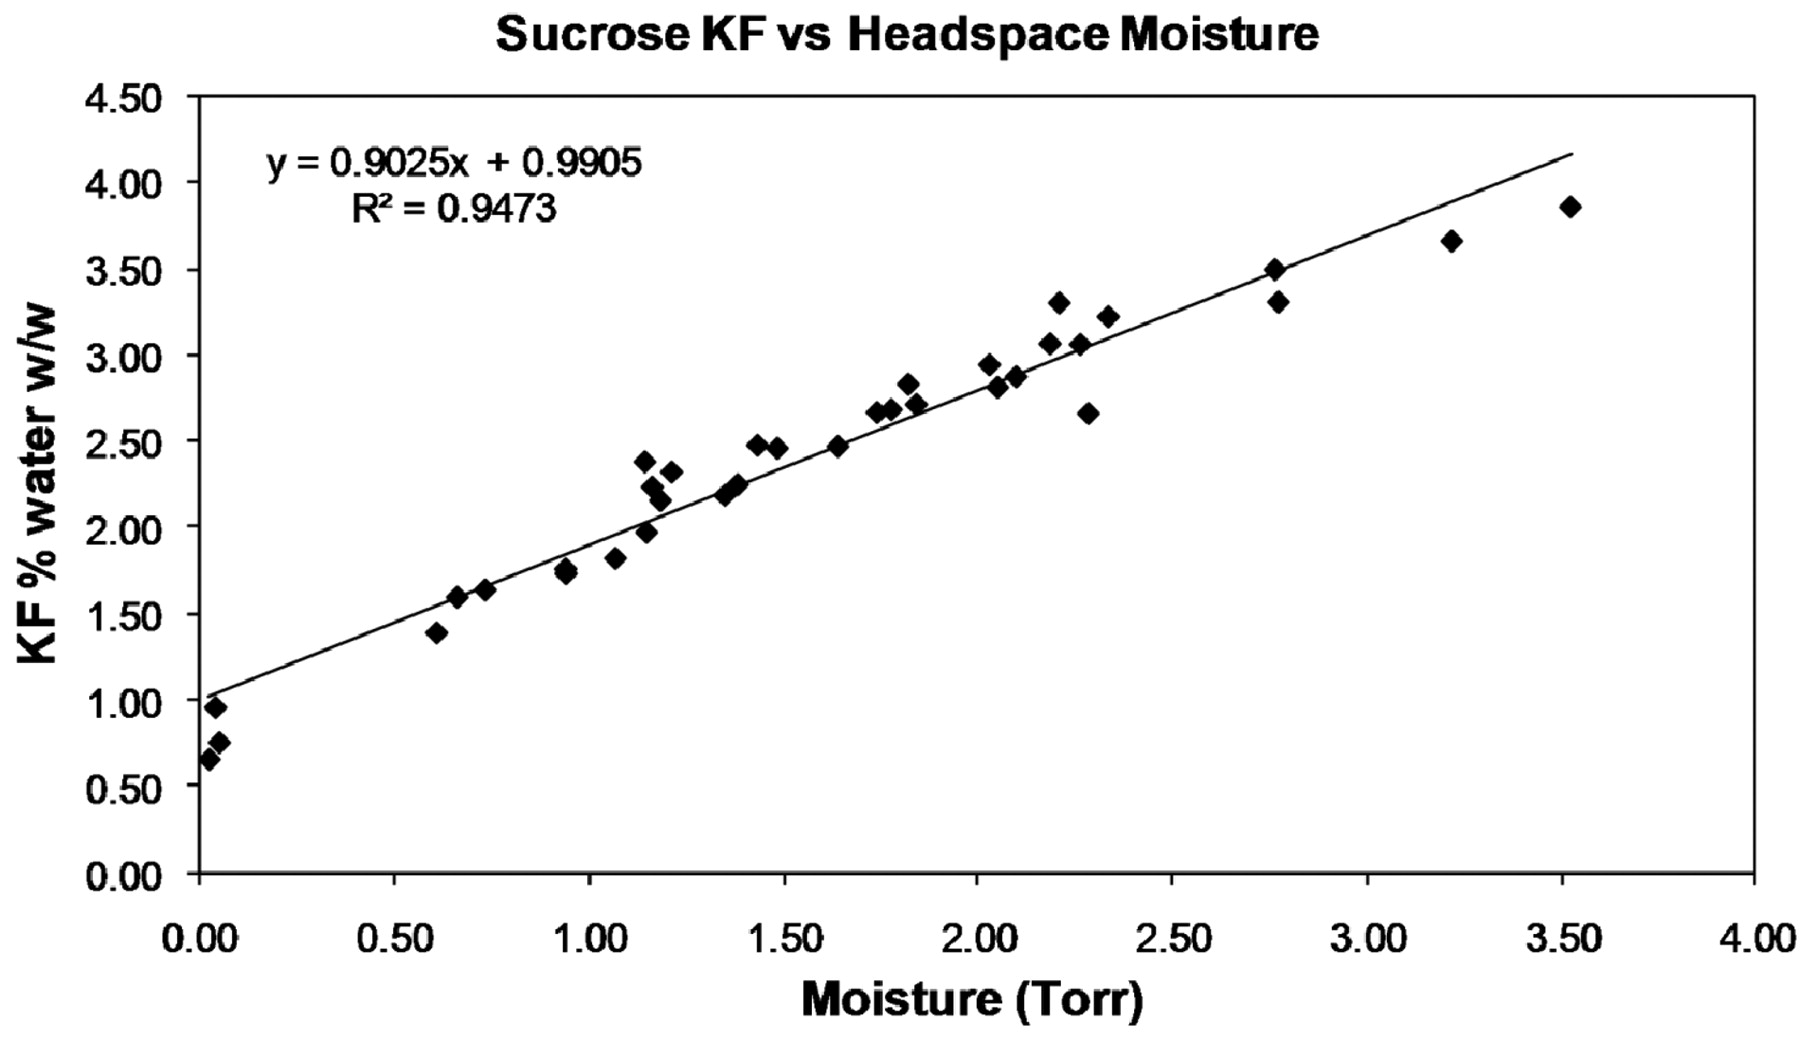
We have previously demonstrated good correlation between FMS and KF data for vials of lyophilized amorphous sucrose, which enabled a moisture map to be generated, highlighting vial moisture variation across a freeze-dryer shelf (5). In the first part of the present study we have focused on the effect of processing conditions on the moisture map picture observed. Figure 2 demonstrates a clear relationship between the KF and HSM data for sucrose, with the correlation between KF and FMS headspace water vapour measurements for the freeze-dried sucrose being R2 = 0.94.

KF/HSM correlation for sucrose.
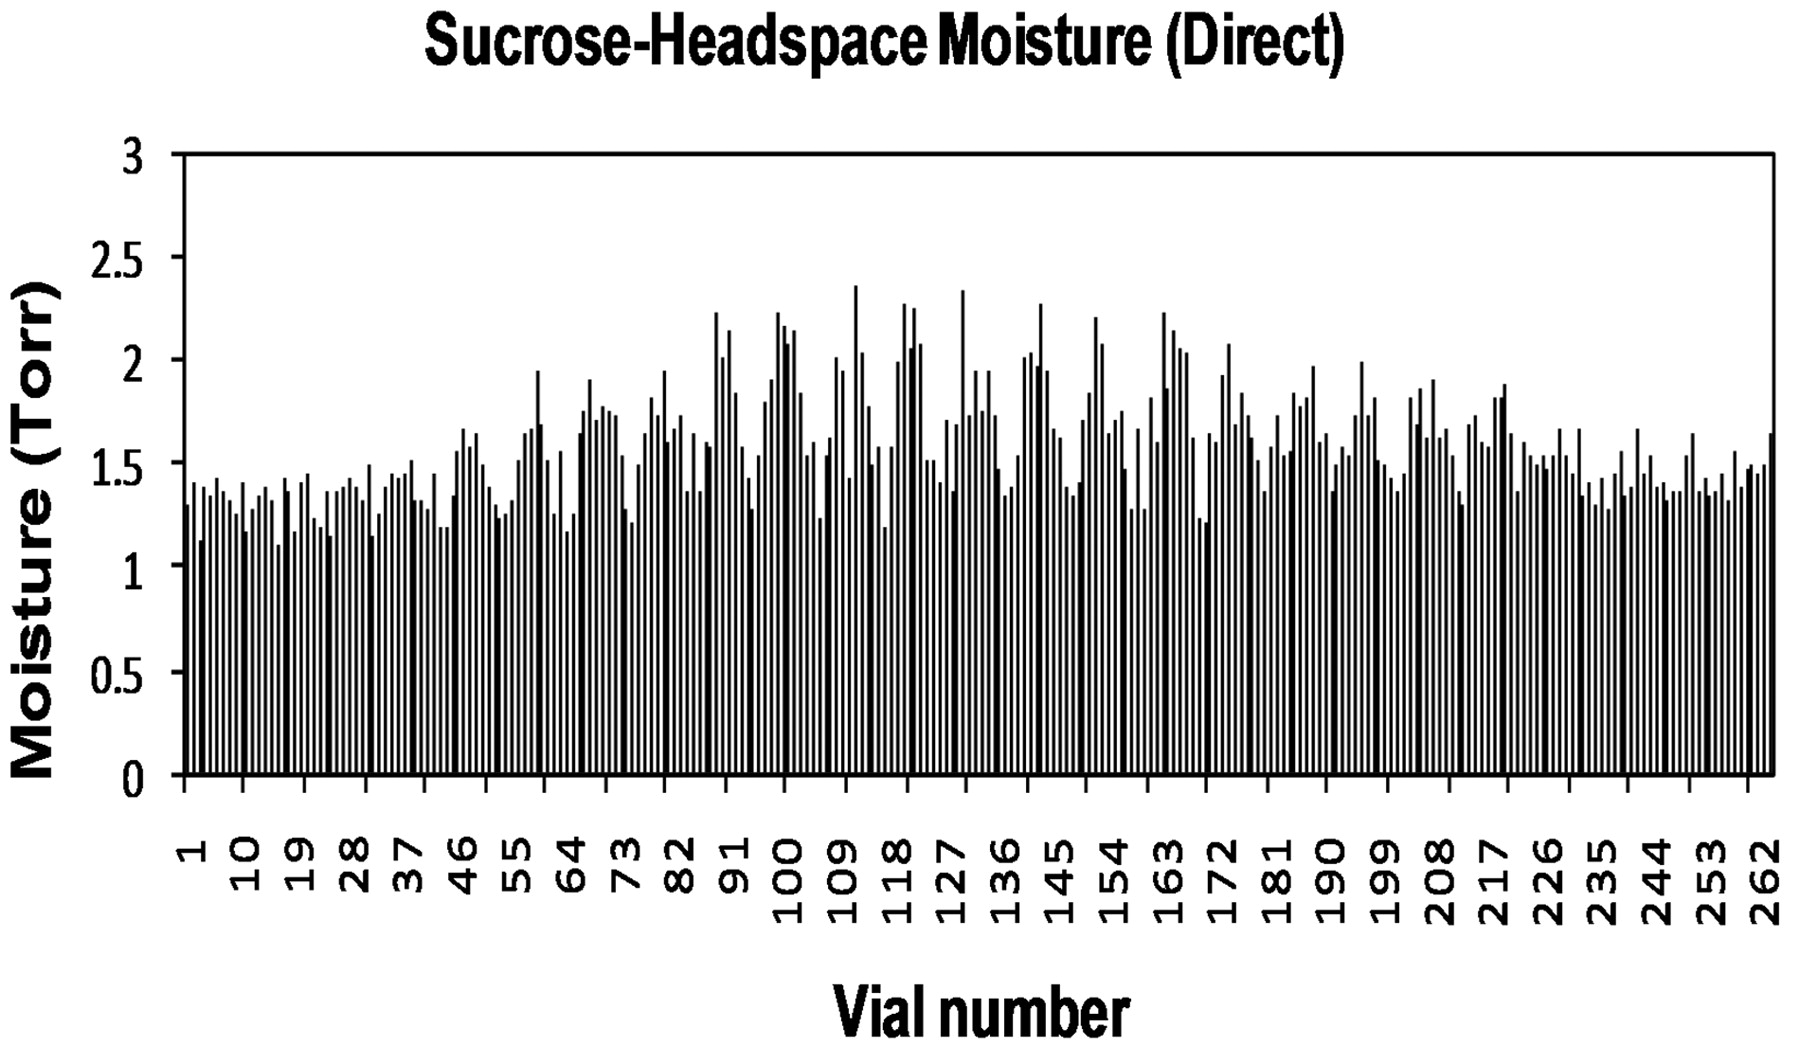
The graphs in Figures 3 and 4 show a HSM map for an entire shelf of vials of sucrose that were processed in the same freeze-drying cycle in a small research-scale freeze dryer; specifically, Figure 3 shows data for vials contained in a steel-bottomed tray and Figure 4 shows data for vials that were in direct contact with the freeze-dryer shelf. It can be clearly seen in Figure 3 that partial vapour pressure values are relatively uniform at the far left and right of the graph (front and back rows of the tray), whereas for the centre vials, which represent vials closer to the middle of the shelf, the partial vapour pressures are much higher and less uniform. This moisture variation may be attributable to a reduced level of radiative heat that the central vials can experience as demonstrated by Rambhatla and Pikal (6), as a result of which the degree of shelf contact plays a more significant role; this is reflected by the fact that the central vials in the middle rows furthest from the edge exhibit the highest moisture values, with the highest value of 3.2 Torr corresponding to 4% water w/w by KF as calculated from Figure 2. In Figure 4, the partial vapour pressures are much more uniform and values lower, as the vials were in direct shelf contact. In addition to this, the sample vials would have been less reliant on radiative heat input due to more efficient shelf heat transfer from direct contact. Based on the KF/FMS correlation, the lowest value of 0.2 Torr corresponds to 1% water w/w by KF and the highest value of 1.0 Torr equates to 1.8% water w/w by KF. The difference between those in direct contact and those with a tray bottom is clearly measurable and can be related to shelf location, degree of shelf contact, and radiative heating. A pictorial view of these heat transfer mechanisms is provided in Figure 5. The primary heat transfer mechanisms are conduction, convection, and radiation. Convection will in theory be similar for all samples in a freeze dryer with the same pressure (assuming shelf spacing/vial size is the same and cycle is not too aggressive), though there may also be a pressure gradient across the shelf. Conduction will vary with the degree of shelf contact, which will be affected by vial type and shape, and the introduction of a further barrier such as a tray bottom, as well as normal intra-shelf surface temperature variation. Radiation will vary based on location of the vial in the freeze dryer with those most shielded (centre vials) receiving the least radiative heat.
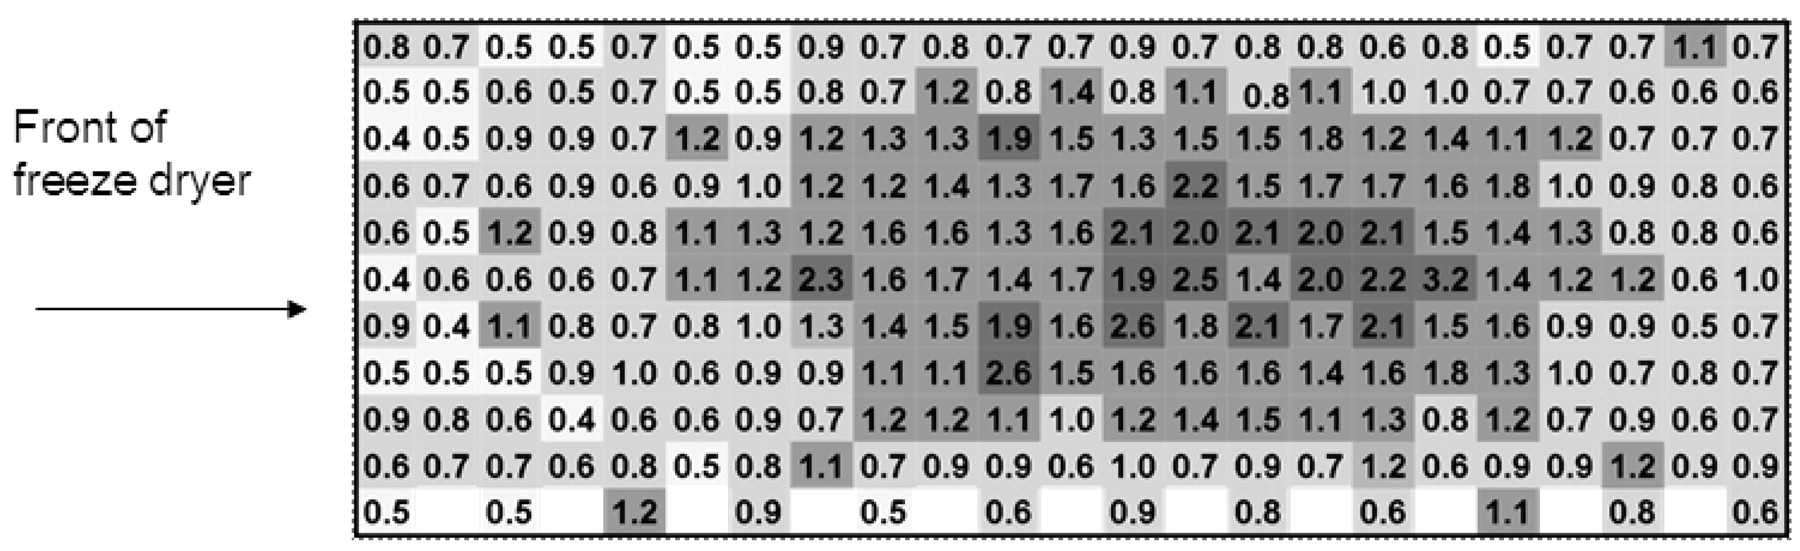
Moisture map for samples with a steel bottomed tray (units given in Torr).
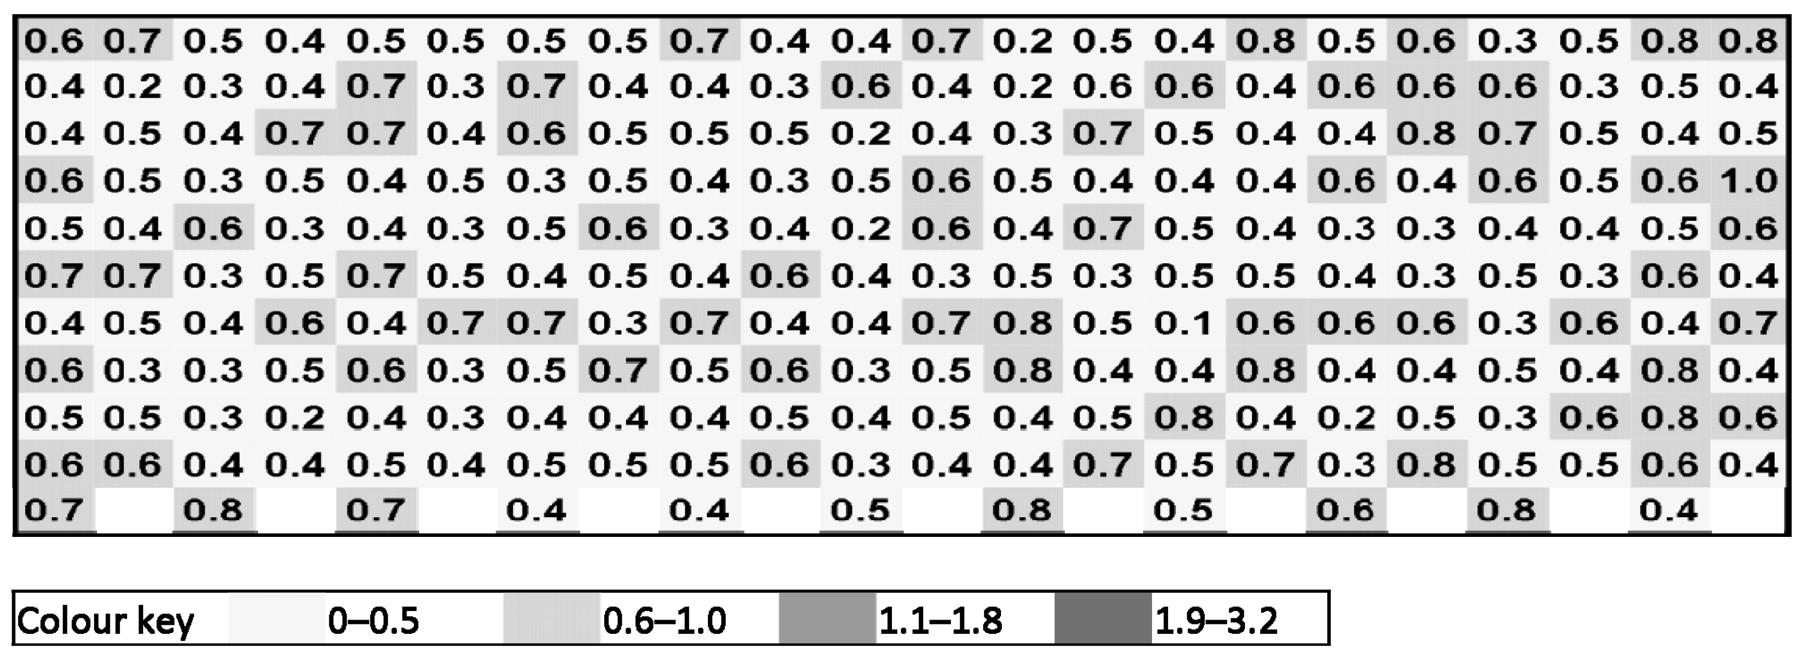
Moisture map for samples with direct shelf contact (units given in Torr).
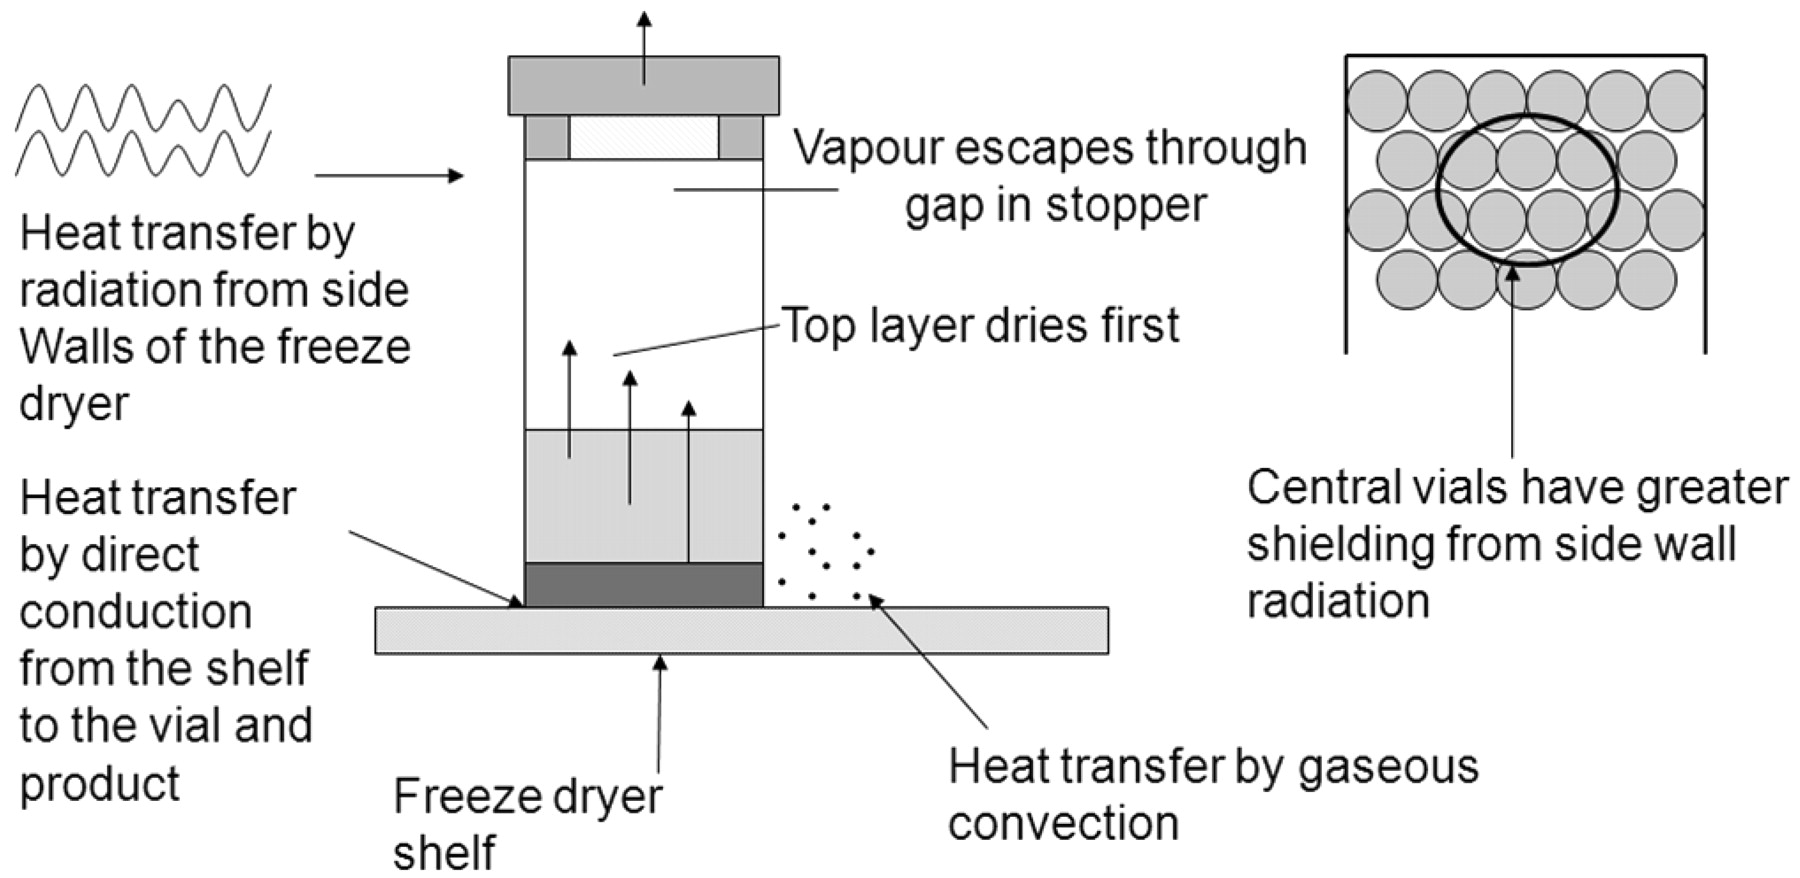
Vial drying processes within the freeze dryer.
In the second part of the present study, we have also examined the effect of shelf contact and process parameters on mannitol. Mannitol is generally considered to be a purely crystalline material provided an annealing step is included in the thermal treatment stage prior to primary drying. It is commonly (though incorrectly) assumed that once an annealing step (controlled warming and re-cooling) has been conducted, the resulting mannitol is in a homogenous stable crystalline form. Two freeze-dryer shelves were loaded with vials containing a 2% mannitol solution. As in the first part of the study, one set of vials was in direct contact with the freeze-dryer shelf and the other set were contained on a stainless steel tray. The primary drying shelf temperature was set at −5 °C with a chamber pressure set point of 1000 mTorr. Figures 6 and 7 show the HSM values for a shelf of freeze-dried vials without and with a tray, respectively. The average HSM for those in direct contact (n = 239) was 5.2 Torr (SD = 2.3), while those contained in a tray (n = 248) had a lower HSM value of 4.7 Torr (SD = 1.3). The difference in inter-vial variation is clearly represented in Figures 6 and 7, with those in direct contact having the highest degree of variation.

Headspace moisture for mannitol vials with indirect contact.

Headspace moisture for mannitol vials in direct contact with the shelf.
A small subset of vials from each shelf was subjected to KF analysis immediately after FMS analysis. The average moisture by KF for those in direct contact (n = 10) was 1.8% w/w (standard deviation [SD] = 1.8), while those in a tray had 2.4% w/w (SD = 2.1). Both KF and HSM data for each sample set showed broadly similar results given the high SDs, though those in direct contact displayed a higher degree of variation. It was observed that in this instance no clear correlation between the KF and HSM results was evident, with an array of KF values observed for any given HSM value; a dotted line has been superimposed on Figure 8 to indicate where the correlation would have been expected. In addressing this it is important to note that despite the different processing conditions (tray and no tray), the average values were similar for KF and HSM data.
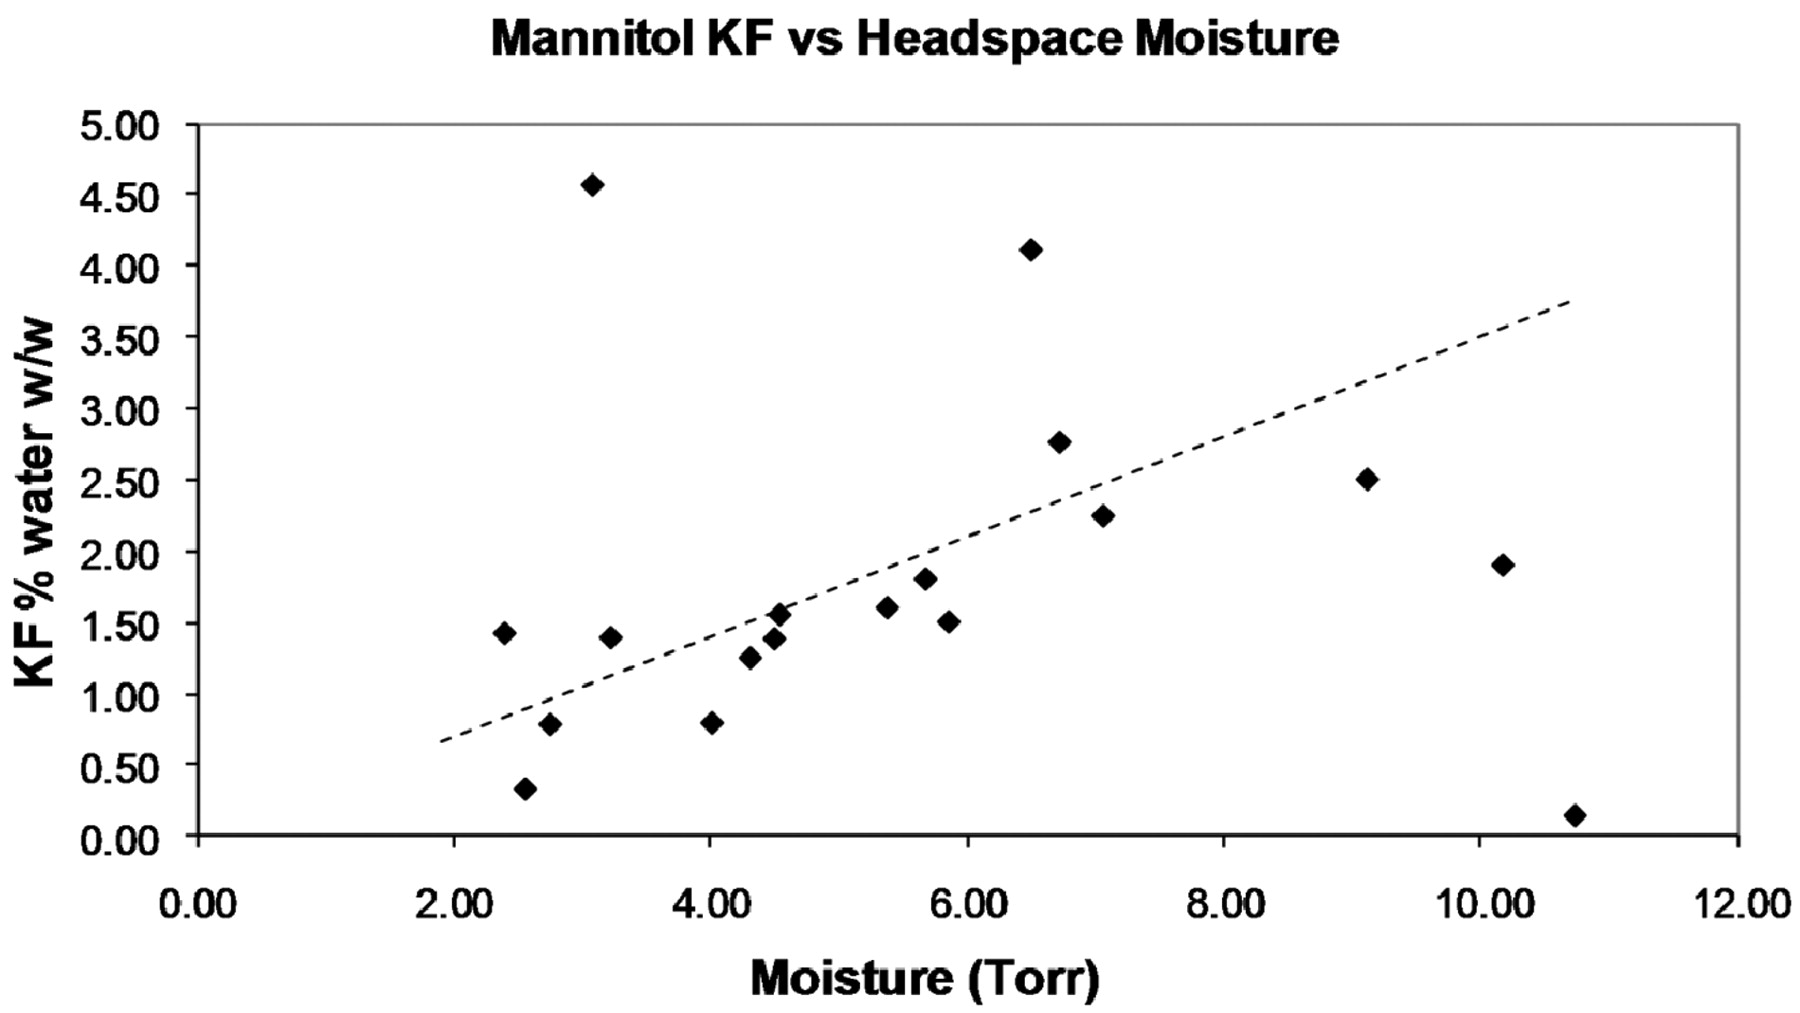
Limited correlation for mannitol KF and HSM data.
The lack of a clear correlation for the KF and HSM values must be addressed, as it limits any interpretation of the HSM data for moisture mapping. It was hypothesized that this lack of correlation indicated that the mannitol form may not be homogenous and that the slower heat transfer within the tray samples could have led to (a slightly) more uniform crystallisation. The second was the fact that primary drying at a shelf temperature of −5 °C led to relatively rapid drying and therefore significant levels of sublimation cooling, giving a product probe temperature of around −25 °C, which is in the crystallisation temperature range for frozen mannitol solution as shown by Lyotherm2 DTA data in Figure 9. It can also be seen in Figure 9 that upon warming to −25 °C, there is a drop from maximum measured impedance, coinciding with the exothermic crystallisation shown in the DTA signal; the continuation of the decrease in impedance indicates increased mobility within the sample. This event could have resulted in a greater range or proportion of different mannitol crystalline forms being produced in a single cycle; these forms could have a different affinity for water, hence the difference in HSM in relation to KF results. Therefore the study was repeated with primary drying conducted at −40 °C to ensure sublimation cooling below the crystallisation range; secondary drying was also shortened to deliberately increase the likelihood of moisture differences in the two sample sets. HSM values were higher than in the previous cycle, but both sets (n = 250) showed similar HSM values (10.3 ± 2.8 Torr for direct contact vials, 9.7 ± 2.1 Torr for tray vials). The moisture value by KF was higher than in the previous cycle (3.9 ± 0.8% w/w direct contact [n = 8], 5.3 ± 0.9% w/w tray bottom [n = 8]). These higher moisture values and difference in KF data are not unexpected given the shortened secondary drying time; again there was no clear relationship between the KF and HSM data.

Lyotherm2 graph for mannitol with impedance and DTA data.
The data indicated that the primary drying temperature was not responsible for the lack of correlation, though it was still suspected that the final dried form of mannitol may not be uniform and further investigation was necessary. Freeze-dried mannitol can exist in several forms (7), amorphous, crystalline hemi-hydrate, and anhydrous mannitol (α-, β-, and δ-). Annealing is often conducted when freeze-drying mannitol to ensure complete crystallisation with no amorphous mannitol remaining, as amorphous mannitol may lead to microcollapse during freeze drying, or in the dried state may crystallise over time, releasing water to the active ingredient. This increased moisture level has a direct effect on the glass transition (Tg) (8), causing a decrease in the Tg, which correlates with a decrease in product stability. If the mannitol is not homogenous throughout a batch as a result of annealing and freeze drying, then its interaction with HSM may vary. It was observed here that the visual appearance of the surface of the cake did vary from vial to vial; indeed, the appearance of the cake and resulting HSM value could often be linked together during the analysis. While this link has not been examined further in the present study, Yu et al. (9) observed significant variation from vial to vial for both the amount and stability of the hemi-hydrate form of mannitol. The HSM/total moisture equilibrium point will be due to the different mannitol forms present and the relative amounts of these, as their affinity for water will vary with structure, which may change over time. The following two mechanisms help to explain this: (i) the amorphous mannitol or crystalline hemi-hydrates (C6H14O6∗0.5H2O) of mannitol keep water within the cake resulting in a different affinity, though these may convert to the anhydrous forms releasing water into the headspace; and (ii) anhydrous polymorphs, although possessing the same molecular formula, have a different crystal structure, and this structural difference could confer different physical and chemical properties, for example, hygroscopicity, and chemical stability (10). Yoshinari et al. (11) have shown that the δ polymorph is more hygroscopic than the β form and that when exposed to moisture vapour converts to the β form.
In Figure 8 it could be seen that some form of correlation may exist between KF and HSM; however, some data points were clear outliers. If the presence of outliers could be attributable to the existence of different mannitol forms, it may be possible to observe changes in the early stages after freeze drying as the different mannitol forms convert to the most stable crystalline form. Chakkittakandy et al. (12) found that the “traditionally freeze dried cake” contained mostly δ and β forms, and Izutsu et al. (13) found that when a low concentration solution is used (1.5–3% w/w) for freeze drying, the β crystalline polymorph form is favoured.
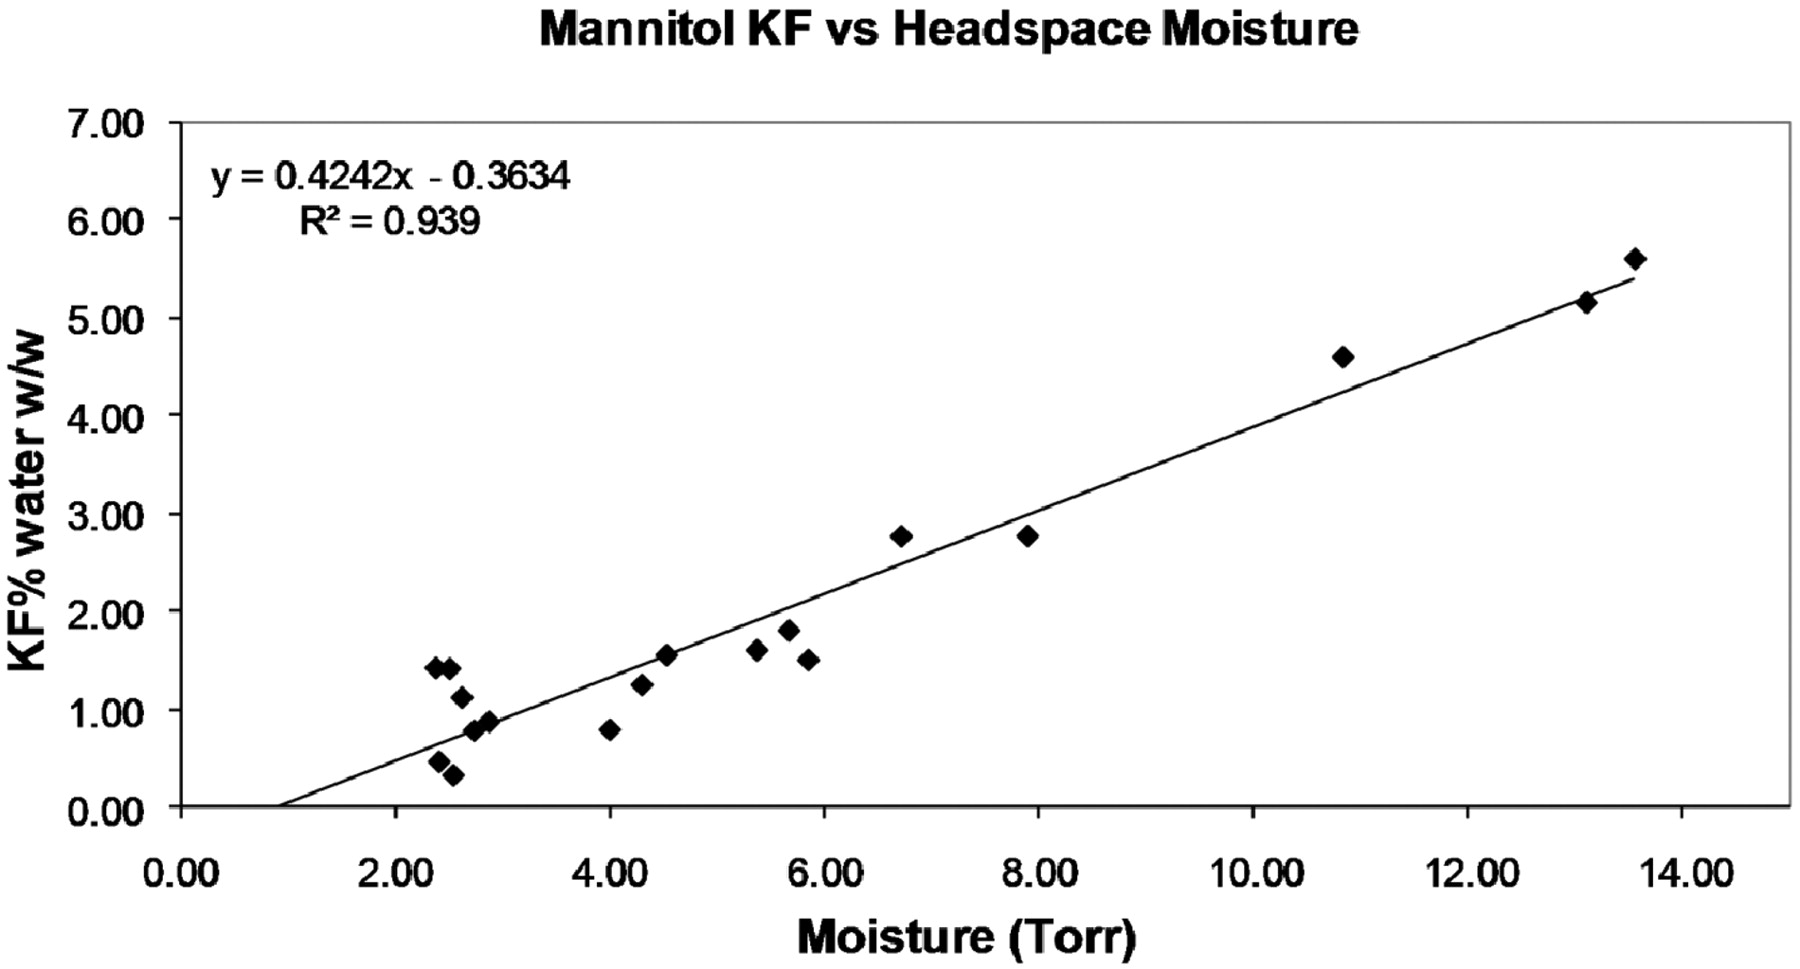
HSM values were recorded on day 1 and day 3 after freeze drying, samples were kept at ambient temperatures (20 ± 1 °C). The ratio was calculated (day 3/day 1) with the highest ratio representing the greatest change in HSM, while the total moisture (by KF) remained constant as it was contained within the sealed vial. The run conducted with primary drying at −5 °C (shelf temperature) with secondary drying based on the samples in direct contact was chosen due to the lower moisture content. Once the ratio change had been calculated, the KF and HSM data were compared using only those vials that had shown a relatively low ratio change (≤1.6). This resulted in a much better correlation (see Figure 10) although there was still some variation, indicating the mannitol forms were not uniform. This is supported by the ratio change used of up to 1.6; however, a much improved correlation was obtained with r2 = 0.94.

Mannitol KF vs HSM correlation.
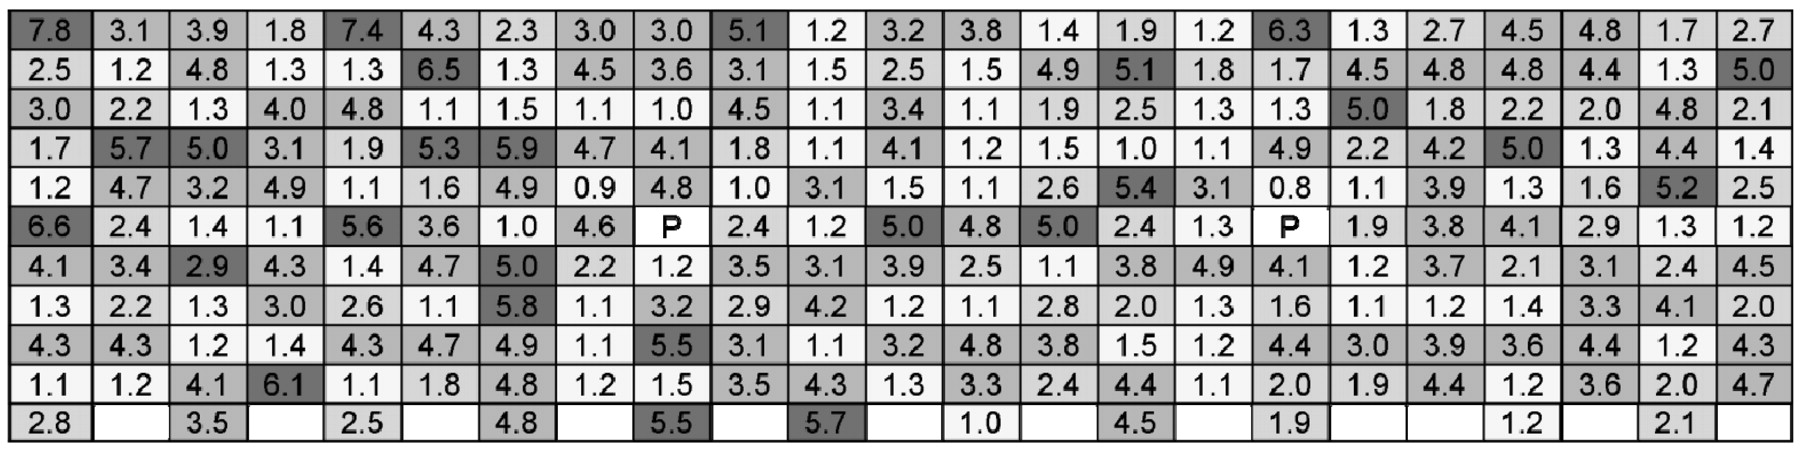
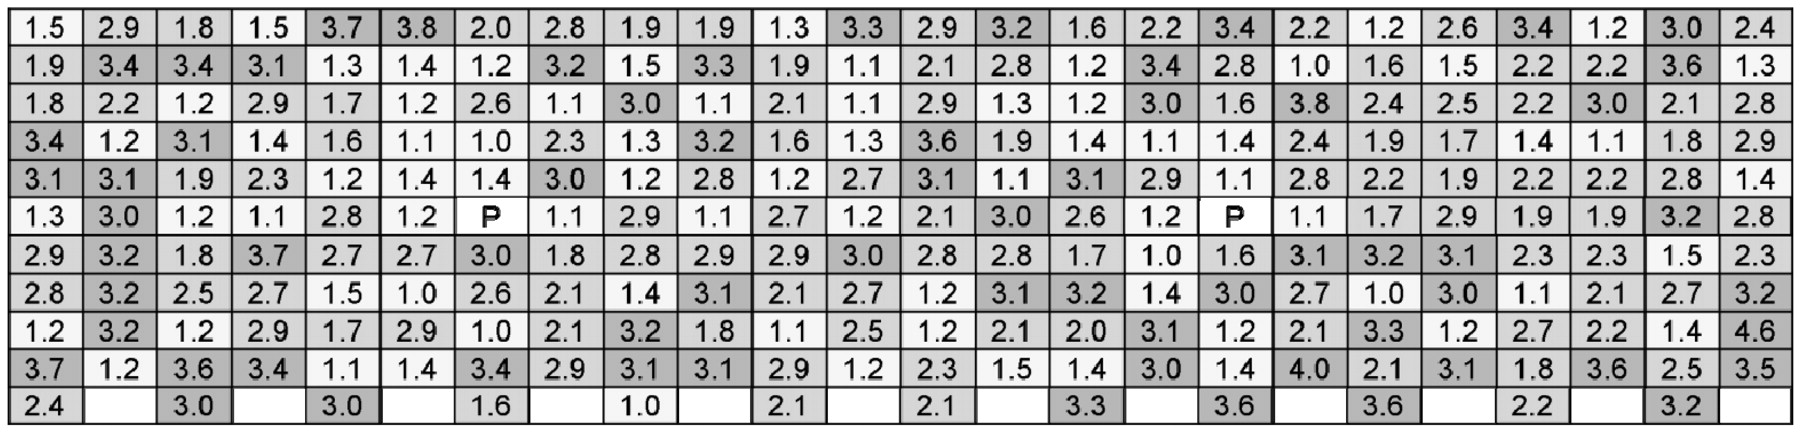
These ratio changes were studied in more detail and mapped for each set of samples based on location within the shelf. Figures 11 and 12 illustrate the map of ratio changes across the shelf for direct contact and tray contact samples, respectively. Table III summarises the different levels of ratio change and clearly shows that both tray and direct contact samples had a similar degree of ratio change for values up to 1.5. For the higher ratio changes, the differences are much more prominent, with those in direct contact having only 20.9% of vials with a ratio change between 1.6 and 2.9 compared to 44.0% for indirect contact vials. Some vials in direct contact have a ratio change >5.0, with some as high as 8, which was not observed for indirect contact vials. Most of these higher changes occur in the front half of the shelf (see Figure 11). These results support the high inter-vial variation and high SD observed in Figure 6 for direct contact samples and the lower variation observed for tray contact samples in Figure 7. The data indicate that the slower heat transfer results in a more controlled and uniform crystallisation and hence a smaller variation in the mannitol form for the tray samples. For direct contact vials, the relative proportion of heat input by radiation is lower compared to heat by conduction and the edge effect is much reduced, though the highest ratio changes do occur in the front half of the tray, which receives more radiation through the Perspex dryer door. This change in the balance of heat transfer mechanisms assists in explaining the degree of ratio change observed. A third cycle was conducted with much slower ramping rates for the freezing and annealing step. This did not lead to a measurable reduction in the different ratio changes observed (data not shown). Previously published data by Johnson et al. (14) found that heating mannitol to 40 °C in secondary drying eliminated the majority of the mannitol hydrate. However, in this study, 20 °C was chosen because this is a commonly used temperature during secondary drying; in addition to this it also helped to demonstrate the potential variability than can exist.
Summary of HSM Ratio Changes

Map of ratio change for vials of mannitol dried in direct contact with shelf (P = probed vial).

Map of ratio change for vials of mannitol dried in tray (P = probed vial).
Further to the KF and HSM correlation investigations, the resultant sets of data (tray contact and direct contact for mannitol) showed no significant difference when compared to the sucrose results for indirect and direct contact (Figures 3 and 4). This could indicate that any differences due to the amount of heat transfer by gaseous convection or conduction is not such a significant factor during drying for these tray contact and direct contact samples. It is possible that the annealing process itself has reduced the importance of these factors.
A sucrose freeze-drying run was conducted with an annealing step included. Figures 14 and 15 show a plot of HSM values recorded. It can be observed that the direct contact samples in Figure 14 appear to have a greater degree of HSM variation for the central vials; Figure 15 samples with a tray bottom indicate HSM in the centre is slightly more uniform. Overall, however, the two trays have similar HSM values; for direct contact samples the average HSM value is 1.6 ± 0.3 Torr, for those with a tray bottom the average HSM value is only slightly higher at 1.9 ± 0.3 Torr. The lowest value for direct contact samples is 1.1 mTorr (KF 2.0% w/w), with the highest at 2.4 mTorr (KF 3.2% w/w); for tray samples the lowest value is 1.2 mTorr (KF 2.1% w/w) and the highest 2.5 mTorr (KF 3.3% w/w). Visual observations of HSM data and corresponding KF data (based on correlation plot) indicate that secondary drying needs to be extended to give more uniform and lower moisture results; however, despite this there is not a significant difference between tray and direct contact samples when compared to the sucrose data without an annealing step. This further supports the theory that the annealing process can reduce the relative importance of heat transfer by conduction.
Annealing (in addition to encouraging crystallisation of mannitol and other materials) encourages the growth of larger ice crystals, by which a more ordered open structure can be obtained with more connected channels for vapour to escape. These open channels can speed up the drying process by decreasing impedance to vapour flow, thereby reducing the amount of energy required, as shown in Figure 13. The reduced impedance can allow the energy supplied to be used more efficiently, fuelling sublimation rather than a product temperature rise. It is suspected that the vials lyophilized within the tray undergo a much slower heat transfer process due to the tray acting as an insulating barrier. The more ordered open structure encouraged by annealing in both sets of samples is further amplified in the tray set with slower heat transfer, leading to larger ice crystals which may result in an even lower resistance to drying. This reduces the importance of direct shelf contact; therefore the tray does not reduce the speed of drying in the same way as it was observed to do with sucrose (not annealed). Another factor is that because the annealing process results in an increase in the rate of primary drying, with slower warming giving larger ice crystals, the overlap of sublimation and desorption towards the end of the primary drying step is increased, reducing the secondary drying time that is needed to obtain more uniform moisture contents.
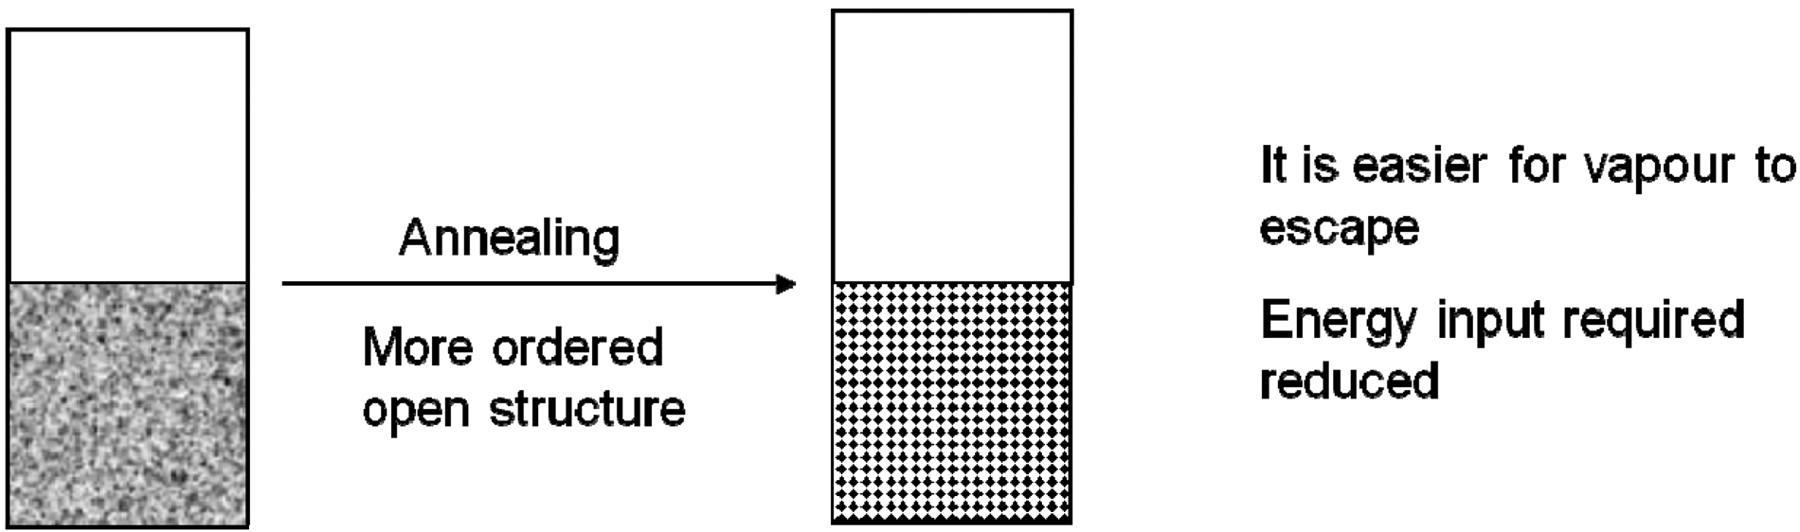
Structure more open after annealing.

Headspace moisture for vials of annealed sucrose with direct contact.

Headspace moisture for vials of annealed sucrose with indirect contact.
Conclusions
This study demonstrates some of the complexities involved in understanding the “nature” of the water present in lyophilized products. Once the processes are understood for a particular system and the parameters are set, the analysis of HSM could enable 100% inspection of a freeze-dried batch, moisture mapping of samples over an entire freeze-dryer shelf, and further batch monitoring over time. KF/HSM correlations could be used to gather additional information on the freeze-drying process as well as furthering the understanding of the material/moisture interactions. The effects of annealing and shelf contact have been clearly demonstrated, along with the importance of material type, with clear changes to observed moisture values. A single process change could have different consequences for different products; therefore it is important to fully assess any changes to the freeze-drying cycle, freeze-dryer type, materials used, shelf size, and vial loading to study the impact of material structure and how this affects the drying rate and importance of the different heat transfer mechanisms. Headspace moisture analysis has demonstrated that it can be used as a non-destructive method to further the understanding of the factors involved in obtaining uniform moisture contents. It is important to fully understand reasons for moisture variation due to processing and material choices. This understanding can assist in the validation of a process, freeze-drying cycle development, and measuring the impact of any changes made, helping to ensure consistent and reliable product quality, not only after lyophilization but also during subsequent storage.
Conflict of interest Declaration
The authors declare that they have no competing interests.
Acknowledgments
The authors thank Mervyn Middleton, Karen Robinson, and Marc Townell for their assistance with the laboratory work, and Derek Duncan and Jim Veale of Lighthouse Instruments for the loan of the FMS-1400 instrument.
- © PDA, Inc. 2011


Jump to section
Related Articles
Cited By...
- A Container Closure Integrity Test Method for Vials Stored at Cryogenic Conditions Using Headspace Oxygen Analysis
- Container Closure Integrity Test Method Development on Vials Stored at -80{degrees}C Using Headspace Carbon Dioxide Analysis
- Container Closure Integrity Test Using Frequency Modulation Spectroscopy Headspace Analysis with Carbon Dioxide as a Tracer Gas
- Evaluation of Container Closure System Integrity for Frozen Storage Drug Products