
Abstract
Prefilled syringes and autoinjectors are becoming increasingly common for parenteral drug administration primarily due to the convenience they offer to the patients. Successful commercialization of such delivery systems requires thorough characterization of individual components. Complete understanding of various sources of variability and their ranking is essential for robust device design. In this work, we studied the impact of variability in various primary container and device components on the delivery forces associated with syringe injection. More specifically, the effects of barrel size, needle size, autoinjector spring force, and frictional forces have been evaluated. An analytical model based on underlying physics is developed that can be used to fully characterize the design space for a product delivery system.
LAY ABSTRACT: Use of prefilled syringes (syringes prefilled with active drug) is becoming increasingly common for injectable drugs. Compared to vials, prefilled syringes offer higher dose accuracy and ease of use due to fewer steps required for dosage. Convenience to end users can be further enhanced through the use of prefilled syringes in combination with delivery devices such as autoinjectors. These devices allow patients to self-administer the drug by following simple steps such as pressing a button. These autoinjectors are often spring-loaded and are designed to keep the needle tip shielded prior to injection. Because the needle is not visible to the user, such autoinjectors are perceived to be less invasive than syringes and help the patient overcome the hesitation associated with self-administration. In order to successfully develop and market such delivery devices, we need to perform an in-depth analysis of the components that come into play during the activation of the device and dose delivery. Typically, an autoinjector is activated by the press of a button that releases a compressed spring; the spring relaxes and provides the driving force to push the drug out of the syringe and into the site of administration. Complete understanding of the spring force, syringe barrel dimensions, needle size, and drug product properties is essential for robust device design. It is equally important to estimate the extent of variability that exists in these components and the resulting impact it could have on the performance of the device. In this work, we studied the impact of variability in syringe and device components on the delivery forces associated with syringe injection. More specifically, the effect of barrel size, needle size, autoinjector spring force, and frictional forces has been evaluated. An analytical model based on underlying physics is developed that can be used to predict the functionality of the autoinjector.
Introduction
The last decade has witnessed an increase in the popularity and sales of prefilled syringes with an annual growth rate of 20% in the U.S. market (1). The primary factors driving the growth include ease of administration and added convenience for health care workers and patients (1, 2). Compared to vial configuration, a higher accuracy can be achieved with prefilled syringes and fewer steps are required for dosage. An added benefit is the reduced overfill amount due to significantly lower hold-up volumes associated with syringes. Errors in dosage, and risk of misidentification and contamination, are also minimized. Plastic prefillable syringes made of cyclic olefins are now available as an alternative to glass syringes (3). Convenience to end users and market advantage can further be boosted through the use of delivery devices. Delivery systems that are preferred by the patients and perceived to be less invasive than syringes (4) will provide commercial advantage to the drug manufacturer. Novel delivery systems for commercial products also offer a mechanism to maintain the competitive edge in the marketplace (5).
Successful commercialization of prefilled syringe configurations and autoinjectors requires complete understanding of the mechanism of delivery and the parameters contributing to the delivery forces and injection time. The delivery force is attributed to the break-loose force (initial force required to set the plunger in motion) and the extrusion force needed to sustain the plunger movement by overcoming the hydrodynamic pressure and the frictional forces. Several factors contribute to these forces, including but not limited to:
Barrel siliconization, which primarily affects the frictional forces
Syringe geometry, including barrel size and needle gauge, which primarily affects the force due to hydrodynamic pressure drop
Syringe type, such as siliconized glass or plastic
Stopper type and geometry
Product attributes, including its interaction with the barrel surface and its rheological properties
Driving forces, such as the spring for mechanical autoinjectors
Injection volume and time
Subcutaneous resistance
In order to design a robust product presentation, it is important to understand the role of each of these components, estimate their inherent variability, and calculate the resulting impact on injection force or time. The objective of this study is to characterize and measure the effect of variability in components associated with a syringe delivery system, such as syringe barrel size, needle size, friction forces, and spring characteristics of the autoinjector. The role of product properties and its interaction with the syringe surface is equally critical and has been evaluated under a separate study. Results from that study will be published in a separate article. Subcutaneous resistance is also expected to increase the delivery forces; however, the impact of interstitial pressure is outside the scope of this work. The measurements of extrusion forces are performed using Instron, a material testing system. A predictive model based on the Hagen-Poiseuille equation has been developed to understand the flow behavior of drug through the delivery systems and to help identify malfunctions and failure points associated with the delivery system. The mechanistic model helps to identify the key process parameters, assess their importance, and predict the impact they would have on the extrusion force or injection time variability.
Materials and Methods
Siliconized glass syringes and plastic syringes procured from different vendors (see Table I) were used in this study. Plunger stoppers from two different vendors were also evaluated for siliconized glass syringes.
List of Syringe Types and Lots Used in This Study
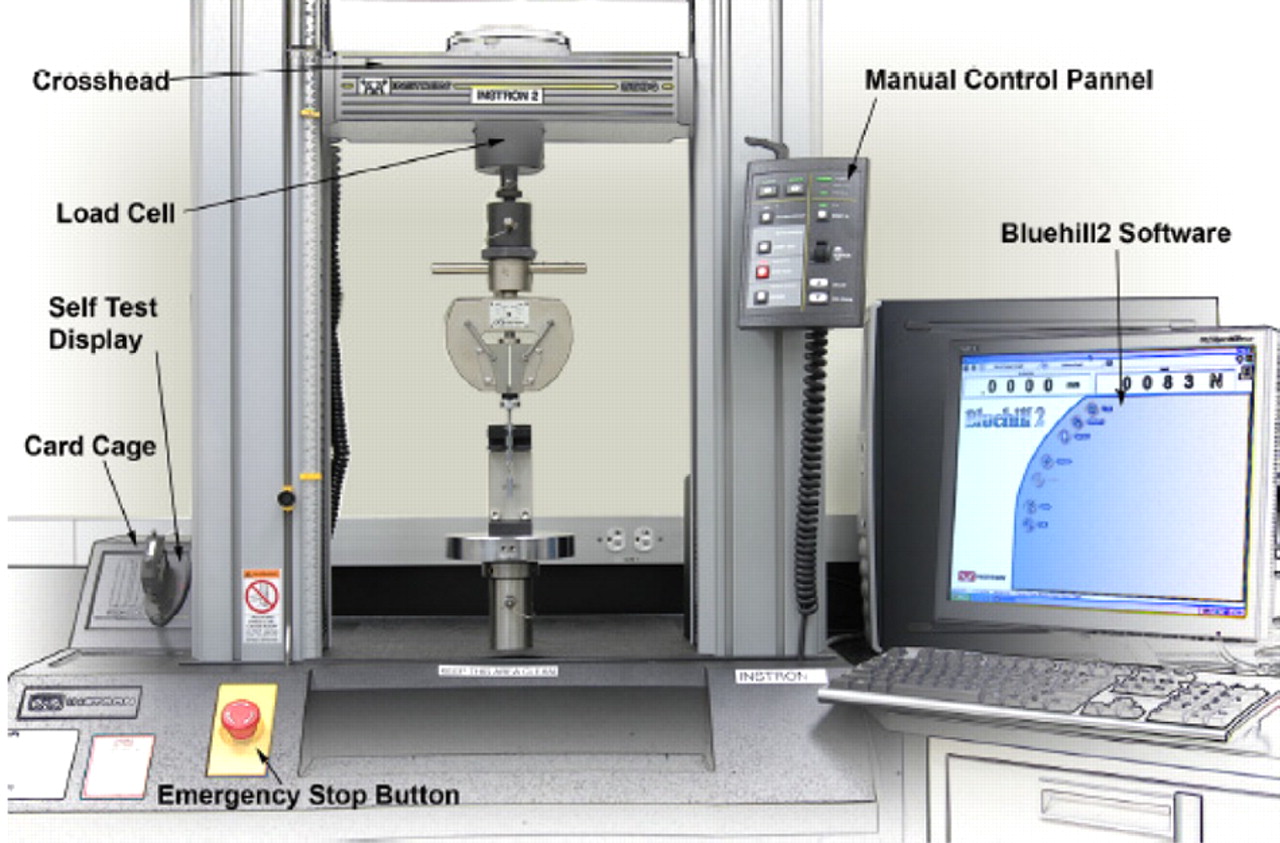
Force measurements for syringes were performed using Instron, a material testing system. A load cell of 500 N was used to drive the syringe plunger at a constant crosshead speed while measuring the resulting force on the plunger (repeatability of ±0.25% of reading over a range of 0.4% to 100% of capacity). A schematic of the instrument is shown in Figure 1. Variation in needle size is measured by a syringe flow rate fixture which measures the pressure drop for a liquid (water) flowing across the syringe barrel and needle at a constant flow rate. The set up consists of a pump connected to a water reservoir and a pressure sensor. The pump discharges water at constant flow rate in the capillary, and the sensor measures the corresponding pressure drop that is representative of the effective internal radius of the needle. Variation in barrel size of the syringes is measured by the barrel bore internal diameter (ID) gauge. It is first calibrated using a barrel of known ID. The instrument is then used to measure the barrel size of different syringes at different depths along the syringe axis.

Picture of the Instron system used for measuring extrusion forces.
Theory
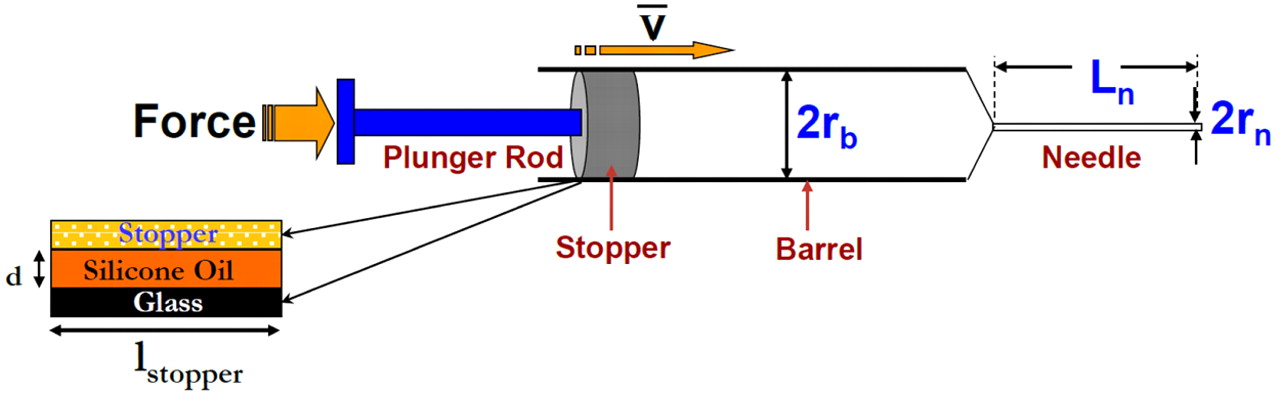
The system under consideration is fluid flow through a prefilled syringe. The syringe consists of a needle of length Ln and mean effective internal radius rn attached to the barrel of mean effective internal radius rb. The syringes are filled to a specified volume and stoppered using an automated stopper placement unit. The stopper holds the end of the plunger rod through which a force Ftotal is applied in order to drive the fluid with a plunger speed v̄ (linear speed in length over time dimensions).
Break-loose force refers to the maximum force required to set the plunger into motion. Extrusion force is the total force required to sustain the plunger rod in motion while maintaining the desired flow rate of the liquid through the needle. This study characterizes the total extrusion force associated with delivery of a product through syringe injection.
Figure 2 shows the schematic of a syringe system. The inner surface of the glass barrel is lubricated with silicone oil as shown in the figure. The force balance on the stopper at any time during injection gives
 where Ftotal is the total force needed for driving the plunger (also referred to as extrusion force), Ffriction is the friction force between the stopper and the syringe wall, and Fhydrodynamic is the hydrodynamic force required to drive the fluid out of the needle. The details of these forces are discussed in the following sections.

A schematic of the various components and forces associated with the syringe delivery system. The figure also shows a schematic of the lubrication of the syringe wall with silicone oil.
A. Friction Force
The friction force arises from the interaction between the walls of the stopper and the barrel. The inner surface of the glass syringe is lubricated (siliconized) with a thin layer of silicone oil as shown in Figure 2. The friction force thus results from the glass-silicone oil-stopper interaction. Using the lubrication approximation, and assuming a uniform silicone oil layer on the inner wall of the barrel, the relation between the friction force and the injection speed is
 where μoil is the viscosity of lubricating oil, doil is the thickness of lubrication layer, lstopper is the length of the stopper in contact with glass, and v̄ is the injection speed (linear piston speed with dimensions of length over time). Equation 2 shows that there is a linear dependence of the friction force on the injection speed and Kf is the constant of proportionality for a given thickness of silicone oil. The friction force would increase with injection speed due to the increase in velocity gradient within the lubrication layer. Variability in friction force could arise due to non-uniformity in the thickness of the silicone oil layer on the inside surface of the barrel, as well as variations in the geometry of the barrel and stopper. Protein-barrel interactions could further affect the friction force.
B. Hydrodynamic Force for Newtonian Fluids
The hydrodynamic force results from the pressure drop required to drive the fluid out of the syringe. For Newtonian fluids, the relationship between the pressure drop ΔP and the volumetric flow rate Q (units: volume/time) can be obtained using the Hagen-Poiseuille law as
 where μ is the viscosity of fluid, r is the radius, and L is the length of the cylindrical channel. The equation assumes laminar flow (Re < 2300) for an incompressible liquid though a channel of constant cross section diameter of 2r. For a 27 G syringe needle and 1 mL syringe barrel used in this study, a plunger speed of 304.8 mm/min corresponds to a Reynolds number of less than 100. Assuming no interference from the glue used in producing a staked needle syringe, the total hydrodynamic force associated with flow in a syringe will depend on the pressure drop across the barrel and needle. Equation 3 shows that for constant flow rate Q, ΔP ∼ r−4. In the syringe system, the radius of the barrel is much larger than the radius of the needle (rb/rn ≅ 30). As a result, the pressure drop across the barrel is negligible when compared to the pressure drop across the needle (∼O(10−6)). There is also an entry loss when the fluid enters into a constriction, but its magnitude is much smaller than the pressure drop across the needle (ΔPloss ∼ ρv2/2 ∼ O(10−7)). Neglecting the pressure drop across the syringe barrel and the entry loss, the hydrodynamic force at a given temperature can be estimated from eq 3 as
 where Kh is a constant that depends on syringe size and fluid properties. Variation in operating temperature would affect the solution viscosity and the hydrodynamic force. Equation 4 shows the linear dependence of the hydrodynamic force on the injection speed. Equations 2 and 4 can be combined to give the total extrusion force associated with syringe delivery:
C. Hydrodynamic Force for Non-Newtonian Fluids
The flow of non-Newtonian fluids is more complex due to the fact that their viscosity is not constant with the shear rate. A power law model is most commonly applied to represent the viscosity for such fluids:
 where τw is the shear stress at the wall or barrel surface, γ is the shear rate and n is the power law index (where n = 1 represents a Newtonian fluid), K is the defined as the flow consistency index, and μ is the apparent viscosity.
For non-Newtonian fluids, the relation between the pressure drop ΔP required to drive the fluid at flow rate Q in a cylindrical channel of radius r and length L can be derived by solving the Navier-Stokes equation for a flow in a cylinder (6). Neglecting the pressure across the barrel, the hydrodynamic force required to drive a non-Newtonian fluid with an injection speed v̄ can be derived as
It should be noted that while the hydrodynamic force was linear with injection speed for the case of Newtonian fluids, it has a non-linear dependence on injection speed for non-Newtonian fluids. The total extrusion force can then be estimated by adding the friction force to the hydrodynamic component:
D. Injection Time Calculation for Autoinjector
Modeling of an autoinjection device involves a physical understanding of the effects of all the components associated with the delivery system. The autoinjector system included in this study has an installed spring serving as the source of the driving force required to inject the product from the syringe. The spring is installed at a compressed length, which is shorter than its free length. At the time of injection, the spring is released from its installed length, causing the spring to relax while forcing the drug out of the syringe at the same time. The driving force from the spring at any time when the compressed spring length is “x” is given by
 where lo is the free length of the spring, x is the current spring length, and k is the spring constant. A stronger spring will provide a higher driving force and a shorter injection time. The generalized equation (for both Newtonian and non-Newtonian fluids) for the momentum balance on the stopper can be written as
The terms Kf and Kh correspond to the frictional and the hydrodynamic terms, respectively, as described in the previous section. mstopper is the mass of the stopper, and n is the power law viscosity index of the liquid. Equation 10 represents a one-dimensional, second-order differential equation capturing the motion of the stopper. It is based on the assumption that the fluid is always at the quasi-steady state where the hydrodynamic term corresponds to the Poiseuille equation.
For Newtonian solutions (n = 1), a reasonably accurate analytical solution for eq 10 can be obtained by using appropriate initial conditions (zero velocity for stopper) and applying assumptions including neglecting the inertia term and considering the system to be in a quasi-steady state where the spring force balances the hydrodynamic and friction forces. For Newtonian fluids, an analytical approximation can then be derived as
For non-Newtonian fluids (n ≠ 1 in eq 10), another assumption regarding the friction force can be made to derive an analytical solution. As reported later in Section D, friction force lies in the range of 1 to 3 N for a wide range of injection velocities (injection time of 3 to 30 s). For viscous products the hydrodynamic force term is significantly larger than the friction term and has a stronger dependence on injection speed. If the frictional term is assumed to be a constant (Cf), an analytical solution for non-Newtonian fluids can be obtained and is given by
 where
where

Results and Discussion
Based on the theoretical framework presented in the previous sections, experiments were conducted to measure the parameters contributing to delivery forces and injection times, including syringe barrel diameter, needle diameter, and autoinjector spring constant. The friction forces were also estimated, along with the impact of stopper variability and injection speed. Once these parameters had been measured, delivery forces as estimated by eq 5 were verified with the experimental data generated using the Instron. Injection time data for test autoinjectors were also compared to the calculated injection times as given by eq 11. Once the analytical model was confirmed to adequately capture the flow behavior inside an injection device, a theoretical stack tolerance analysis was conducted to estimate the worst-case variability in injection time. The following sections describe the results from each of these assessments.
A. Characterization of Barrel Internal Diameter
Consistency in barrel size is important in estimating the delivery forces as stated in eq 5. The barrel size governs the area over which the force is applied to push the plunger rod during injection. The force has a fourth-power dependence on barrel radius for a given plunger speed (second-order dependence for a given flow rate). Table II shows the measured values for barrel diameters of different syringes. The measurements were conducted at different sections of syringes in order to check the uniformity of the diameter throughout the syringe length. The “Top” section refers to the flange end and the “Bottom” refers to the needle end. Each data point in the table is based on measurements performed on a sample size of 20 syringes. Data suggest reasonable consistency in barrel diameters across the syringe types (within 6.25 to 6.45 mm). It is also observed that while the cross-sectional diameter of glass syringes is uniform along the barrel length, plastic (Vendor 4) syringes exhibit a small increase in barrel radius at the needle end. Based on the lots and sample size considered in this evaluation, the maximum variation of the barrel diameter in glass syringes is estimated to be around 1%, which can result in a variation of up to 4% in the hydrodynamic component of the extrusion force (eq 4) for a given plunger speed.
Measurement of Barrel ID at Different Sections of Syringes
B. Characterization of Needle Internal Diameter
Needle ID also plays an important role in determining the net hydrodynamic force. A small change in needle size can cause a significant change in delivery forces or injection time. Equation 5 shows that the force is dependent on the fourth power of needle radius. Instead of measuring the absolute internal diameter, an indirect approach was used to estimate the variability in the internal diameter of needles. The method uses a flow-based set up in which a fluid (water) is pumped at constant flow rate through the needle and the pressure drop is measured at a steady state. Assuming needle lengths are consistent, the variability in the pressure drop provides an estimate of the variability in needle ID as
Or, variability in pressure drop and extrusion force = 4 × variability in needle diameter.
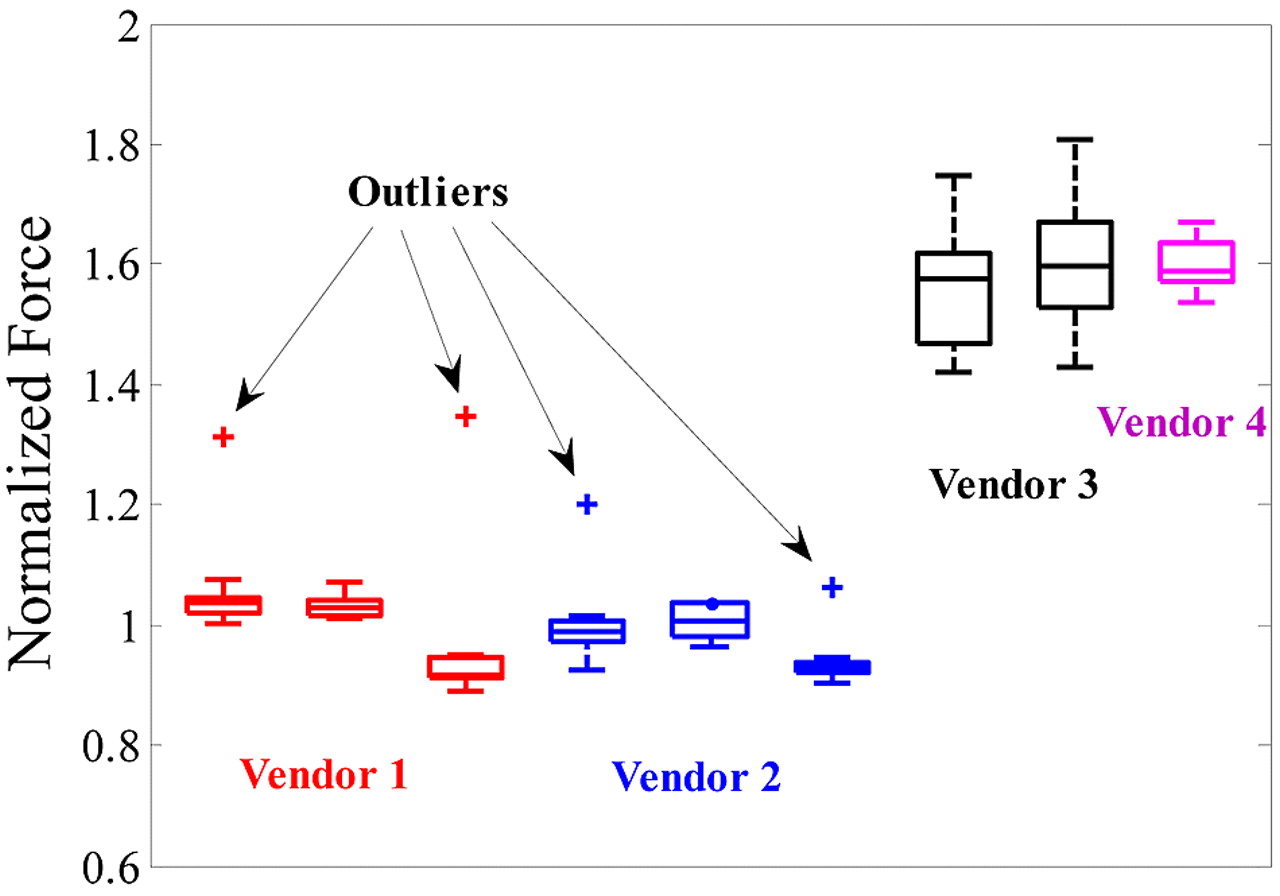
In reality, some variation in measured pressure drop across needles would be expected due to the variability in the needle lengths as well. This method was used to estimate the variability in the needle ID for 27 G syringes from different vendors based on a sample size of 10 units per data point. Figure 3 shows a box plot for measured force (normalized) for different syringe systems. The boxes in the plot are drawn from first to third quartile with the center line being the median. The length of the bars (whiskers) is equivalent to 2.7 times the standard deviation of each data set, and as a rule of thumb any point lying outside the whiskers is considered to be a statistical outlier. The force is normalized with the mean value of force for the Vendor 2 syringe (lot 1). The plot shows that Vendors 3 and 4 syringes have the smallest needle diameter, as they have forces 60% higher than other syringes. This can cause up to a 60% increase in injection time for an autoinjector with these syringes (assuming the hydrodynamic term is dominant). On the other hand, syringes from Vendors 1 and 2 have similar forces, implying that the needle internal diameters are consistent among these syringes. Another important observation from the figure is that Vendors 1 and 2 have outlier needles that have up to 30% higher forces. This can result in up to a 30% increase in injection time. Therefore it is important to evaluate the variability in needle ID during the design of an autoinjector system. The frequency of such outlier needles could be lot-dependent, and its accurate estimation would require a larger sample set than that used in this study.

A plot showing the variability in injection force (pressure drop) for multiple lots of different syringe types. The force is normalized with the mean value of force from Vendor 2 (lot 1) and is reflective of needle radius.
C. Spring Force Characterization for Autoinjector
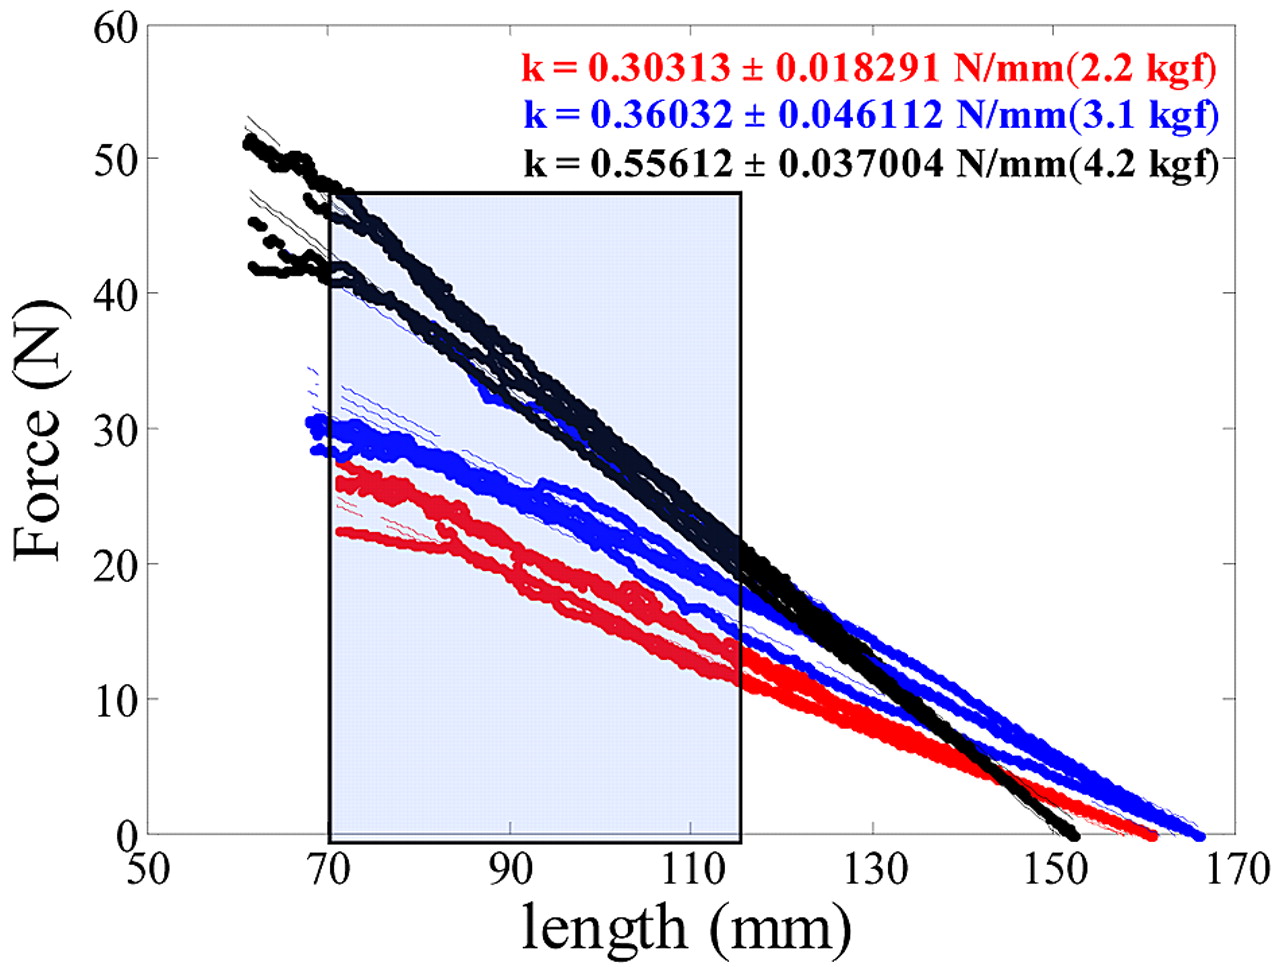
The autoinjector system included in this study has an installed spring to serve as a source of the driving force required to inject the product from the syringe. To efficiently model the autoinjector, it is important to study the force-extension measurements and estimate the corresponding variability. For this purpose, measurements were performed using springs of different stiffness with a sample size of 10 springs. Figure 4 shows the plot of force-extension measurements for springs of three different spring constants. The shaded region indicates the length over which the spring remains active during injection. The measurements were performed using both a static and dynamic test recipe. For the dynamic measurement, the spring was gradually compressed from its free length and the load was recorded as a function of length during compression. The plot in Figure 4 shows that the force extension profile is within the linear range as expected for spring-driven motion. An alternative method (static) was also employed in which the Instron compresses the spring to the installed length for a few seconds prior to force measurement. The spring was then compressed to the active length, paused, and then the spring load was recorded. As shown in Table III, the force values are lower for the static test. This could potentially be attributed to the fact that static measurements allow the spring to relax and adjust to compression, resulting in lower force relative to the dynamic measurement (where the spring is continually compressed). Either approach can be used to characterize the spring strengths, but the worst-case variability should be taken into account to design a robust autoinjector.

Plot showing the dynamic force-extension measurements for springs of different stiffness (indicated by different color). The shaded region is the length over which the spring remains active during the time of injection.
Variability in Spring Load Measurements
D. Friction Force
Variability in the inner barrel surface can be estimated by measuring the friction forces in empty syringes. Friction force can be estimated as the total force required for moving the plunger inside an empty syringe. Measurement of friction force was performed using the Instron at an injection velocity ranging from 3 to 900 mm/min. This velocity range corresponds to an injection time of 10 min to 3 s, respectively, for a 1 mL injection. The wide range of injection times was chosen to evaluate very slow plunger movement that could potentially occur towards the end of a spring-driven autoinjector. Table IV shows the mean, maximum, and range of friction force of syringes (including all lots) at an injection time of 6 s (injection velocity 304.8 mm/min) based on a sample size of 10 units per syringe lot. The standard deviations listed in the table amount to a relatively large percent error and are the result of both syringe-to-syringe variability as well as the experimental error in measuring forces of such low magnitude.
Calculated Mean, Maximum, and Range of the Friction Force at an Injection Time of 6 s
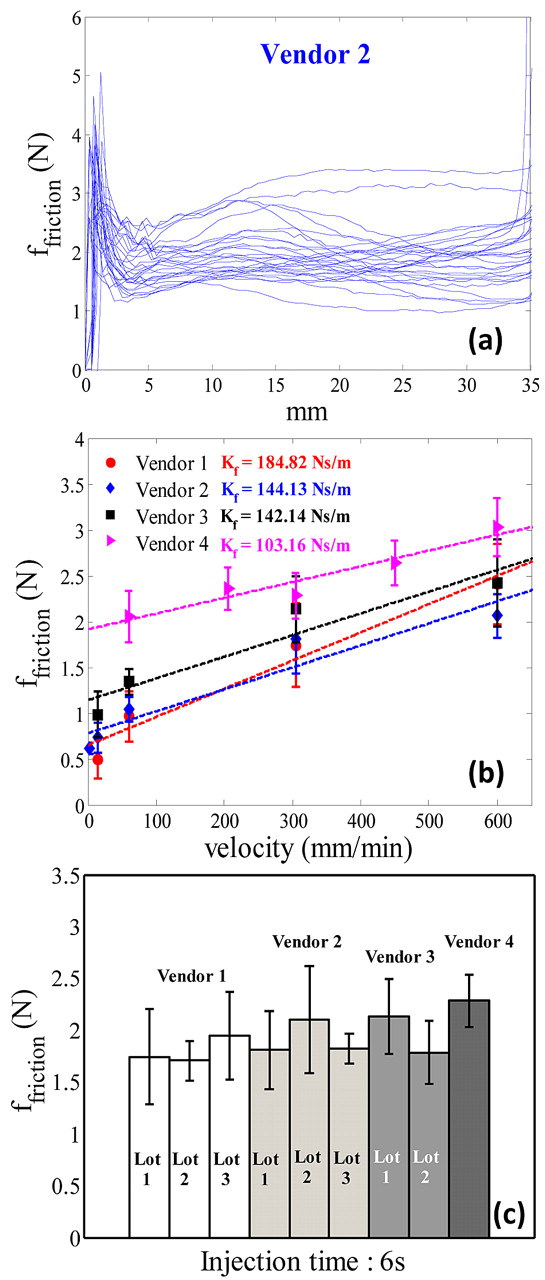
The profiles of the friction force as a function of displacement for siliconized glass syringes (Vendor 2) are shown in Figure 5(a) using an injection speed of 304.8 mm/min (injection time of 6 s). The profiles correspond to a sample size of 20 data points for two syringe lots. The profile has an initial peak in the force that corresponds to the break-loose force. The profiles of friction force show that there could be significant variation in the lubrication in the glass syringes. It should be noted that for analysis purposes the mean value of the friction force (mean of the profile) is more representative of average lubrication of the syringe barrel. The maximum value can be used in the estimation of worst-case scenarios as well as in the detection of failure points.

(a) Friction force profiles as a function of displacement for empty siliconized glass syringe at an injection time of 6 s, (b) friction force as a function of injection velocity, (c) syringe lot variability for friction force at an injection time of 6 s (304.8 mm/min).
Figure 5(b) shows the dependence of friction force on injection velocities for different syringes. Friction force increases linearly with injection velocity, which is in agreement with the theory (eq 2). It should be noted that friction forces in syringes are less than 1% of the load cell (500 N) used for Instron measurements. This could as a result contribute to large relative error in measured friction forces, especially at low velocities. The friction force is slightly higher for plastic syringes, especially at low speeds, and shows a weaker dependence on injection speed. This is due to the fact that there is no lubrication in plastic syringes and thus the frictional force follows solid-solid cohesive behavior. Figure 5(c) shows the snapshot of variability in friction force of different lots of syringes at an injection time of 6 s (which corresponds to an injection velocity of 304.8 mm/min). The figure shows that the variability in friction force is comparable within each lot of syringes. The practical range of injection time is 30 to 3 s, and the friction force for this range of injection time varies from 1 to 3 N for all the syringes under consideration. Such variability in friction forces may not have a significant impact on injection times for high-viscosity products, where the hydrodynamic component of eq 1 is dominant. However, for low-viscosity products, the frictional forces could be the key determinant of injection time and hence the syringe barrels and stoppers should be thoroughly characterized to estimate the worst-case friction force. It should also be noted that once the syringes are filled with product, friction force may change due to the interaction between product and barrel surface. Such product-specific interactions require measurement of friction force in a wetted syringe (product-filled syringe) and will be discussed in a separate article.
E. Impact of Stopper Variability
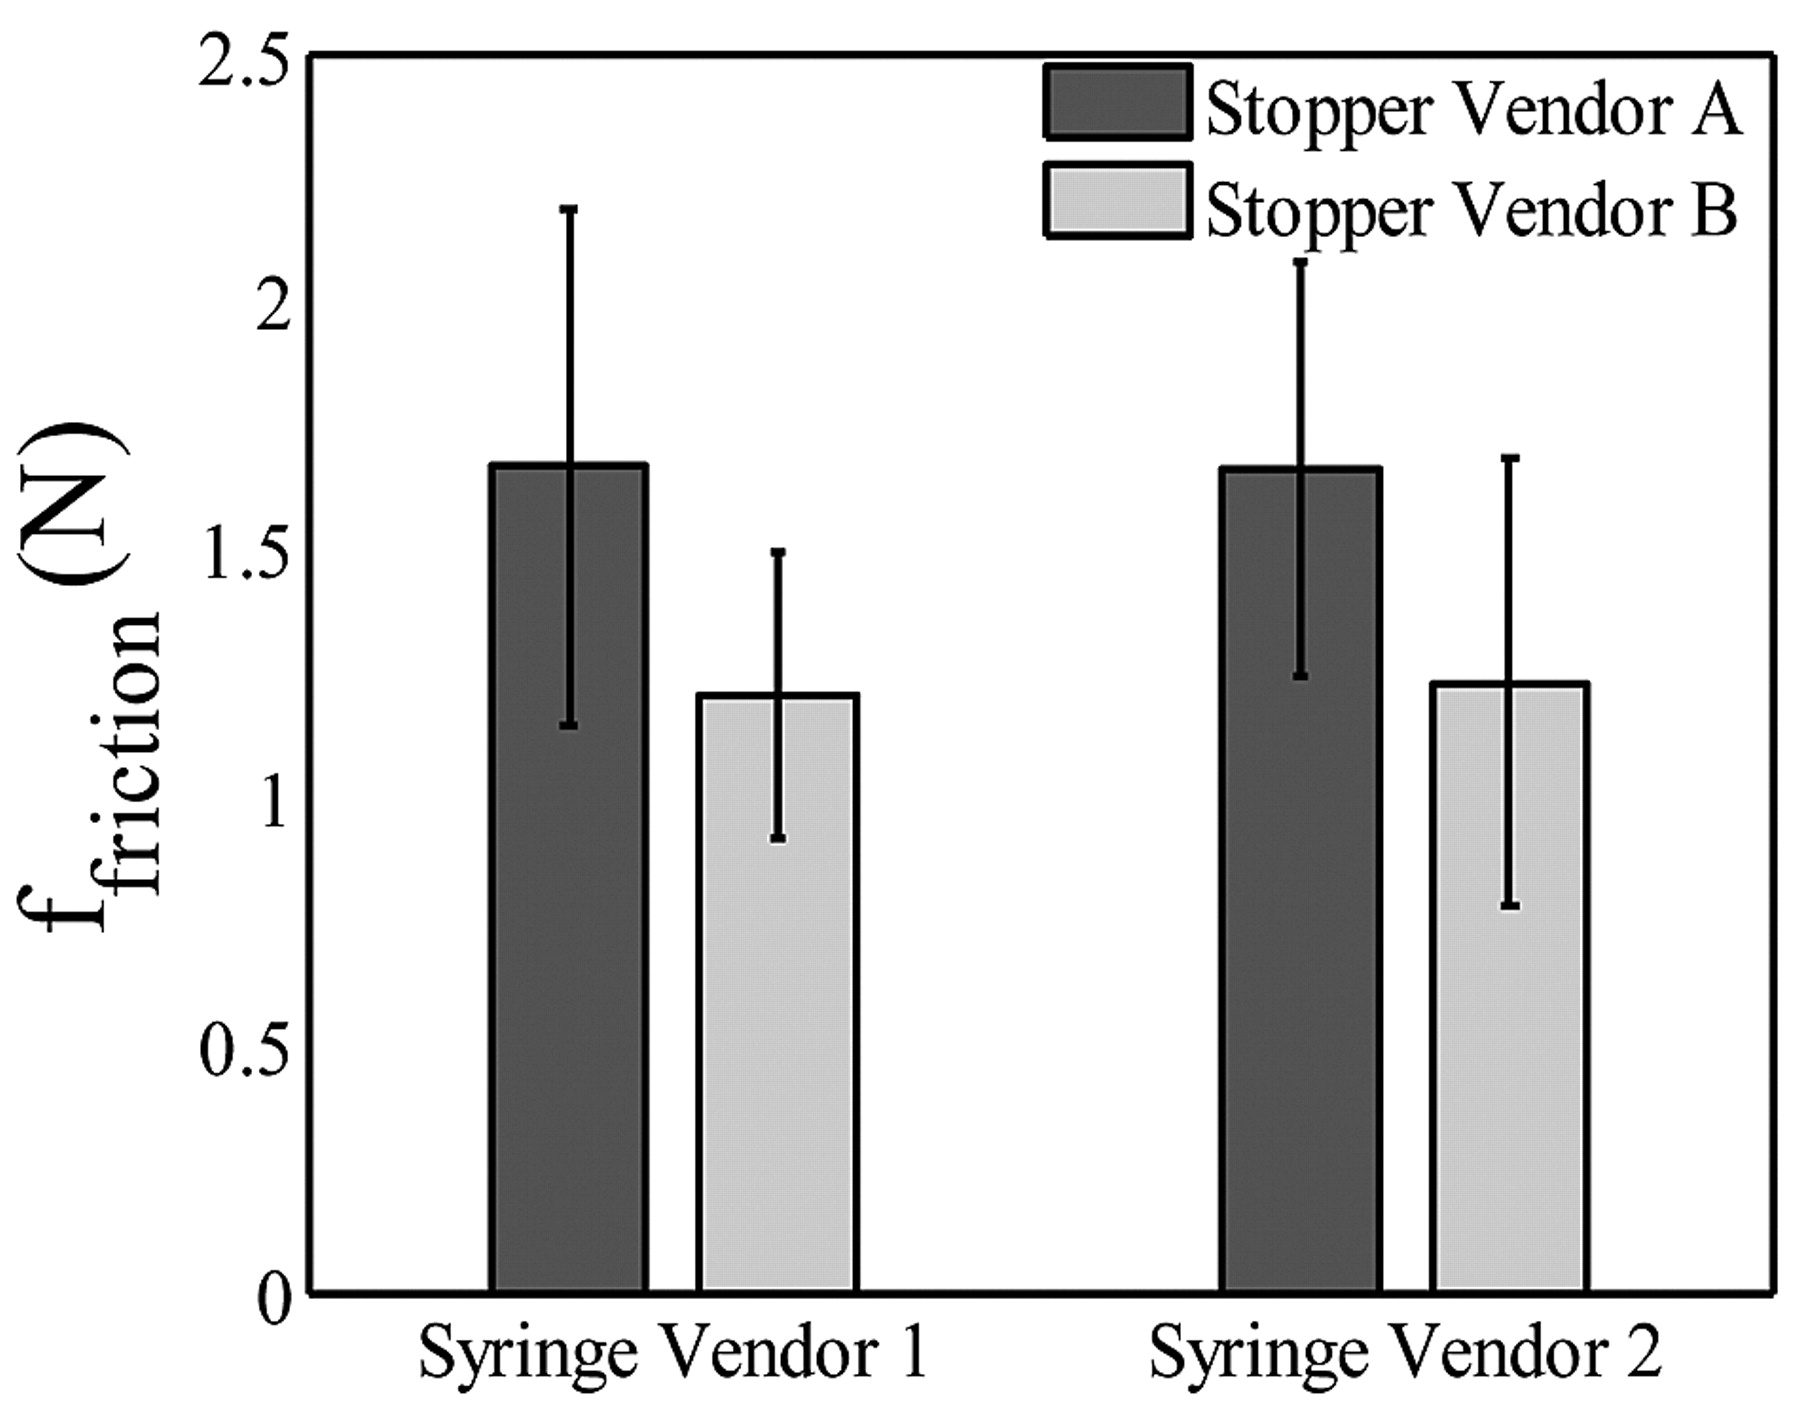
The stoppers used in glass syringes are also lubricated using silicone oil. Different stoppers could have different levels of lubrication, different materials of composition, and some geometrical variations that could affect friction forces. In this study, stoppers from two different vendors are used and the impact on friction force is evaluated. The stoppers are expected to be similar except for the amount of siliconization, with Vendor A stoppers having less silicone oil than Vendor B stoppers. The effect is studied in two syringe types (Vendors 1 and 2) at an injection time of 9 s (205 mm/min). Figure 6 shows that the impact of different stoppers on friction force could be significant: Vendor B stoppers exhibited smaller friction force than Vendor A stoppers, likely due to higher siliconization level. While the difference in friction forces is within the variability of measurement, the effect is consistent with both types of syringes used, thereby indicating that the difference in the friction force is primarily due to the stopper.

Plot showing the effect of different stoppers on glide friction force at an injection time of 9 s (205 mm/min).
F. Analytical Model Verification and Application
Equations 4 and 7 represent the analytical model that can be used to calculate the hydrodynamic component of the extrusion forces for delivery of Newtonian and non-Newtonian fluids, respectively, for any given injection speed. The friction force for the syringe-product combination can then be added to estimate the total extrusion force. Alternatively, the same methodology can be used to calculate injection time (speed) when a known constant force is used to deliver the injection. Application of the model requires knowledge of the product's rheological properties as well as the syringe needle radius, barrel radius, and needle length. While most of these parameters can be individually measured, measurement of needle diameter could be non-trivial. The methodology described earlier only allows for measurement of variability in needle diameter using a flow-based system. In this case we used Newtonian standards of known viscosities to estimate the needle size using eq 4. Experimental and calculated values were estimated for several Brookfield standards (viscosity range 5–50 cP) over a wide range of injection speeds. Equation 4 was then used to calculate the average needle radius that provides the best agreement between calculated and measured force values. Using this method, the average diameter of Vendor 2 syringe was estimated to be 0.2217 mm. Needle radii of other syringe types can then be determined relative to Vendor 2 syringes by estimating the pressure drop at a constant flow rate through these syringes. Once the needle radius is known, extrusion forces can be calculated for any sample. We recommend using a friction force specific to a given product-syringe combination, as the value can change significantly depending on the barrel surface and product properties.
a. Extrusion Force Calculations:
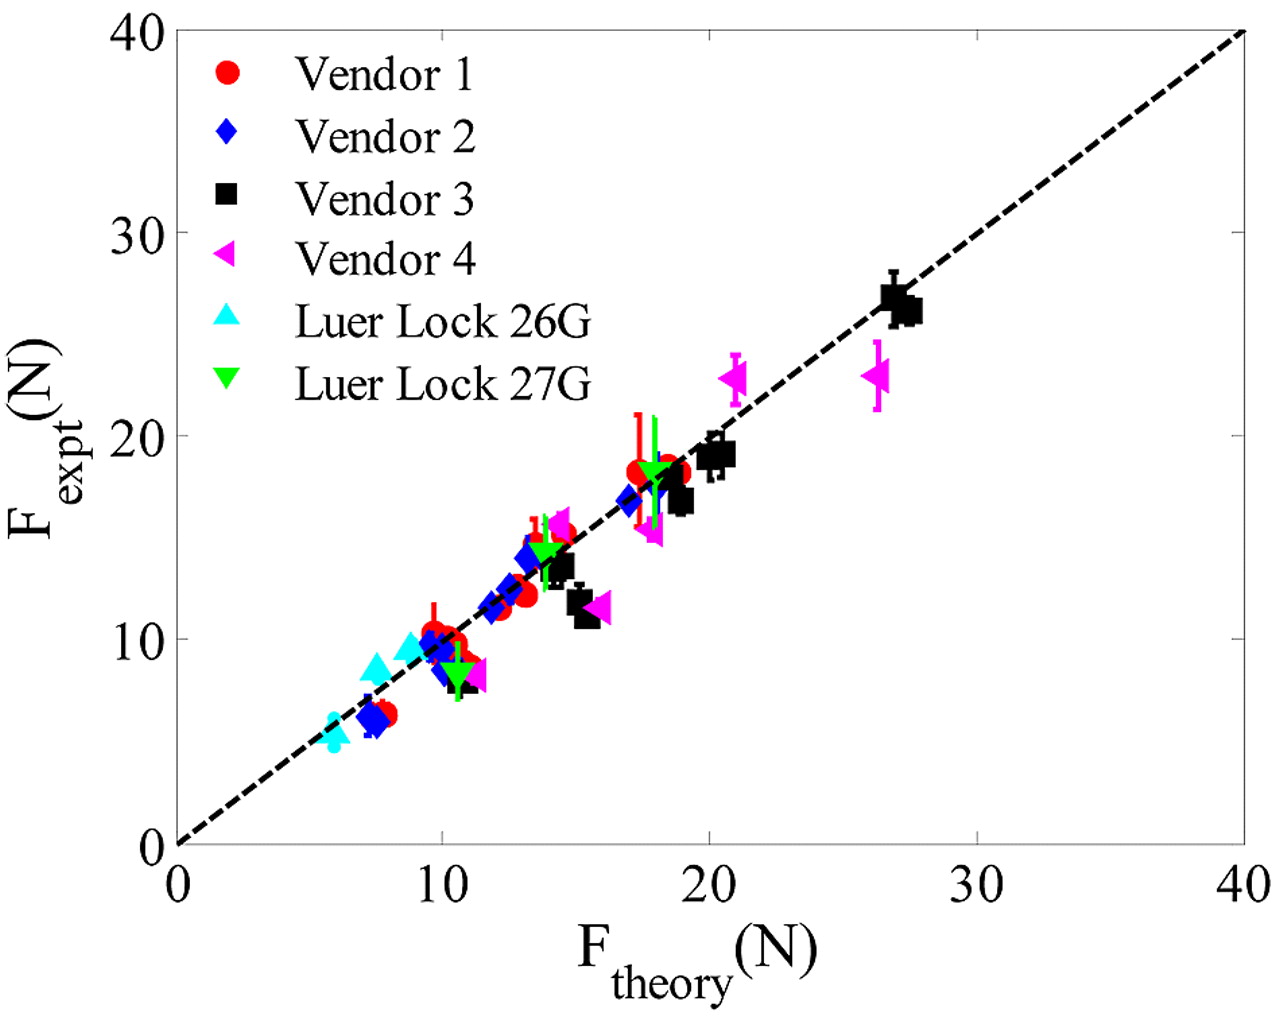
We used the analytical methodology discussed above to calculate the extrusion forces for different syringe types and different samples, and then compared them to the measured forces. Force measurements were performed using the various syringe types (both glass and plastic) on a Brookfield 10 cP standard and a product formulation at different concentrations. Two injection times were considered (6 s and 9 s). The effect of needle size was also examined using 26 G and 27 G needles with Luer Lock syringes. Each measurement was performed for a sample size of 10 units per syringe type. Figure 7 shows that the force measurements performed on the Instron and the theoretical results are in good agreement with each other. The theoretical value of force Ftheory is obtained using eq 5 assuming Newtonian behavior. The friction term is calculated using the data from wetted friction force measurements for different syringes to account for any potential product-barrel interactions. For Vendor 2 syringes, the calculated needle diameter of 0.2217 mm was used. For other syringe types, data from the flow rate method was used to adjust the hydrodynamic term relative to Vendor 2 syringes.

Plot showing an agreement between the measured and calculated values of extrusion force. The line corresponds to y = x and thus represents complete agreement between the measured and calculated values.
The analytical model allows us to estimate the impact on extrusion forces as a result of component change such as change in needle gauge. For example, for a known product-syringe combination, an extrusion force for 26 G (F26G) needle syringes can be calculated as
 where rn26G and rn27G are the size of needles 26 G and 27 G, respectively, and F26G and F27G are their corresponding delivery forces. Substituting the nominal radii for 27 G and 26 G needles, eq 13 shows that a needle of size 26 G (average ID = 0.26 mm) can reduce the hydrodynamic component of the delivery force by a factor of 2.35 when compared to a 27 G needle (average ID = 0.21 mm). Figure 7 shows that the predicted 26 G extrusion force values are in agreement with the measurements. This is a significant reduction in extrusion force and suggests that for viscous products device functionality can be improved by increasing the needle size.
Similarly the impact of change in syringe barrel size can be assessed. If the extrusion forces and friction forces for one syringe size are known, the analytical model can be used to calculate the force for a different syringe size by using the appropriate barrel diameters.
b. Injection Time Calculations:
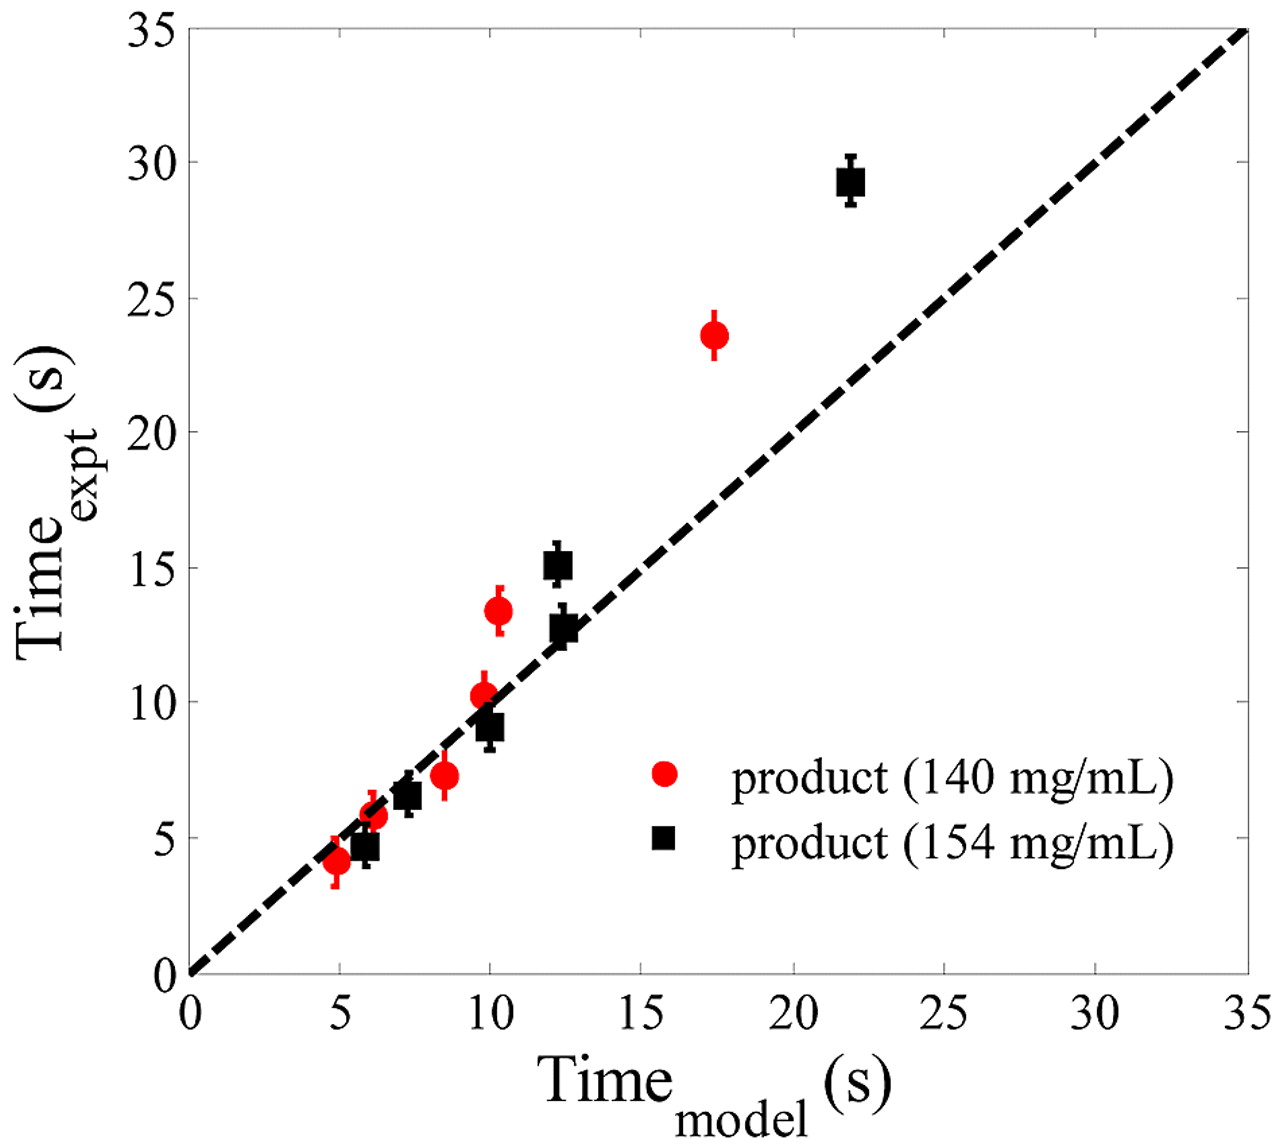
Figure 8 shows the comparison of experimental data (injection time) with the results obtained from modeling (using eq 11). The experiments were performed using three spring strengths (2.2, 3.1, and 4.2 kgf) and an antibody product at different concentrations above 100 mg/mL. The experiments were performed at two temperatures (5 °C and 22 °C). A 1 mL injection corresponds to a stopper displacement from 0 to 35 mm. The figure shows a reasonable agreement of the model with the experimental data. The model, however, under-predicts the injection time when compared to experiments in certain cases, especially at higher injection times. There are two possible causes of experimental data not matching the model for some results. First, the experimental data involves the variability of all the components in the injection device, whereas the model involves the mean value of injection time based on average solution properties and average syringe dimensions. As discussed earlier, the variation in needle alone can cause a 30% increase in injection time. Variability in other components as well as experimental measurements can also contribute to significant errors. Second, the assumptions in modeling could also contribute to some differences in calculated and measured injection times. The analysis shows that the model can provide a reasonable estimate of injection time but should be confirmed with experimental measurements.

Plot comparing the experimental results and the model prediction for injection time using an autoinjector.
G. Stack Tolerance Analysis
As discussed in this article, the variability in injection time or injection force can arise from several sources, including variability in the friction force, variability in the hydrodynamic force, and variability in the spring and other device components. Mechanistic models such as those listed in eqs 5 and 8 allow for the estimation of the impact of individual component variability on overall injection time variability via propagation of error. Partial derivatives with respect to each parameter provide the relationship between the variability in parameters and the resulting variability in the injection force or time. For example, a 5% variability in needle diameter would result in a 20% variability in extrusion force or injection time. The significance of the hydrodynamic term relative to the friction term will be governed by the viscosity of the product and the syringe used. Table V provides a list of parameters that can affect injection time for an example in which mean injection time is 10 s. The worst-case scenario calculations assume that the hydrodynamic term is the dominating component. From the table, it is quite evident that for viscous products the dominating factors in injection time for delivery systems are product concentration, needle size, and spring tension. The worst case can result in up to 80% variability in force resulting in ∼80% variability in injection time. Such a scenario represents the very low probability outcome of all parameters occupying the edge of their allowed ranges and combining to give an extreme injection time. However, such analysis helps us to identify the theoretical extremes in the performance of the protein-autoinjector combination product. This information should be used to select an autoinjector spring with adequate spring tension that can easily overcome the maximum resistance offered by the combined friction and hydrodynamic forces. Sources of variability that can be controlled (e.g., barrel siliconization, needle diameter, spring tension consistency, etc.) should be minimized to provide a robust delivery system with consistent performance. The analysis also helps to define the performance parameter specifications (such as injection time) based on a scientific understanding of the contributing parameters, and it accounts for the variability that is inherent to the chosen delivery system.
Relative Contribution of Various Parameters on Injection Time
Table V captures the impact of variation in product viscosity resulting from variations in product concentration. A separate study was conducted to evaluate the impact of product viscosity and product interactions with barrel surface on the extrusion forces. Further details have been discussed in a separate article. It should be noted that Table V does not include all potential sources of variability. For example, temperature variations outside a 2 °C range, variation in stopper siliconization, stopper dimensions, sample age, product-specific interactions, and so on would also cause variation in injection time. Also, the variability in friction/glide force listed in the table is based on the small sample size and limited number of lots included in this study. This assessment also does not capture the variability associated with multiple analysts running the measurements in different labs.
Conclusions
This article describes the characterization work conducted to evaluate component variability in a syringe/autoinjector system and the resulting impact on extrusion forces or injection time. The impact of barrel size, needle size, stopper, and spring stiffness on the performance of a delivery system is explored. Results show that needle size, product concentration, and spring stiffness have dominant impact among the parameters included in this study. Finally, an analytical model has been developed to provide reasonable theoretical estimates of delivery forces and injection times. Such mechanistic models allow the estimation of cumulated variability by stacking the tolerance in individual components via propagation of error. The model can thus be used to assess the worst-case scenario for injection time and/or extrusion force. The analytical model also provides a tool to construct a design space for the protein-device combination product.
Conflict of interest Declaration
The authors declare that they have no competing interests.
Acknowledgments
The authors thank Matt Kempton, Son Tran, Cylia Chen, and Amy Wang (Drug Product and Device Development, Amgen) for providing support towards the execution of experimental work; Scott Nunn and Ron Forster (Drug Product and Device Development, Amgen) for their assistance with syringe sourcing; Gabriel Salazar and Raul Troncoso (Metrology, Amgen) for their help with syringe needle diameter characterization; and Erwin Freund and Geoff Slaff (Process Development, Amgen) for management support towards this work and publication.
- © PDA, Inc. 2011


