
Abstract
Demonstration of effective and consistent viral clearance by small scale models of downstream processing, typically cited as logarithmic reduction value (LRV), is an important safety requirement for biotech products. LRVs have anecdotally been reported to be inconsistent in these small-scale studies, even under controlled conditions when all process parameters are held constant. It was postulated that the quality of virus spike preparations used can in some cases adversely affect performance of these studies, which, from a regulatory standpoint, would be undesirable. This, along with topics discussed in PDA's Technical Report 47 (TR47), “Virus Preparations Used in Viral Clearance Studies,” suggests that improving the quality and consistency of virus spike quality and utilizing testing procedures as described within should make these studies more reliable. However, an extensive survey to assess overall quality attributes to date has not been performed. To scout the landscape of spike preparation quality, we systematically characterized 18 commercially available virus preparations, focusing on key attributes identified in TR47: (1) infectious/total- and infectious/particle-associated copy numbers, (2) exogenous DNA/protein content and banding patterns, and (3) presence of aggregates. We found substantial variation across many of the preparations tested, often in more than one category. By modeling small-virus retentive filtration and low-pH inactivation unit operations, we show that virus preparation quality can potentially affect unit operation performance and viral clearance outcome. Our data supports the notion that during early-phase development, characterization of virus stock quality may provide an added level of control.
LAY ABSTRACT: Demonstration of effective and consistent viral clearance is an important safety requirement for biotech products. However, accumulating evidence suggests that the quality of virus preparations used in clearance studies often vary, and thus potentially affect their performance. To scout the landscape of virus preparation quality, we systematically characterized 18 commercially available virus preparations, focusing on key attributes identified in PDA's Technical Report 47 (TR47). Virus Preparations Used in Viral Clearance Studies. We found substantial variation across many of the preparations tested, often in more than one attribute category. By performing small-virus retentive filtration and low-pH inactivation unit operations on a small scale, we also show that virus preparation quality can affect unit operation performance and viral clearance outcome. Our data supports the notion that during early-phase development, characterization of virus stock quality may provide an added level of control.
Introduction
Virus clearance is a key element in biopharmaceutical quality assurance worldwide. Regulatory guidelines (1⇓–3) outline current expectations on evaluating virus clearance by downstream purification operations. This is measured in virus spike/recovery studies of small-scale models of the actual unit operation. Virus preparations used in these spike/recovery studies are prepared by standard virological methods and may contain a variety of other impurities from the host cells or growth media. Recently, a meta-analysis of a regulatory viral clearance database revealed significant logarithmic reduction value (LRV) variations reported by different firms even for unit operations considered robust and effective (4).
Virus stocks used in clearance validation studies are often made by third-party sources (referred to as contract testing organizations or CTOs; these firms may also perform the actual clearance studies as well). Although general virological principles underlying the propagation, enrichment, and purification of stable infectious virus are followed, distinct and often proprietary variations on core methods are probably employed by individual CTOs. Moreover, there are no regulatory guidelines or consensus industry standards, although a pharmaceutical-related member organization called the Parenteral Drug Association (PDA) has recently released a technical report that outline principles important for preparation and quality testing of virus spikes (5). Thus, over time a situation had arisen where variations in quality and testing of virus preparation now exist. Whether these variations have had an impact on the LRVs measured by various processes industry-wide has not been systematically addressed, but has been surmised to have occurred in several cases (5⇓⇓–8).
PDA's Technical Report 47 (TR47) (5) offers specific recommendations for preparation and evaluation of virus stocks used in virus clearance studies. Emphasis is placed, for example, on preparation methods, quality testing, and case studies which collectively illustrated a desire to ensure that virus spikes do not functionally impact a given clearance study. TR47 does not specify quality standards for virus spikes, which can vary among different viruses (that is, some viruses are easier to grow and purify) or applications (i.e., virus purity is more important for filtration where impurities can clog small pore-size virus retentive filters). It does describe several case studies where virus spike quality appeared to impact the validity of the spike/recover model used to measure the clearance capacity of certain unit operations. Most of the examples were virus filtration, where impurities can clog filters prematurely, but many were for chromatography or inactivation models. However, it was beyond the scope of the task force that wrote TR47 to go beyond a case study approach and systematically evaluate the extent and potential impact of, or to mitigate, any currently existing variations in virus preparation quality.
Here, we scout the landscape of virus preparation quality by (1) evaluating virus stocks from as many sources as feasible to determine the extent of variability in the quality attributes identified in TR47, and (2) probe whether variations can influence the outcome of two model viral clearance studies.
Materials and Methods
Virus Stocks
A total of 18 virus preparations were acquired from four sources (BioReliance, Rockville, MD; Charles River Laboratories, Malvern, PA; Wuxi AppTec, Philadelphia, PA; and Eli Lilly and Company, Indianapolis, IN), and include a diverse range of species (Table I; designated as sources “a” through “e” to minimize bias). In some cases we were able to obtain different lots from the same source. For these, lots were either prepared using the same purification approach (i.e., Pol, Reo-3; subscripts denote distinct lots) or via different methods (i.e., sources “d” and “e” were acquired from the same firm but were prepared using distinct purification methods). All virus stocks were shipped on dry ice and immediately stored in −80 °C upon receiving. Working stocks were aliquoted and stored at −20 °C during the course of our evaluations. Samples were thawed on ice and replaced to −20 °C between experiments. No preparation underwent more than five sequential freeze/thaw cycles. Please note that the specifics for the preparative or quality control methods are not generally released by most firms producing virus spikes (although TR47 advocates doing so).
Overview of Virus Spike Preparations Studied
Nucleic Acid Extraction and Quantitative Polymerase Chain Reaction (QPCR) To Determine Viral Particle Counts
All assessments were performed at least in triplicate. For particle counts, thawed aliquots of each virus preparation were diluted 1:100 in 1×TE buffer, and viral nucleic acid was extracted via mini-column purification (Qiagen, Valencia, CA). In some cases, diluted samples were treated with 10× DNAse I (Ambion, Life Technologies, Grand Island, NY) prior to extraction (final volume 140 μL); a 1:100 dilution prior to extraction was necessary to remove test article effects on DNAse I cleavage kinetics (Supplementary Table SI). For those viruses measured using QPCR, information on primer/probe sets were acquired based on previous publications [MMV, (9); MuLV, (10); PRV, gB subunit, (11); Reo-3, (12)] and nucleic acid standards, when needed, were freshly prepared and sequences were confirmed prior to use. For PPV, primers (Primer 1: 5′ CAAGACGATGCACACACACAAA 3′; Primer 2: 5′ CACTCCCCATGCGTTAGCA3′) and probe (5′ CTATTAGTGACCAAGGTGTTAC 3′ MGBNFQ) is added to a pre-made master mix (TaqMan® Universal PCR Master Mix, 2×) following manufacturer instructions. Reactions (40 μL volumes) are loaded onto a 96-well plate format and run (ABI 7900HT, Applied Biosystems, Foster City, CA) using a standard-curve format, as follows: Stage 1: 50 °C for 2 min; Stage 2: 95 °C for 10 min; Stage 3: 95 °C for 15 s, 55 °C for 1 min, repeated 39 times; Stage 4: 25 °C hold.
Assessment of matrix inhibition and optimization of nuclease digestion pre-treatment for samples assayed in this study
Quantification of Exogenous Nucleic Acid
Double-stranded DNA (dsDNA) was quantified using a commercially available fluorescent-based assay (PicoGreen, Invitrogen, Life Technologies, Grand Island, NY). Standard curves, samples, and reagents were prepared according to manufacturer guidelines. For viruses containing a single-stranded DNA (ssDNA) or RNA genome (MMV, Pol, PPV, Reo-3, MuLV), whole virus prep extracts (as described above) were used as starting material. For PRV (dsDNA genome), total nucleic acids were extracted with or without DNAse I treatment, and the exogenous nucleic acid content was determined based on the difference between untreated and treated values. As an attempt to rule out protein contaminant interference effects and to confirm optimal degradation of free dsDNA, QPCR to detect levels of undigested mouse genomic DNA was performed as described (17). Purified DNA extracts (5 ug per sample) were incubated with 5 or 10 units DNAse I following manufacturer recommendations. Also, although challenging due to the overall levels of dsDNA present, we loaded virus preparation samples onto a 1.2% agarose gel stained with Ethidium Bromide (13) to assess for differences in banding patterns or smearing effects. Experiments were performed in triplicate; results shown are mean values.
Quantification and Analysis of Protein Content
Total protein content for each virus preparation was determined using the Bio-Rad Protein Assay (Bio-Rad, Hercules, CA), in triplicate. Starting material consisted of 25 μL of each virus preparation. To assess protein banding patterns across virus preparations, we performed SDS-PAGE (pre-cast 4–12% gradient gels, Invitrogen) following manufacturer guidelines. Protein bands were visualized using the Coomassie-Blue technique with standard reagents and protocols (13). Samples were equally loaded into gel lanes as based on total protein content, determined as described above.
Aggregate Quantification
Presence of aggregates was assessed by filter sizing using track-etched filters (Whatman, GE Healthcare, Piscataway, NJ) with pores sizes of 200 nm, 100 nm, and 50 nm, respectively. Filter pore size selection was based on the size of virus being assessed (i.e., the next larger size available relative to the virus diameter). Virus preparations were thawed, diluted 1:100 in sterile 1× PBS (5 mL per sample), and passed through a given filter using a handheld syringe. Aggregate count consisted of the calculated difference in viral titers (QPCR) between load and filtrate samples for a given virus preparation. Experiments were performed in triplicate; results shown are mean values.
Viral Clearance Studies Overview
Virus preparations were categorized as being either “crude” or “purified” based on our characterization studies and with respect to limited publicly accessible vendor-cited infectious titer claims. In the context of this manuscript, use of the term “crude” and “purified” should not be construed to imply details of how the individual preparations were made, nor that certain preparations evaluated in this study would be more suitable than others for particular applications. Small-scale viral clearance studies for low pH inactivation (MuLV) and small virus retentive filtration (PPV) were then performed, in triplicate, to assess for trends between preparation quality and LRV. Model feedstock consisted of a highly concentrated, partially purified proprietary IgG4 in-process intermediate diluted to 5 g/L mAb in 1×PBS pH 7.4; this concentration of mAb to be used was experimentally determined to ensure an adequate range of throughput and flow decay values (Supplementary Figure S1). Viral clearance studies and corresponding infectivity/QPCR assays were conducted as described previously (14, 15) or as above for PPV. Briefly, for low pH inactivation, the in-process intermediate (20 mL volumes per experiment) was spiked with 2.5% (v/v) MuLV. The pH was lowered to 3.7 (±0.1 pH units) and held for 5, 15, 30, or 60 min, and neutralized (pH measured as >6.0) while gently stirring. For filtration studies, 20 mL in-process intermediate spiked with 0.1% (v/v) PPV was filtered through NFP virus retentive filters (Millipore, Billerica, MA) at constant pressure (30 ± 2 psi).
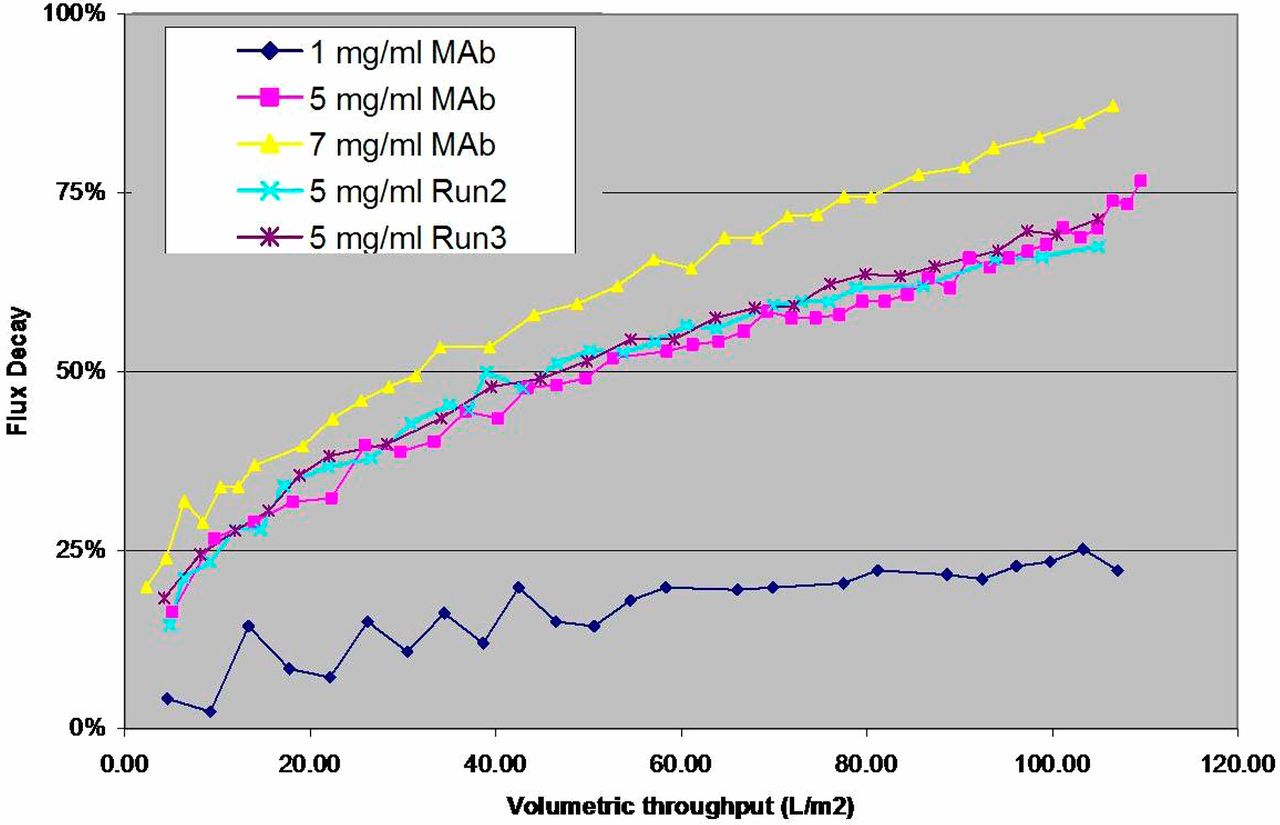
Assessment of unspiked feedstock containing mAb intermediate at 1, 5, or 7 mg/mL antibody. Plots of flux decay over volumetric throughput identified 5 mg/mL mAb as the lowest concentration tested that provided a suitable range of values for subsequent functional comparison studies. See Materials and Methods for further detail.
Results
The attributes of a virus preparation that can potentially impact the performance and validity of a virus spike/recovery study include identity, titer (as well as particle:infectivity ratio), and presence of aggregates and impurities (5). To see if these attributes can vary between sources, we systematically characterized 18 virus preparations from four different sources using methods intended to measure preparation purity and monodispersity. These preparations represent six commonly used model viruses with a broad range of biophysical/biochemical properties (Table I).
Particle counts by QPCR
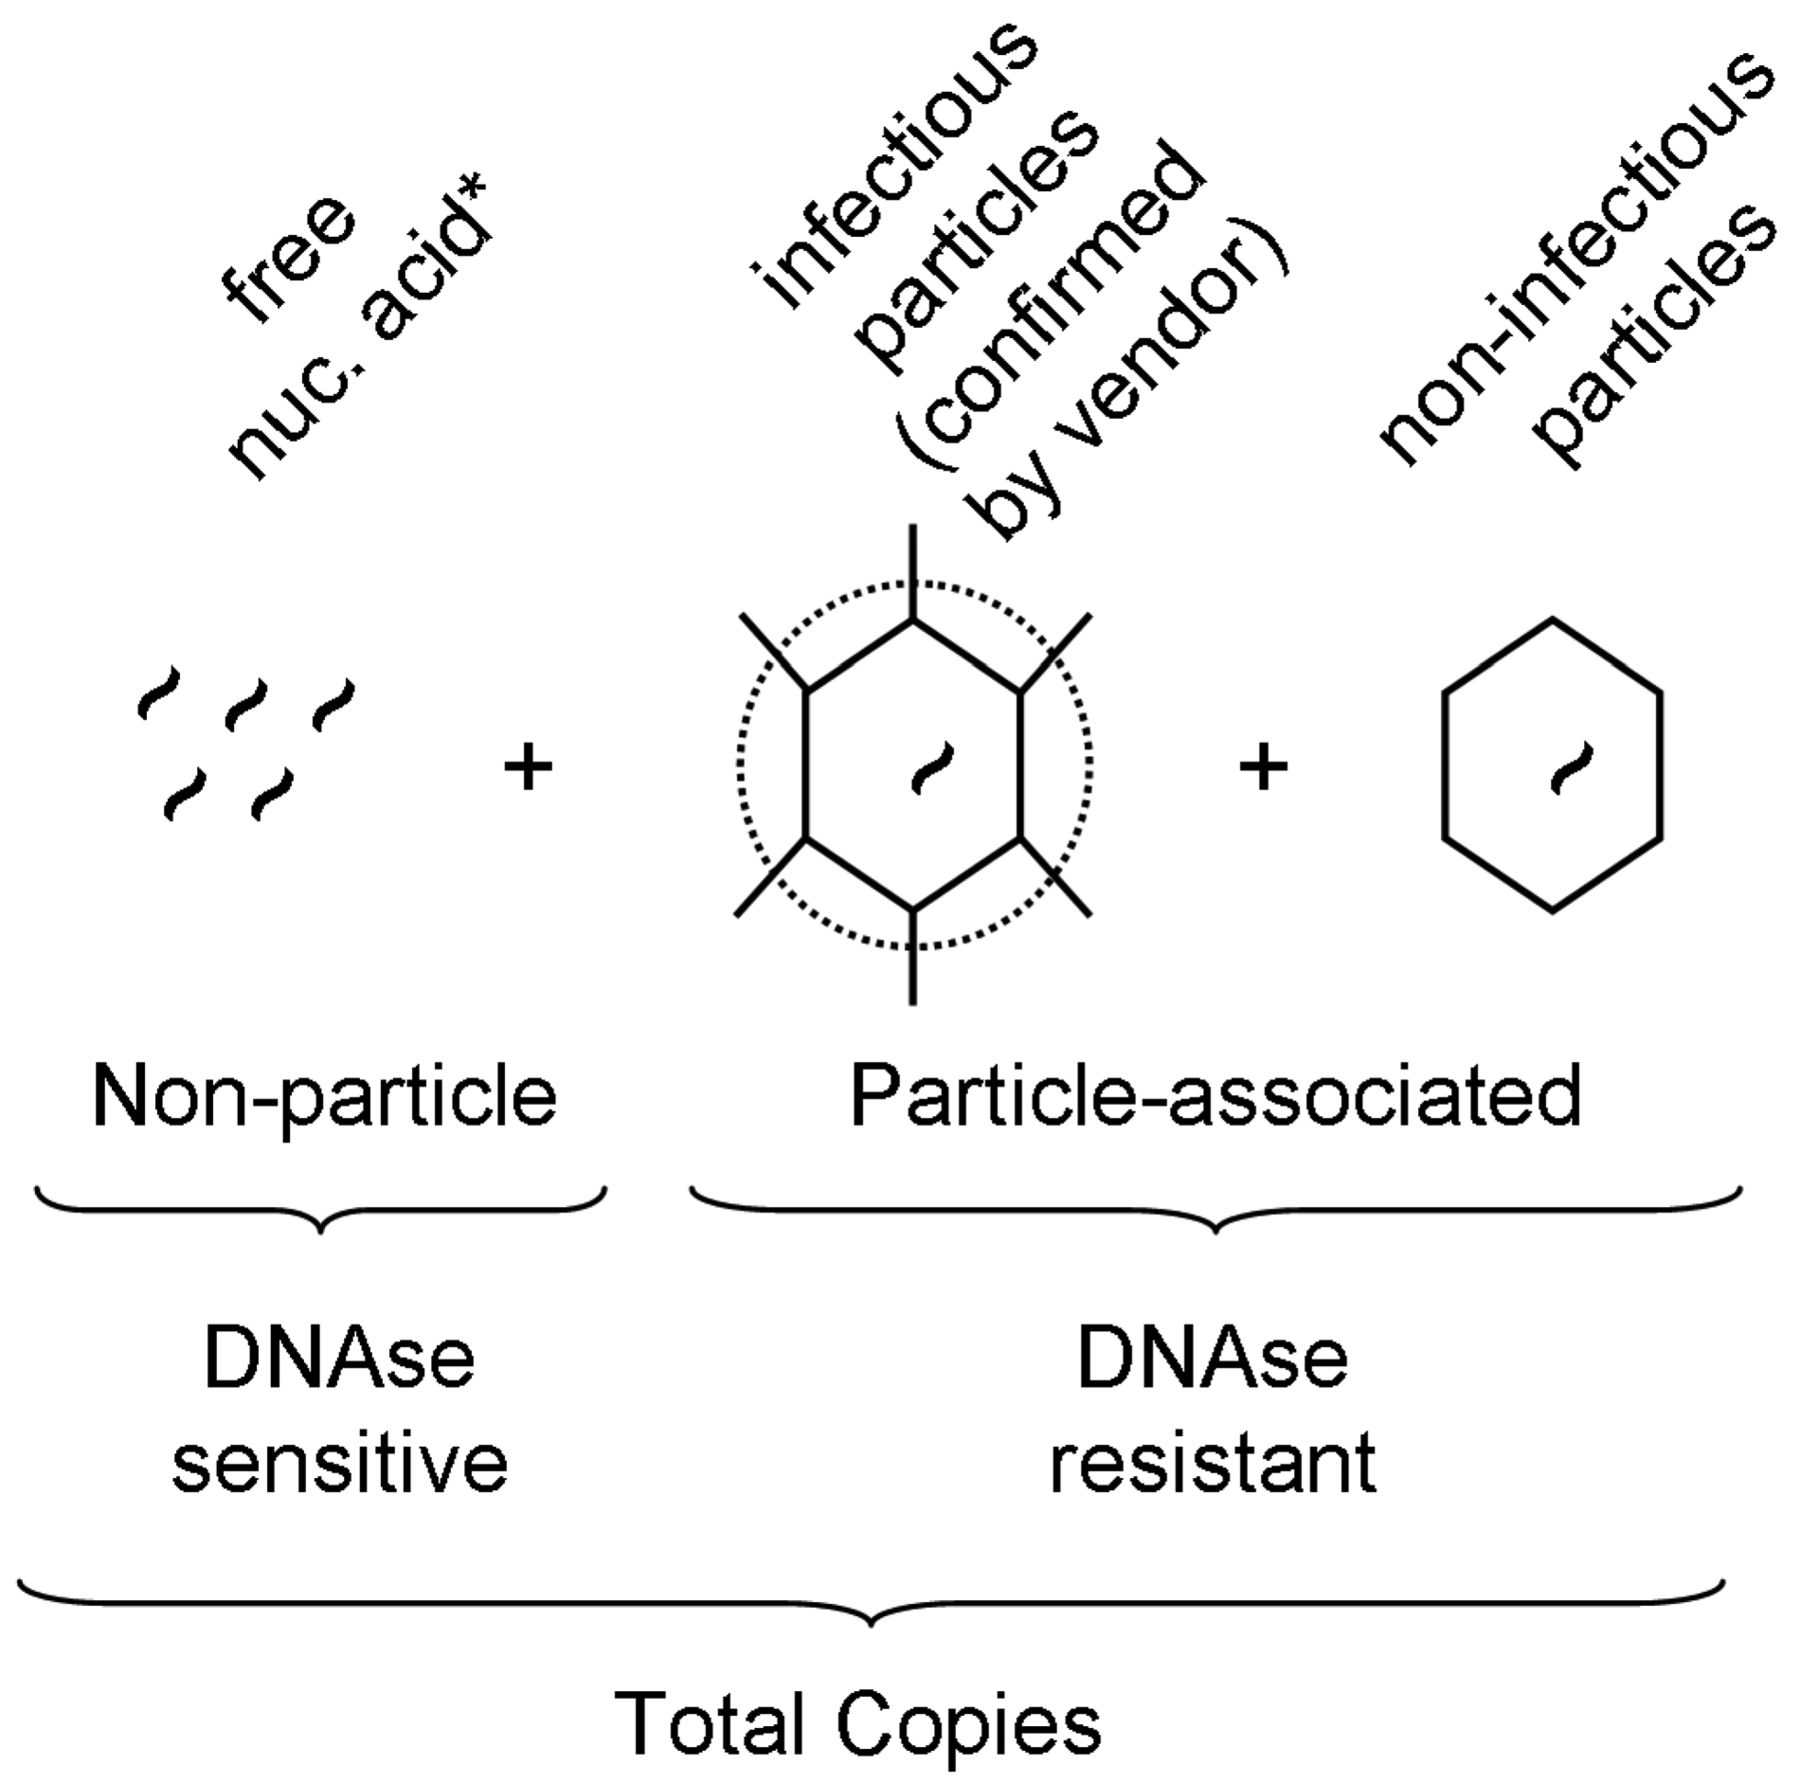
Virus preparations may vary in the ratio of infectious virus to total particle counts; while this ratio in theory can be 1:1, it is hardly ever such. Among the generally acceptable methods for particle quantification, QPCR is advantageous in that, if properly optimized, it is quite robust with regard to virus specificity, and is highly sensitive and precise. Therefore the resulting data measure the actual particle of interest (e.g., not empty capsids or protein agglomerations as may be counted by electron microscopy). However, since QPCR cannot differentiate free viral genomes from intact virus particles, the method could potentially overestimate the particle counts (Figure 1). Therefore, in order to minimize overestimation, a carefully titrated DNAse I treatment is required prior to nucleic acid extraction, which should digest most free or extra-capsid viral nucleic acid. To illustrate, results for PRV show that when compared to nonDNAse I treated samples, in our system those preparations undiluted or diluted 1:10 prior to enzymatic digestion revealed that a 1:100 dilution was the minimum required in order to achieve full degradation of free nucleic acid (Supplementary Table SI).

Schematic representation of virus-related nucleic acid present in a given stock preparation, and calculation of quantitative PCR-derived values. Virus-specific nucleic acid detectable by QPCR consists of particle- and non-particle associated copies. Non-particle-associated copies are sensitive to DNAse I treatment while particle-associated copies are DNAse I resistant. By comparing DNAse I treated versus nonDNAse I treated samples, and in conjunction with source-reported titers (see methods), estimates of copy number and percent of infectious particles could be calculated, respectively. *Note that for RNA-genome viruses, DNAse I treatment is not performed and is assumed that the overall stability of free, unprotected RNA is at levels below meaningful significance.
Ideally, virus preparations would have a low particle/infectivity ratio, although this is often not the case (6, 16). By using titers certified by the sources and our QPCR-generated particle counts, we were able to distinguish infectious virus particles from non-infectious particles and estimate the ratio (Figure 1). We found based on these calculations that many of the preparations (10 out of 16) contained fewer than 1 infectious unit per 100 total particles (Table II). However, substantial overall variability was noted, as was also revealed when comparing values across sources of the same virus (Table II) as well as when grouping sources across virus species (Figure 4a). PPV preparations possessed the widest range of infectious to particle-associated copies. The two Reo-3 preparations tested the highest percentage of infectious viruses and the lowest ratio variations between the preparations. Of particular interest, after rank ordering the data in order to identify potential trends among sources, we found that source “b” consistently ranked lowest, whereas source “a” was typically what could be viewed as the most favorable.
Particle Count Assessment
Protein Content
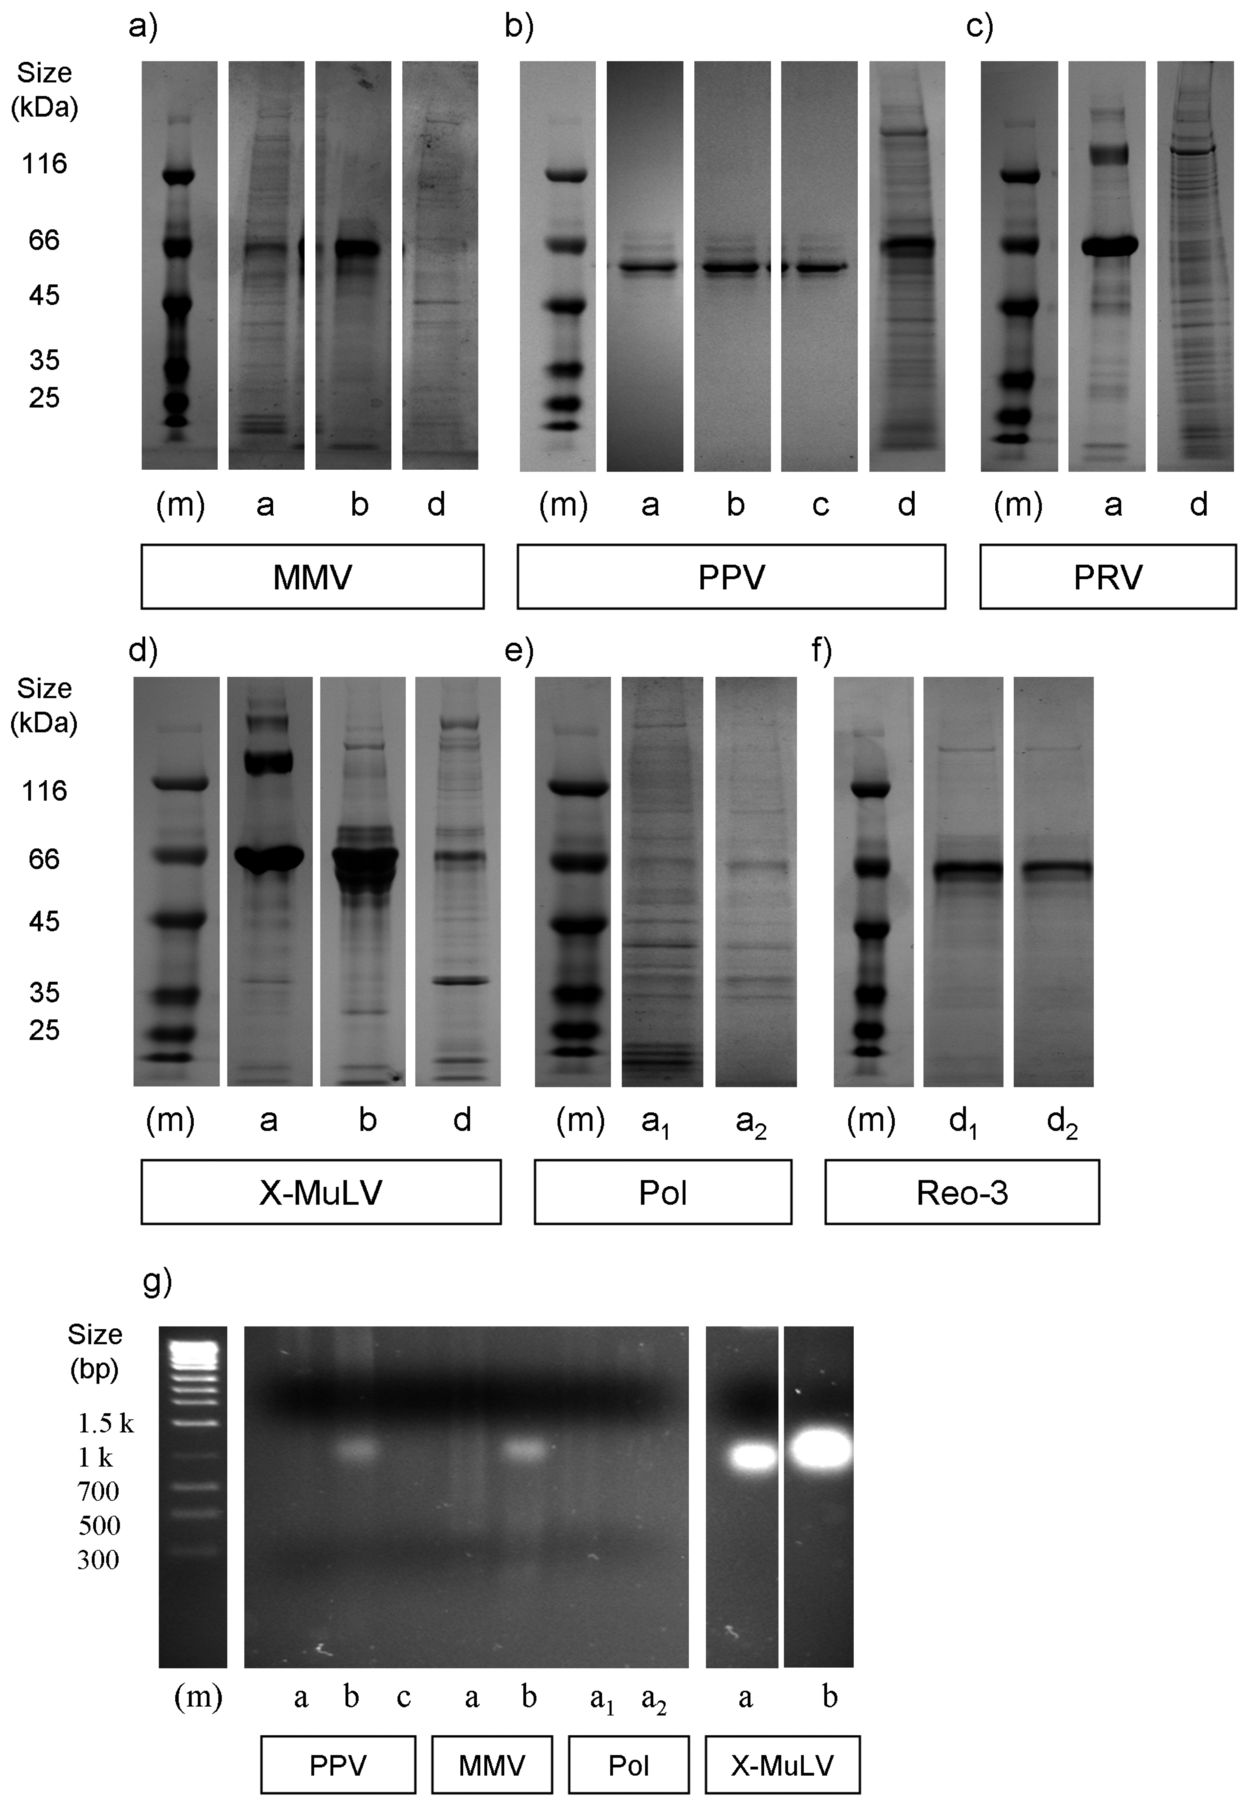
Ideally, virus preparations would have a very high infectivity:protein ratio, as this would ensure potency of the spike while minimizing any influence on the unit operation by undesirable protein contaminants (5). To get a snapshot of the variations existing across sources, total protein levels were quantified by Bradford assay (Table III) and banding patterns visualized by SDS-PAGE analysis on Coomassie Blue–stained gels (Figure 2). This approach does not distinguish host- from viral-derived protein, although the latter comprises only a marginal amount of the total protein present (5). In addition, a dense band near the 66 kDa marker (e.g., as shown in Figure 2a, c, d) was present in some samples, and based on size, likely corresponds to Albumin. Commonly added as a stabilizing agent, its presence in many cases greatly contributed to the overall protein content as measured by Bradford assay (e.g., compare Table III with Figure 2).
Impurity Assessment

Protein and host-cell DNA (hDNA) content across virus preparations. (a–f) Coomassie-stained SDS PAGE samples, under reducing conditions and following manufacturer guidelines. Marker (m) denotes relative size of protein and DNA bands, with size (kDa) denoted on left, respectively. (a–c) DNA viruses. (d–f) RNA viruses. (g) genomic host-cell DNA (hDNA) content for a subset of virus preparations tested. For all panels, letters below each lane denote vendor (CTO) source. For each virus, lanes were loaded equally based on total protein concentration. Note for all virus stocks from source e that any protein, if present, was below our limit of detection (data not shown).
The calculated values representative of total protein/viral titer can be considered an indicator of preparation purity (5). As with virus particle assessments, we found varying levels of total protein, both across source and across virus species (Table III, Figure 4b). The banding patterns of MMV, PRV, and MuLV were distinct from one another (Figure 2, panels a, c, d). These likely reflect differences such as protein expression patterns intrinsic to the propagation cell lines, variations in culture conditions, or harvest and virus purification methods. On the other hand, PPV banding patterns were similar for most sources, despite the varying amounts present. PPV also exerted the most dramatic variance in infectivity/particle ratio, with a >1000 fold difference between sources “a” and “b,” likely due to the addition of Albumin in preparations from the former but not the latter (Figure 2a, note the predominant band from SOURCE “a”). We also found that when comparing across virus species, the two enveloped viruses MuLV and PRV contained the greatest ratio of total protein per pfu (Figure 4b). Lastly, there was an abundant band in some preparations that likely corresponds to Albumin, which is often added for maintaining virus stability.
dsDNA Content
Ideally, virus spikes would have little extraneous DNA. Using a fluorescence-based detection method (PicoGreen), we assessed levels of exogenous double-stranded DNA (dsDNA) content. For the majority of viruses this was performed with whole nucleic acid extracts. However for PRV, which possesses a dsDNA genome, levels were quantified both with and without DNAse I treatment prior to extraction. Optimization experiments were performed in order to rule out enzyme interference due to nuclease activity inhibitors in the test articles (Supplementary Table SII). As with infectious particle counts and protein content, PPV preparations had the greatest variations in DNA content (>100 fold) among different sources. As with protein content, MuLV and PRV contained elevated levels of dsDNA (Figure 4c). Pol and Reo-3 preparations, in which separate batches from the same source were acquired, had the least amount of variability. This suggests that it is easier to maintain at least some degree of consistency for some viruses. Using DNA gel electrophoresis it was found that although not all preparations contained visible DNA by this approach, those that did often displayed different banding/smearing patterns (Figure 2g). That is, we found that some contained a predominantly high molecular weight genomic host-cell DNA (hDNA) smear versus some which predominantly contained low molecular weight hDNA. This was of interest since it has been proposed that at least in terms of protein content, it is the qualitative nature (e.g., molecular weight range) and not the quantity of impurities which is most relevant (8). Also, sheared and intact genomic DNA in theory could clog filters differentially. Some preparations also revealed a distinct band ranging between 1.0–1.3 kb (possibly rRNA), which could not be correlated with virus genome type, although they were only present in samples from sources “a” and “b.”
Assessment of DNAse I Treatment to Rule Out Interference Effects
Aggregation
Virus aggregation can introduce LRV bias in certain cases. For example, aggregates can block access of individual viruses to indicator cells, thus reducing the titers that can be measured by infectivity assays. Also, they may slow down penetration of inactivating chemicals, thus potentially influencing the inactivation kinetics. On the other hand, large aggregates of even small viruses can get trapped in filters, exaggerating their clearance capacity. All of these can lead to either an under or overestimation of viral clearance, depending on the mechanism of action of the unit operation. We performed filter sizing studies using track-etched filters with pore sizes having the next-larger diameter, relative to the diameter of each virus, as follows: MMV, PPV, and Polio (50 nm pore size filters), Reo-3 (100 nm pore size), PRV, and MuLV (200 nm pore size), respectively (see also Table I for calculated virus diameters). This approach would entrap any aggregates present in a given preparation, while still allowing monomers to pass through, and therefore remain in the filtrate. The percentage aggregates in a given preparation can be calculated as 100% × [1 − (titeroutput ÷ titerinput)]. Testing freshly-thawed aliquots, we found based on ratios of titerinput to titeroutput values that the majority of virus preparations contained substantial amounts of aggregates (ranging from ∼25% to 88% overall; Table III; Figure 4d). We also calculated the log10 loss in viral titer and found that out of all virus species tested, PPV seemed to consistently have the lowest degree of aggregation; for example, only one out of the five preparations (20%) exhibited loss greater than 0.5 log10 (0.52 log10), the value corresponding to the limit of assay variability.
Functional Impact of Virus Preparation Quality on Viral Clearance
Ideally, virus spikes would have no impact on unit operation performance. We investigated the functional significance of variations of our preparation qualities on viral clearance unit operations. This is important from a regulatory perspective since ultimately viral clearance studies are intended to demonstrate sufficient virus clearance by the manufacturing processes at production (thus, any bias or measurement imprecision introduced from the spike would be artificial and of utmost concern). Since our intentions were to provide a proof-of-principle approach rather than an exhaustive study, we needed an algorithm to decide which preparations to test. To do this, each preparation was grouped by virus species and then nominally ranked (Tables II and III) based on the combination of infectivity, protein, and DNA content data, and publicly disclosed vendor claims. Aggregates can be removed from virus preparations by 100 nM pre-filtration, thus we focused on the aforementioned quality attributes to uniformly bin each preparation according to whether it was deemed relatively crude versus relatively pure (for some viruses these designations were more subjective than for others). We then chose two preparations per virus species (PPV, MuLV) for further study, denoted as Prep 1 and Prep 2, using low pH and filtration clearance studies under set-point limit challenge conditions (i.e., pH 3.7, use of NFP filters known to experience breakthrough, etc.), respectively. Lastly, note these studies were performed in order to determine generally whether preparation quality impacted viral clearance; we had neither the ability nor the justification to release any information regarding the CTO/source of the preparation(s) tested. Our rankings were not meant to endorse one preparation over another; use of the terms “Prep 1” and “Prep 2” were chosen so as not to imply (1) knowledge of specific details regarding how individual preparations were made; nor (2) that certain preparations evaluated in this study would be more suitable than others for particular applications.
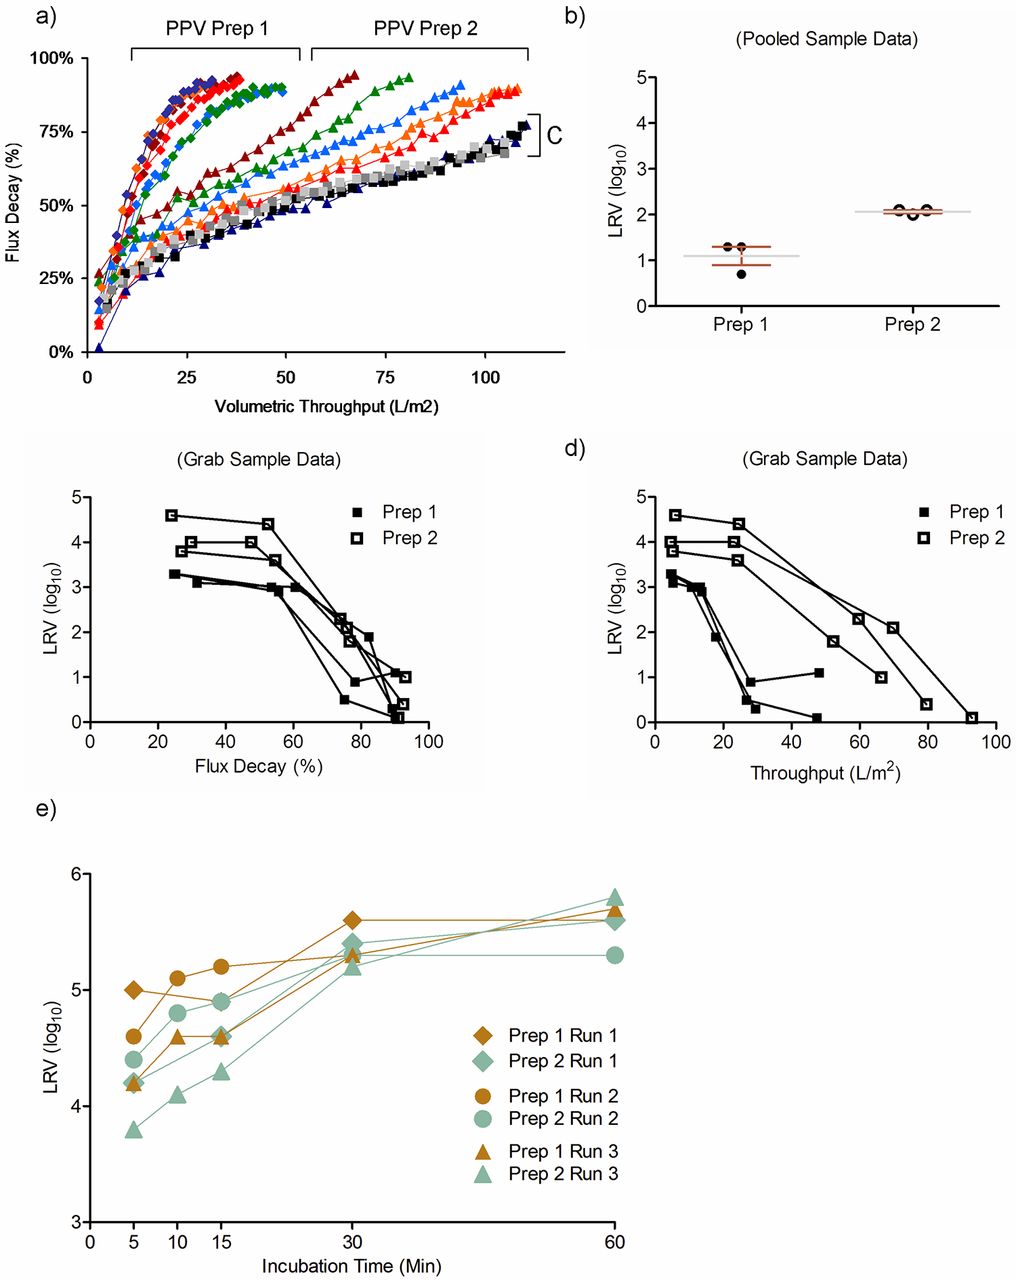
For our filtration studies, we spiked (1%) our model feedstock with PPV Prep 1 or Prep 2 and generated plots of throughput versus flux decay from the resulting run data. We found that volumetric throughput/flux decay plots corresponding to feedstocks spiked with Prep 1 were clearly distinguishable from both Prep 2–spiked and non-spiked control feedstocks (Figure 3a), in terms of Vmax. Assessing viral clearance by testing filtrate pools (Figure 3b) demonstrated a 1.0 log10 difference between groups (Prep 1: 1.1 ± 0.2 log10; Prep 2: 2.1 ± 0.03; P < 0.05), indicating that virus preparation impurities in the feedstock of Prep 1 may have influenced flux decay driven PPV breakthrough, thus resulting in a lower LRV. To track this effect across the duration of the filtration runs, we at the same time tested grab samples that roughly corresponded to 25%, 50%, 75%, and 90% flux decay. Although similar viral clearance was achieved by 75% flux decay, we found significant differences in clearance between preparations at ∼25% and ∼50% flux decay, respectively (P < 0.05 at both flux decay points; data not shown). Finally, we plotted flux decay (Figure 3c) and throughput (Figure 3d) as a function of LRV and noted that samples of differing spike quality again clustered into two distinct LRV groups. In these studies however it appeared that plotting LRV against throughput and not flux decay more clearly highlighted how preparation choice can impact filter performance (compare Figure 3c to 3d).

Assessment of viral clearance comparison. (a–d) two distinct preparations of PPV; and (e) two preparations of MuLV. (a) Preparation 1 (Prep 1) impedes flux and throughput, compared to Preparation 2 (Prep 2) and a no-virus control (C). (b) Small virus retentive filtration comparisons additionally reveal a significant difference in LRV for pooled samples; P = 0.005. (c, d) Plots of flux decay (c) and throughput (d) over LRV reveal differences between preparations. (e) Low pH inactivation of MuLV preparations slightly differ at early time points, but as expected is overcome at extended incubation times.
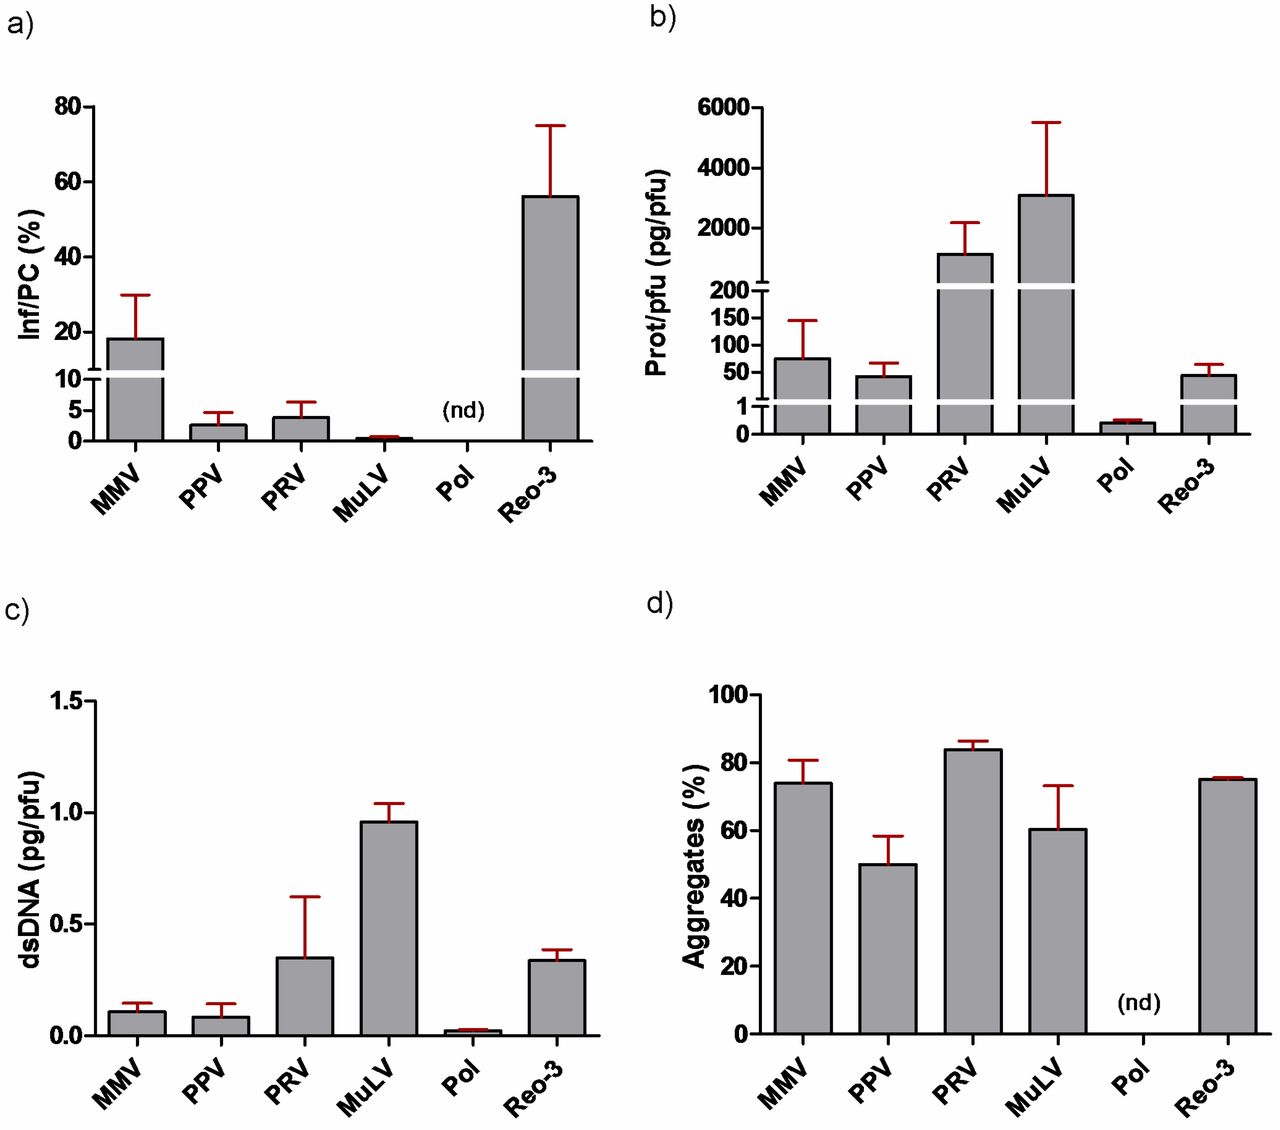
Qualitative analysis of virus preparations grouped across CTO/source, as follows: (a) PCR copy number of virus genomes corresponding to infectious-to-total particle counts (Inf/PC), percentages shown. Reo-3 and MMV trend toward having greater infectious titer per total particle count, compared to PPV, PRV, MuLV, and Pol. (b) Total protein content by Bradford assay. (c) Levels of double-stranded DNA (dsDNA) across virus preparations as determined by a fluorescent-based detection assay (PicoGreen®). (d) Percent aggregates across virus preparations, revealing that all contain substantial levels of aggregates (ranging from ∼50% to 80% for each virus). Note that for all panels, statistical comparisons were not performed due to the low number of samples per groups, which ranged from n = 2 (Reo-3) to n = 5 (PPV).
Given the robustness of this inactivation unit operation at pH values ≤3.6 (14) we set our target pH slightly higher (3.7 ± 0.1, 20 °C) in an attempt to mimic challenge conditions. Samples containing product intermediate were spiked with MuLV Preps 1 or 2, incubated in low pH buffer, and subsequently neutralized at T = 5, 10, 15, 30, and 60 min. We found that for each replicate study (n = 3 for each preparation) performed, the inactivation kinetics appeared to be offset between groups. This was more pronounced at early time points (Figure 3e). However, as follow-up studies were not possible due to the limited amounts of virus we were able to acquire, additional work is needed to better define the precise inactivation kinetics between these preparations. In addition, which virus preparation attribute contributed to this delay and whether it is exists in other preparations is unclear.
Discussion
Variations in the overall quality of CTO-generated virus preparations had been reported anecdotally (7), spurring the formation of a task force that ultimately wrote PDA's TR47. The PDA TR47, “Preparation of Virus Spikes Used for Virus Clearance Studies,” is a comprehensive document which includes a description of important quality aspects to control in these spikes and summarized case studies highlighting the potential impact of the virus quality variations on clearance studies. We have expanded upon this theme by characterizing an assortment of commercially available virus preparations. To maintain confidentiality and minimize bias, information pertaining to the specific sources and the methods used to produce a given virus stock is scrubbed from this report.
From a general standpoint, the presence of impurities like host cell proteins and DNA can impact bioprocess unit operations, including viral clearance and should be minimized in virus spikes. Impurities from virus spikes can clog small scale filters, diminishing their Vmax and utility as representative models of large scale processing. This can also impact measured LRV; Asher et al. (8) found a 1.0 log10 difference across MMV virus preparations (but not MuLV) in a small virus retentive filer model. While TR47 argues that crude virus preparations may be sufficient for evaluating capture columns, evidence from the CDER viral clearance database suggested that high levels of impurities may also impact chromatography. This aggregate data found a trend between viral clearance by protein A chromatography and feedstock complexity (4). The same database suggested that complex feed conditions diminish viral clearance by IEX chromatography operations. Thus, as part of process development and unit operation validation, careful selection of the right virus preparation models for a particular small scale clearance studies is warranted. Use of more purified preparations should be the default choice unless a clear reason to use crude preparations can be articulated.
The actual impurity responsible for the above described spike-related variations in LRV measured in filter studies, is not always known. In theory, it could be host cell DNA, a particular host cell protein or a mixture of many host cell proteins and DNA. An argument can be made that sticky host proteins, by adsorbing on the filter surface, are of primary relevance. For instance, Asher et al. (8) plotted protein and DNA content per PFU; since DNA levels were much less per infectious unit they argued that protein was more likely to have caused adsorption while the DNA was more likely to cake on the filter surface. They went on to suggest that the impact of spike impurities on filter performance may be due to the types of proteins present rather than the sheer amount per se. This may in part explain why preparations containing purified proteins like Albumin do not always cause a filter to fail. Here, although we detected ng levels of host protein (Figure 2), we note that the high levels of overall protein content in the majority of MuLV and PRV preparations assessed likely reflect the practice of adding BSA as a stabilizing agent. As each contract testing organization will have its own preparation storage procedure, variation in the amount of added BSA is expected. At this time, additional studies would be needed in order to definitively address what role, if any, Albumin plays in contributing to variations in LRV.
The same argument that extraneous impurities should be minimized can also be extended to minimization of empty capsids and defective particles. Defective particles in this context are essentially dead-weight that will not contribute to the ability to measure the clearance capacity of a unit operation. Thus, use of virus preparations with a low particle:infectivity ratio should be viewed as a best practice.
In summary, we found variation in preparations from several sources in terms of important quality attributes identified in TR47. These can possibly influence LRVs measured in clearance studies.
Conflict of Interest Declaration
The authors declare there are no competing interests related to this manuscript, financial or otherwise.
Acknowledgements
We thank Dorothy Scott (CBER/FDA) and Tzanko Stantchev (CDER/FDA) for careful review of this manuscript. This work was funded in part by a cooperative research and development agreement (CRADA) between CDER/FDA and Eli Lilly & Co.
Footnotes
-
↵† Present address: Department of Biology, Tufts University, 163 Packard Ave, Medford, MA 02155
-
↵Φ Conclusions in this manuscript are those of the authors and do not necessarily represent official policy of the Food and Drug Administration (FDA). The FDA does not endorse the use of specific sources of products or testing services over others
- © PDA, Inc. 2012


Jump to section
Related Articles
Cited By...
- Use of MMV as a Single Worst-Case Model Virus in Viral Filter Validation Studies
- Viral Clearance Integration (Session IV): General Trends, Bracketing, QbD, Virus Preparation Quality Attributes
- Viral Clearance Using Traditional, Well-Understood Unit Operations (Session I): Virus-Retentive Filtration
- Conference Summary: Gaps, Lessons Learned, and Areas for Improvement