
Abstract
During the past decade, rapid microbiological methods (RMMs) have continued to make inroads into the pharmaceutical and medical device industries. This has led to the development of guidelines for the validation of alternative microbiological methods for both quantitative and qualitative applications. Many studies regarding RMMs have focused on testing performed with planktonic microorganisms. In some applications there is the possibility that microorganisms may also be present as biofilms. When evaluating an RMM, consideration should be given to the potential for biofilm formation within the context of the application and whether microorganisms derived from biofilm would influence the response of the method. This study reflects the evaluation of an RMM with both planktonic microorganisms and microorganisms derived from a mixed culture biofilm.
LAY ABSTRACT: Many new rapid microbiological methods (RMMs) have been developed that have the potential to replace conventional microbiological methods in a wide range of applications including sterility testing, microbial enumeration, environmental monitoring, microbial identification, and other areas. Qualification of these new methods is frequently based on testing performed with planktonic (non-aggregated) microorganisms. However, microorganisms can aggregate together to form biofilms in both natural and manufacturing environments. Purified water systems in particular may be susceptible to the development of biofilms. Because the properties of microorganisms in a biofilm may differ from those in a planktonic state, qualification of an RMM with microorganisms derived from a relevant biofilm model may be appropriate depending on the application and the potential for biofilm formation. This study describes the evaluation of one such RMM, the Chemunex ScanRDI®, with both planktonic microorganisms and microorganisms derived from a mixed culture biofilm model.
1. Introduction
Rapid microbiological methods (RMMs) provide significant benefits over the use of conventional microbiological assays. These include the ability to respond quickly to adverse trends in microbial control, faster release of finished product, greater efficiency in inventory control, reduced warehousing costs, automation, and other benefits (1). While the benefit/cost ratio of each application must be assessed on a case-by-case basis (2, 3), a comprehensive approach to validation is essential to the successful implementation of any RMM. Guidance pertaining to the validation of alternative microbiological methods may be found in PDA TR 33 (4), USP (5), and Ph. Eur. 5.1.6 (6). This study was to assess the potential application of an RMM, the Chemunex ScanRDI, for the determination of the pre-sterilization bioburden of an intraocular lens (IOL) terminally sterilized by moist heat.
To date, many studies regarding the evaluation, qualification, and validation of RRMs have focused on testing performed with planktonic microorganisms (7⇓–9). A topic for further consideration when evaluating and qualifying RMMs is testing performed with microorganisms derived from biofilm. Biofilms consist of predominantly sessile populations of microorganisms embedded within an extracellular polymeric matrix of microbial origin that attach to various surfaces (10). They typically exhibit altered phenotypes and increased resistance to chemical disinfection and other environmental stresses as compared to their planktonic counterparts (10, 11). Biofilms are frequently associated with aqueous environments (12). In particular, purified water (PW) systems are recognized as being at risk for the development of biofilm if they are not properly maintained (12⇓–14). Portions of the biofilm that develops on the surfaces of a PW system may be sloughed off into the water generated by the system (13, 15). This may contaminate product that comes into contact with PW during manufacturing. PW is employed during the production of IOLs to prepare saline solutions that are used to extract and hydrate the lenses and to package the final product. PW is also employed to rinse the glass vials and stoppers that are used to package the product. While appropriate procedures are taken to retard the development of biofilm in PW systems, the potential for biofilm formation cannot be completely eliminated (16). In view of the potential for biofilm formation within PW systems, it was felt that further investigation was necessary of the ability of the ScanRDI system to detect microorganisms derived from biofilm.
Pre-sterilization bioburden limits for a particular product are established based on the product application, the microbial quality of the manufacturing environment, the sterilization process employed, regulatory guidelines, and other factors. For products in sealed containers processed by a terminal moist heat sterilization process with an Fo of 15 min, a pre-sterilization bioburden limit no greater than 1000 cfu has been suggested. This model assumes a worst-case bioburden D121C value of 1.0 min (17). For implantable products such as IOLs, the potential for endotoxin formation should also be considered with regard to the establishment of a pre-sterilization bioburden limit (18). This will be affected not only by the total number of bioburden organisms, but also by the type of microorganisms present in the bioburden and their propensity to form endotoxin.
A potential concern with regard to the application of RMMs with microorganisms derived from biofilms is that the metabolic state and gene expression of microorganisms in a biofilm may differ from that of planktonic microorganisms (19⇓–21). This may affect the response of those RMMs that rely on the detection of the by-products of microbial metabolism (22). For example, the ScanRDI system detects microorganisms based on the ability of endogenous esterase enzymes to cleave a fluorogenic substrate that accumulates within the cell. Studies by Chavez de Paz et al. have demonstrated that the esterase activity of bacteria in biofilms is significantly depressed under conditions of nutrient deprivation in comparison to planktonic cells and requires a greater time to recover when nutrients are restored (23). Others have reported a persistence of esterase activity within biofilms (24, 25). Therefore, it seemed prudent to further evaluate the ability of the ScanRDI system to detect microorganisms derived from biofilm.
In order to evaluate the impact of microorganisms derived from biofilm on the response of an RMM, the selection of an appropriate biofilm model is necessary. Various biofilm models have been published in the scientific literature (26). These models may be broadly categorized on the basis of fluid dynamics as turbulent flow, laminar flow, or static (no flow) models (27). The biofilm model selected should consider both the fluid dynamics of the application and also the nature of the microbial population that may be present on the product and in the manufacturing environment. In many instances the resident microbial population is comprised of mixed genus and species that may fluctuate seasonally. For our study, a static biofilm model (27) was selected based on the work of Florjanic and Kristl (28). The authors reported that the development of biofilm in a PW system was 40 times less likely under constant flow conditions as opposed to stagnant, low flow conditions. This is consistent with the study of Lau and Liu (29) and the statement in USP that turbulent flow appears to either retard the development of biofilm in water distribution systems or reduce the tendency of those biofilms to shed bacteria into the water (30). Therefore, a static biofilm model was employed because this was thought to reflect a greater potential for biofilm formation and release of microorganisms with PW systems as used with the IOL manufacturing process. Static biofilm models have been described in several studies (31⇓–33). These models are simple in design and do not require the use of special apparatus or equipment. The static biofilm model employed in this study consisted of mixed consortiums of Gram-positive and Gram-negative bacteria, spore-forming bacteria, and fungi. This enabled the greatest efficiency in testing the response of the ScanRDI system to a broad range of biofilm-derived microorganisms. The microorganisms employed for testing included standard compendial microorganisms as well as those selected based on a review of environmental monitoring and pre-sterilization bioburden data gathered over a 2 year period from two manufacturing sites. Biofilm formation of the model was characterized by means of epifluorescent microscopy using an acridine orange nuclear stain and SYPRO Ruby to stain the extracellular biofilm matrix. The distribution of each genus of microorganism within the biofilm was characterized as described by Guggenheim et al. (34). Following the completion of studies with planktonic microorganisms, studies were undertaken to evaluate the ability of the ScanRDI to successfully enumerate samples derived from a mixed culture static biofilm model. Biofilm samples were processed according to previously established methods to assess the pre-sterilization bioburden of the product followed by analysis on the ScanRDI and by the reference method. The results of parallel testing performed with the reference method and the ScanRDI were then compared to determine whether the methods were equivalent over a range of dilution.
2. Materials and Methods
2.1. System Description
The AES Chemunex ScanRDI is a viability-based RMM consisting of a scanning laser cytometer that rapidly detects viable microbial cells deposited on a filter membrane. Following uptake of a fluorogenic substrate, the substrate is cleaved by esterase enzymes present within viable cells to form a fluorochrome that accumulates within the cell and fluoresces at 500–530 nm when illuminated by an argon laser at 488 nm. Photomultiplier tubes within the ScanRDI detect the emitted fluorescence and generate an electrical signal that is then processed by a series of software discriminants to enumerate viable microbial cells on the filter membrane and reject non-viable cells and auto-fluorescent particles based on the color ratio, specific fluorescent intensity, and distribution of fluorescent intensities across the detected event. The design and principle of operation of the system have been described in detail elsewhere (9).
2.2. ScanRDI Sample Analysis
Aliquots of the samples were filtered onto a 0.40 μm retention Chemfilter CB04 filter membrane and analyzed on the ScanRDI according to the procedures described in AES Chemunex Doc 200-D0551-02 Scan Bio II protocol. The filtered sample was counterstained for 10 s with the CSE/CSM counterstain solution followed by removal of the counterstain by application of a vacuum of approximately 350–400 mbar. The sample was then prelabeled with Chemsol A16 solution for 3 h at 30–35 °C followed by labeling with ChemChrome V6/ChemSol B16 solution in a ratio of 1:100 for 45 min at 30–35 °C. The filter was then placed on a support pad pre-wetted with 100 μL of Chemsol B16, mounted in a membrane holder, and scanned for fluorescence in the ScanRDI unit. Fluorescent control beads (STD CE beads) were assayed at the beginning and end of each daily session to verify the performance of the ScanRDI unit. Aliquots of the sample were also assayed concurrently by conventional microbiological methods by either serial dilution and direct enumeration (plate count) or filtration on a Nalgene 0.45 μm retention filter membrane followed by plating on the appropriate recovery medium. Bacterial samples were plated on TSA (tryptic soy agar) and incubated at 30–35 °C for a minimum of 3 days and yeast and mold samples were plated on SDA (Sabouraud dextrose agar) and incubated at 20–25 °C for a minimum of 5 days.
2.3. Quantitative Tests
Operational qualification testing including evaluation of the accuracy, linearity, precision, range, and the limit of detection and quantification of the method was performed with planktonic microorganisms according to the methods previously described (35). Unless otherwise indicated, all test organisms were suspended in sterile balanced salts solution (BSS). The potential of the product matrix (BSS) to elicit a false-negative or false-positive response with the ScanRDI system was evaluated. Testing of natural product (pre-sterilization) samples from two different manufacturing facilities was conducted. Testing was also performed of the ability of the method to detect heat-stressed microorganisms in view of the fact that PW systems are frequently heated to retard the growth of microorganisms. Performance qualification (equivalence) testing was performed over the range of the method with both planktonic microorganisms and microorganisms derived from mixed culture biofilms.
2.3.1. Accuracy:
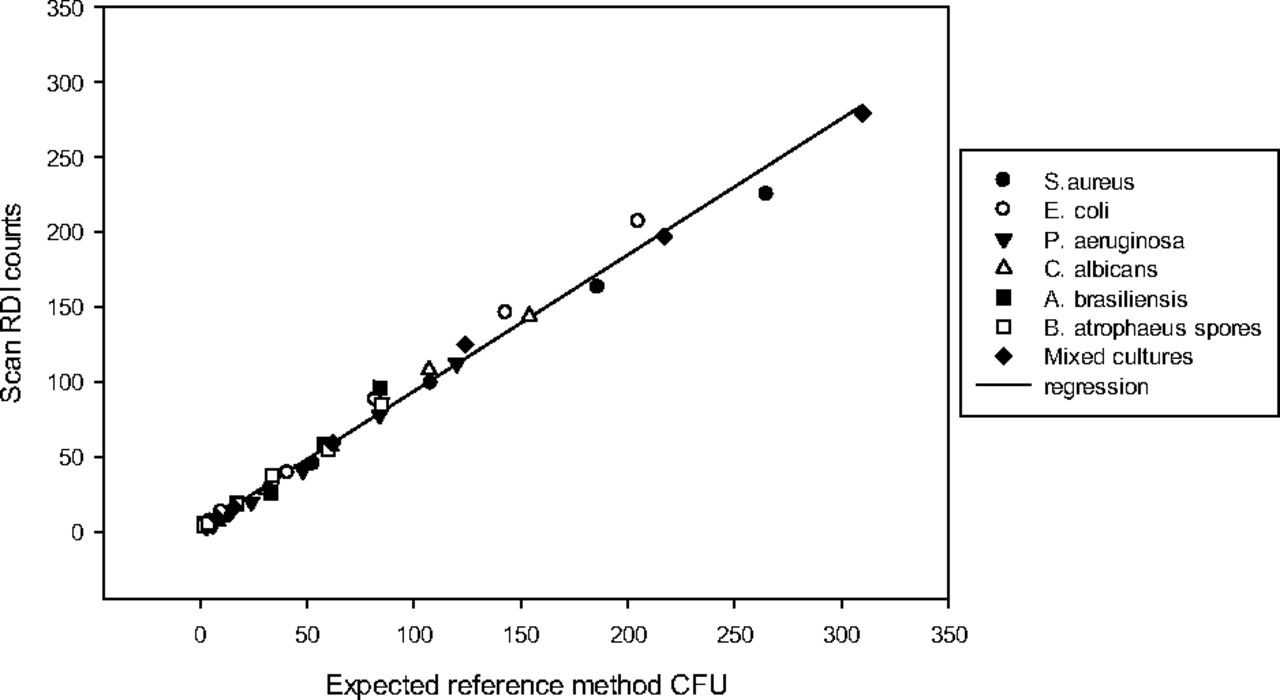
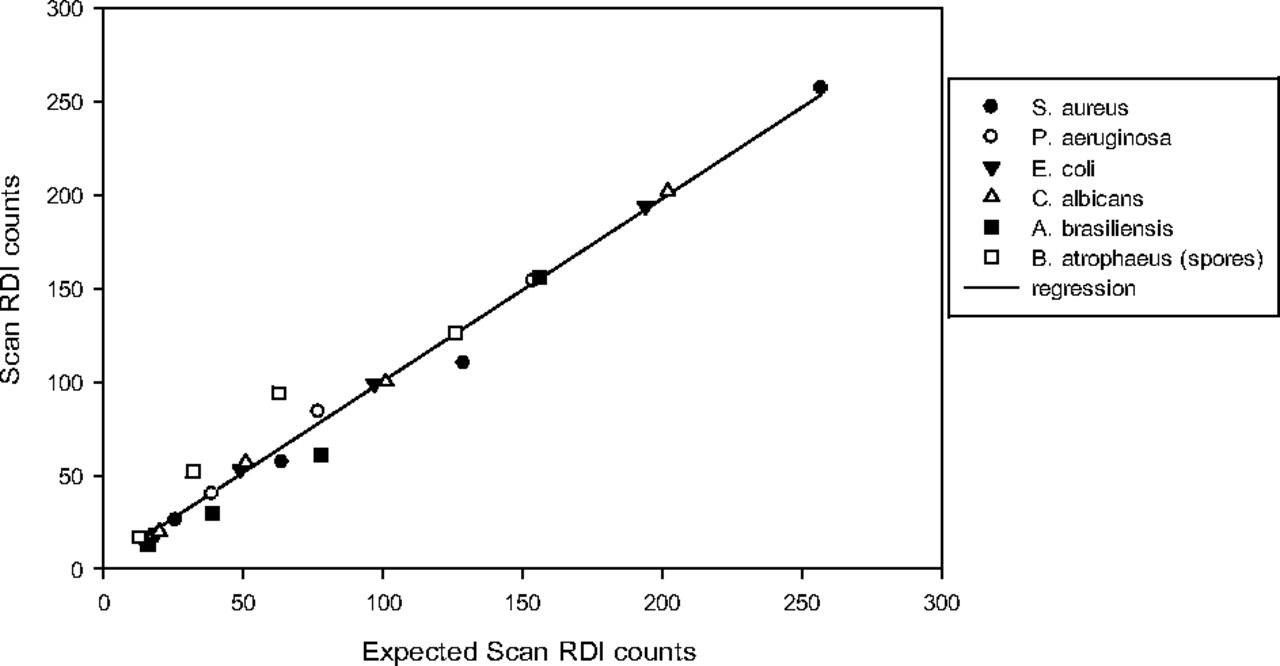
The accuracy of an alternate system reflects the closeness of the test results to that obtained with the reference method. Suspensions of microorganisms were prepared to provide a stock solution of approximately 300 cells/mL. From this stock solution, a series of five further dilutions were prepared to span an approximate range of <10 to 300 cells/mL. The analysis was performed in triplicate on the ScanRDI and with the reference plate count method at the same time. Using the mean cfu results for Dilutions 2 and 3 of the reference plate count method, the numbers of microorganisms present in the stock solution were calculated. Dilutions 2 and 3 were used to calculate the mean cfu, as these are in a linear portion of the plate count enumeration capability. Using the figure calculated, the expected number of microorganisms in each of the six samples was determined by dividing the stock count by the dilution factor. The expected reference plate count method (cfu) was plotted on the x-axis and the actual ScanRDI value was plotted on the y-axis. The line of best fit and the correlation coefficient was then calculated. The mean recovery data is presented in Table I. The results are shown graphically in Figure 1 and summarized in Table II.
Accuracy Percent Recovery ScanRDI Versus Reference Plate Count Method

Accuracy of the ScanRDI versus the reference plate count method. The slope of the linear regression plot of all ScanRDI counts versus the expected reference method cfu = 0.91, r2 = 0.99, and the y-intercept = 2.53.
ScanRDI Accuracy Data for Individual Test Organisms
2.3.2. Linearity:
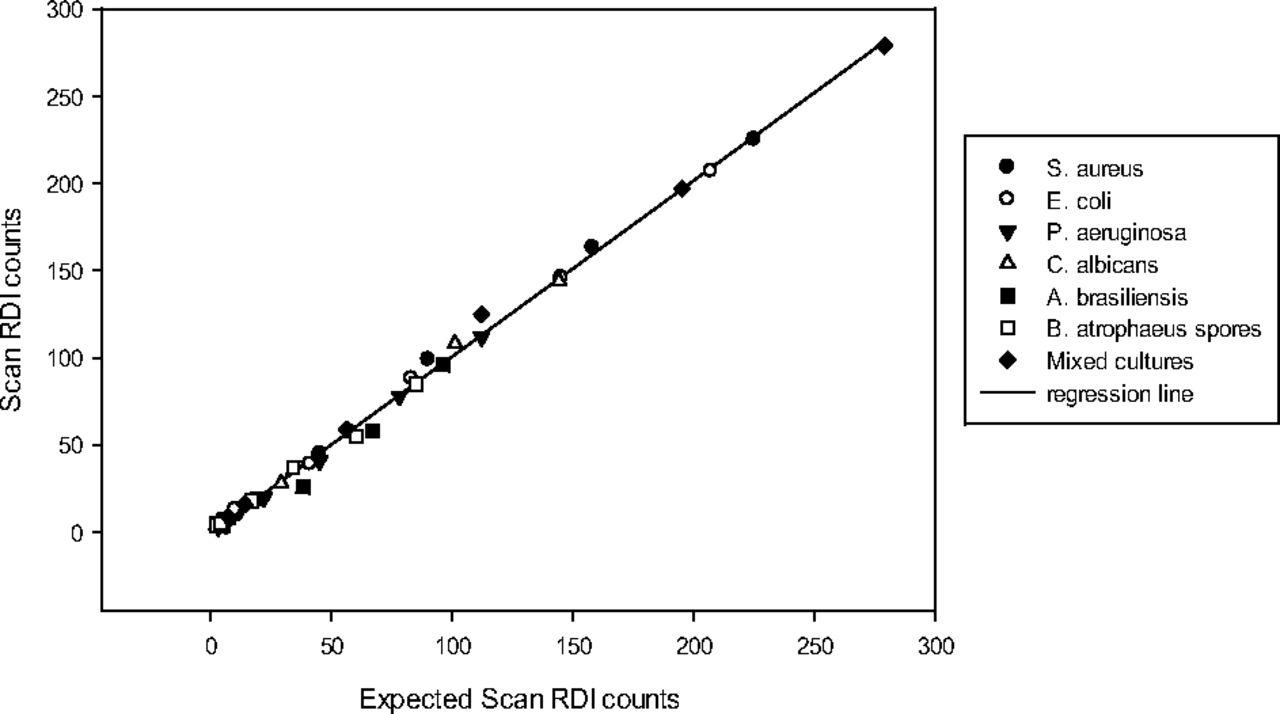
Linearity reflects the ability of the system to generate results that are proportional to the concentration of microorganisms within a given range. The same method and data was used as generated for the accuracy study. The test of linearity is performed as a dilution series from the stock solution of approximately 300 microorganisms/mL. To determine the linearity, the expected result at any given point was calculated from the stock solution count divided by the dilution factor at that point. The expected result was plotted on the x-axis versus the actual count obtained by the method. The data is shown graphically in Figure 2, and as a tabulated summary in Table III.

Linearity of the ScanRDI method. The slope of the linear regression plot of all ScanRDI counts versus the expected ScanRDI counts = 1.00, r2 = 0.99, and the y-intercept = 0.04.
ScanRDI Linearity Data for Individual Test Organisms
2.3.3. Precision:
Precision is the degree of agreement among individual test results when the procedure is applied to multiple samples across the range of the test. Two series of 1:10 dilutions were prepared from a stock solution of approximately 3000 cfu/mL for each test organism. Each dilution series with 10 replicates was analyzed using both the reference plate count method and the ScanRDI test method. For each dilution series, the mean, standard deviation (SD), and the relative standard deviation (coefficient of variation) were calculated (Table IV).
Precision of ScanRDI and Reference Plate Count Method
2.3.4. Range:
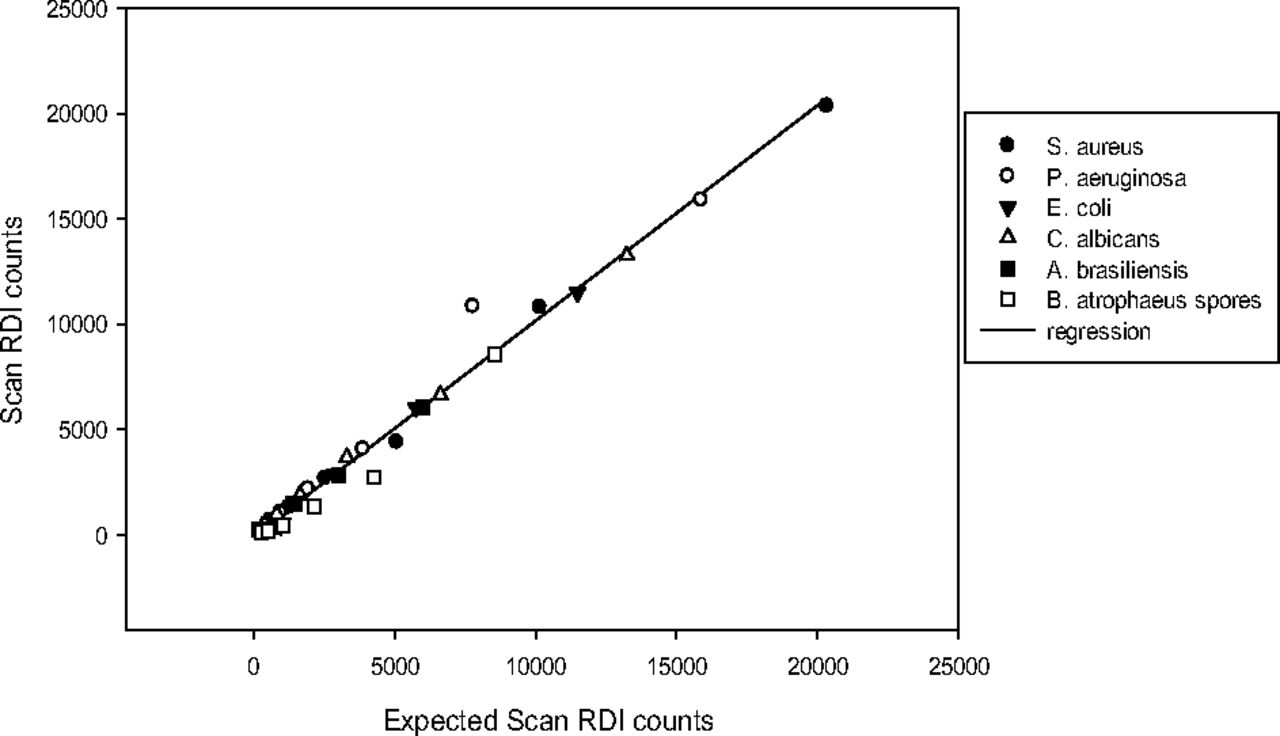
The range of a method is that interval between the upper and lower concentrations of microorganisms that has been determined with precision, accuracy, and linearity. The same method was used as described for the linearity studies except the stock solutions of each microorganism were of a higher concentration (approximately 20,000 cfu/mL). The data was processed as described for the linearity study with the value obtained for the stock solution being used to calculate the values expected following correction for dilution (Figure 3, Table V).

Range of the ScanRDI method. The slope of the linear regression plot of all ScanRDI counts versus the expected ScanRDI counts = 1.02; r2 = 0.98, and the y-intercept = –80.6.
ScanRDI Range Data for Individual Test Organisms
2.3.5. Limit of Detection and Quantification:
The limit of detection is the lowest number of microorganisms that can be detected in a sample, but not necessarily quantified. The limit of quantification reflects the lowest number of microorganisms which can be detected with accuracy and precision. Serial dilutions were prepared from a stock solution containing approximately 200 cfu/mL. The dilution range employed gave <1 cfu/mL at the highest dilution. The dilutions were analyzed with six replicates to provide an indication of the precision of the assay. The method of assessment was the same as described for assay linearity with plotting of the obtained count versus the expected count calculated from the dilution used for the stock solution. The coefficient of variation was also calculated at each dilution to obtain an assessment of the confidence of the result obtained (Figure 4, Table VI, Table VII).

Limit of Detection (LOD) of the ScanRDI method. The slope of the linear regression plot of all ScanRDI counts versus the expected ScanRDI counts = 0.98; r2 = 0.98, and the y-intercept = 2.7.
ScanRDI LOD Data for Individual Test Organisms
Limit of Quantification (LOQ)—Percent Coefficient of Variation (%CV) ScanRDI Counts
2.3.6. Product Matrix:
Testing of the product matrix was performed to determine the potential of the matrix (BSS) and product and packaging components to elicit a false-positive or false-negative response with the ScanRDI system. This testing was performed in two phases. The first phase consisted of testing performed with sterile BSS and sterile PW only (Table VIII). For false-positive testing five replicate 100 mL samples of sterile BSS and five replicate 100 mL samples of sterile PW were assayed on the ScanRDI and by the reference method as described in section 2.2. For false-negative testing (ScanRDI only), the procedure was repeated adding 100 μL of standard C3 fluorescent beads to each vial. The second phase of testing consisted of testing performed with three sets of five each nonsterile product components (vial, cap, gasket, lens holder, and lens) obtained from two manufacturing locations (15 samples per location) assembled into their final product configuration at the testing laboratory and filled with sterile BSS (Table IX). Each set of samples was pooled and processed as described in section 2.2 for analysis on the ScanRDI and by the reference method (TSA only). The total number of counts recovered on the ScanRDI was then compared with the total number of counts recovered by the reference plate count method. For false-negative evaluation (ScanRDI only), the same procedure was followed with the exception that 100 μL of standard C3 fluorescent beads were added to the sample prior to analysis on the ScanRDI. A second set of samples was prepared in the same manner substituting sterile PW for sterile BSS. The samples were then processed as described in section 2.2 for analysis on the ScanRDI. The number of counts recovered with BSS was then compared versus the number of counts recovered with PW.
Product Matrix Testing—Diluent
Product Matrix Testing—Assembled Components
2.3.7. Natural Product Testing:
Testing was performed with five sets of five samples each of natural product (final assembly) pre-sterilization bioburden samples received from two manufacturing facilities (Table X). Samples were taken from different lots immediately prior to sterilization, packaged with refrigerant packs, and forwarded to the testing laboratory via overnight delivery. Each set of five samples were pooled for analysis according to the method described in section 2.4.
Natural Product Testing
2.3.8. Equivalence:
The equivalence of two different methods is a measure of the similarity of the test results obtained with both methods. For the determination of the equivalence of the ScanRDI to the reference method, aliquots of test organisms representative of those found in the manufacturing environment and product bioburden (Table XI) were diluted in vials containing either 200 mL of BSS (approximately 100–500 cfu/vial) or 200 mL 1.5:1 BSS: Fluid D to yield approximate concentrations of 1–50 cfu/vial, 100–500 cfu/vial, and 1000–5000 cfu/vial. One hundred milliliters of each suspension were then assayed via either the ScanRDI or the reference method, and the percent recovery ScanRDI/reference method was determined (Table XII). Additionally, a 100–500 cfu/vial aliquot of each test organism suspended in 1.5:1 BSS: Fluid D was subjected to a heat shock at 65–70 °C for 30 min, a treatment performed to allow for the detection of any spore forms that may be present in the sample.
Typical Microorganisms Isolated from Pre-Sterilization Bioburden Samples and the Manufacturing Environment
Equivalence Data Planktonic Microorganisms
2.3.9. Ruggedness and Robustness:
The ruggedness of a procedure refers to its ability to remain unperturbed by environmental and operational variables (4, 5). The robustness of a procedure is an indication of its reliability when minor variations occur in method parameters (4⇓–6). The ruggedness and robustness of the ScanRDI system has been previously discussed by the manufacturer (36). As no changes were made to the critical operational parameters of the method, it was not necessary to perform additional ruggedness and robustness testing as part of this evaluation.
2.4. Pre-Sterilization Bioburden Analysis
Samples were suspended in a total volume of approximately 100 mL sterile BSS unless otherwise indicated followed by 10 min ultrasonication in a Branson model 5200 40 kHz ultrasonic bath and 20 min mechanical agitation on a VWR model S-500 orbital shaker at 200 rpm. The resulting suspension was then diluted serially in BSS for analysis on the ScanRDI (section 2.2) and by the reference method (total aerobic count on TSA).
2.5. Mixed Culture Biofilm Model
For the preparation of mixed culture biofilms, a 70 mm Whatman #2 cellulose filter paper circle was added to the surface of a pre-poured 100 × 15 mm TSA plate. The filter paper was inoculated with 1.0 mL of BSS containing 105–106 cfu/mL of each of the desired test organisms. To realize a relatively homogenous biofilm population, Gram-positive microorganisms were inoculated approximately 24 h in advance of Gram-negative and fungal microorganisms. This was done to reduce the potential growth suppression of Gram-positive microorganisms by Gram-negative microorganisms (34). A pre-cleaned, 25.4 × 76.2 mm plain glass microscope slide (Corning # 2947) was then added to the surface of the filter paper to provide a substrate for growth of the biofilm. The agar plate was then incubated for 3 days at 30–35 °C with humidification. To encourage the development of biofilm formation during incubation, 1.0 mL of fresh tryptic soy broth was added to the filter paper on a daily basis except for the final day of incubation (37). Following incubation, the slide was removed from the agar plate and rinsed with 10 mL of sterile water to remove loosely adherent cells. The slide was then either stained for analysis via fluorescent microscopy as described in section 2.6 or the biofilm harvested with a sterile scalpel into sterile BSS and processed as described in section 2.4 for analysis on the ScanRDI and enumeration by the reference method (total aerobic count on TSA).
2.6. Mixed Culture Biofilm Visualization
To visualize the formation of biofilm following rinsing to remove loosely adherent cells, the glass slide of section 2.5 was flooded with either 0.1% acridine orange DNA stain (Becton Dickinson catalog # 212536) in 0.5 M acetate buffer for 2 min or a ready-to-use 1× concentration SYPRO Ruby biofilm matrix stain (Invitrogen # F10318) for 30 min and protected from light. Excess stain was then removed by gentle rinsing of the slide with 5–10 mL 0.22 μm filtered PW, and the biofilm was visualized at 100× magnification using an Olympus BX51 fluorescence microscope equipped with a Lumenera Infinity 3 digital camera. Samples stained with acridine orange were viewed with excitation at 450 nm and emission at 610 nm while samples stained with SYPRO Ruby were viewed with excitation at 502 nm and emission at 525 nm.
2.7. Biofilm Processing and Presumptive Characterization
As noted by Costerton et al., biofilm contains aggregates of thousands of bacterial cells that may produce only a single colony when plated unless the biofilm is first disrupted (12). Biofilm removed from the glass slide in section 2.5 were processed in the same manner as that routinely employed for pre-sterilization bioburden analysis of finished product as described in section 2.4. The biofilm was then characterized by triplicate plating on MacConkey agar for the selection of Gram-negative organisms, mannitol salt agar for the selection of Gram-positive organisms, and YM agar for the selection of yeast and mold. The plates were incubated at 30–35 °C for 48–72 h, after which they were counted and the respective distribution of Gram-negative and Gram-positive bacteria and fungi determined. For the selection of Bacillus pumilus, samples were plated on Rambach agar modified according to the method of Watts et al. to allow the growth of Gram-positive bacteria positive for the production of β-galactosidase (38).
2.8. Test Organisms
2.8.1. Operational Qualification Testing:
For operational qualification testing standard compendial test organisms were selected along with spores of Bacillus atrophaeus.
Staphylococcus aureus ATCC 6538
Pseudomonas aeruginosa ATCC 9027
Escherichia coli ATCC 8739
Candida albicans ATCC 10231
Aspergillus brasiliensis ATCC 16404
Bacillus atrophaeus spores NRRL B4418
2.8.2. Performance Qualification (Equivalence) Testing:
2.8.2.1. Planktonic Microorganisms:
For performance qualification testing, environmental monitoring and pre-sterilization bioburden data gathered over a 2 year period from both manufacturing sites was reviewed. Testing was performed with the ATCC equivalent of those microorganisms that were isolated with the greatest frequency from the manufacturing environment and pre-sterilization product bioburden (Table XI).
Staphylococcus hominis ATCC 27844
Micrococcus luteus ATCC 10054
Kocuria kristinae ATCC 27570
Pseudomonas aurantiaca ATCC 33663
Ralstonia insidiosa ATCC 49129
Alcaligenes faecalis ATCC 15246
Saccharomyces cerevisiae ATCC 4098
Bacillus pumilus (spores) ATCC 27142
Staphylococcus cohnii ATCC 13509
Vibrio tubiashii ATCC 19105
Staphylococcus lugdunensis ATCC 49576
Sphingomonas sp. ATCC 31461
2.8.2.2. Mixed Culture Biofilms:
Testing with mixed culture biofilms was performed with standard compendial test organisms (Consortium #1) and the ATCC equivalent of microorganisms isolated from the product bioburden and manufacturing environment as described in section 2.8.2.1 (Consortiums #2 and #3). Test organisms were selected to provide biofilm consortiums consisting of Gram-positive and Gram-negative bacteria and yeast (Consortiums #1 and #3), and Gram-positive and Gram-negative bacteria and spore-forming bacteria (Consortium #2). Biofilm consortiums were constructed in this manner to allow for the greatest diversity in microbiological composition within the smallest sample size. A minimum of three replicates were tested with each consortium.
Biofilm Consortium #1—Staphylococcus aureus ATCC 6538, Escherichia coli ATCC 8739, and Candida albicans ATCC 10231.
Biofilm Consortium #2—Staphylococcus hominis ATCC 27844, Pseudomonas aurantiaca ATCC 33663, and Bacillus pumilus (spores) ATCC 27142.
Biofilm Consortium #3—Staphylococcus lugdunensis ATCC 49576, Ralstonia insidiosa ATCC 49129, and Saccharomyces cerevisiae ATCC 4098.
2.9. Balanced Salts Solution
Unless otherwise indicated, all testing was performed with the test organisms suspended in a sterile BSS employed to package the final product. The BSS consisted of a solution of 0.48 mg/mL calcium chloride × 2H20, 0.30 mg/mL magnesium chloride × 6 H20, 3.90 mg/mL sodium acetate × 3 H20, 1.70 mg/mL sodium citrate × 2 H20, 6.40 mg/mL sodium chloride, and 0.75 mg/mL potassium chloride in water for injection.
3. Results and Discussion
3.1. Quantitative Tests—Planktonic Microorganisms
The results of quantitative testing compared favorably with previously reported studies of validation of the ScanRDI for the routine microbiological analysis of process water (35). In addition to testing performed with individual cultures of microorganisms, testing for accuracy, linearity, and precision was also performed with mixed cultures of Staphylococcus aureus ATCC 6538, Escherichia coli ATCC 8739, and Candida albicans ATCC 10231.
3.1.1. Accuracy and Linearity:
The results of accuracy (Table I, Figure 1, and Table II) and linearity (Figure 2, Table III) testing are consistent with the requirements noted in PDA TR33 (4), USP (5), and Ph. Eur. 5.1.6 (6) of a minimum recovery of 70% of the reference method. The slope of the regression line for all microorganisms tested was greater than 0.8 (corresponding to greater than 80% overall recovery of each test organism) with a square of the correlation coefficient (r2) > 0.9, while the slope of the regression line for linearity was between 0.8 and 1.2 with a square of the correlation coefficient (r2) >0.95 (USP, PDA TR33). The data (Table I) reveals one sample (A. brasiliensis dilution 2.5) where the recovery (61.9%) was less than 70%. This may be due to difficulties in counting associated with the reference method in view of the potential of cultures of A. brasiliensis to form satellite colonies when plated, which may lead to an overestimation of the number of microorganisms present (39). This premise is supported by the recovery of greater counts (42 cfu) at the 2.5 dilution in comparison to the preceding sample in the dilution series (1.428 dilution—34 cfu). Based on the data within the countable range of the reference method of 25–250 cfu per plate for bacteria and Candida albicans and 8–80 cfu per plate for Aspergillus brasiliensis (40), it can be stated that the ScanRDI provided an estimate of the number of viable microorganisms not less than 70% of the estimate provided by the reference method with a frequency ≥95%.
3.1.2. Precision:
The precision of the method (Table IV) over a population range of approximately 30–1000 cfu was found to be consistent with the requirement for a coefficient of variation (%CV) of 15 - 30% as noted by PDA TR33 (4) and 15–35% as noted in USP (5). Ph. Eur. 5.1.3 notes that a coefficient of variation of 10–15% is acceptable. Based on the data in Table IV, the Ph. Eur. 5.1.6 requirement for precision would be met over a range of approximately 100–1000 cfu with exception of cultures of P. aeruginosa ATCC 9027. During testing it was found that any delay between testing of cultures of P. aeruginosa ATCC 9027 on the ScanRDI and by the reference method could result in a loss of accuracy (see comment in Table V). This could presumably affect the precision of the method as well. The difficulty in attaining the Ph. Eur. 5.1.6 requirement for precision at lower counts has been commented on by Sutton (41).
3.1.3. Range:
The range of the method was found to be accurate and linear up to 104 cells/filter membrane (Figure 3, Table V). For the purposes of this study the upper limit of the range would be defined by the data for precision (section 3.1.2) where good precision was noted up to approximately 1000 cfu.
3.1.4. Limit of Detection and Quantification:
Analysis of the limit of detection of the method (Figure 4, Table VI) demonstrated acceptable linearity with a slope of 0.98 and a square of the correlation coefficient (r2) of 0.98 and a y-intercept of 2.7 for a best-fit plot for all organisms tested. This would suggest a limit of detection of <3 cfu under the conditions tested. The manufacturer notes that the ScanRDI has a detection sensitivity of one cell (36). While the ScanRDI data is comprised of individual counts of discrete cells retained on the filter membrane, factors such as cell clumping and sample autofluorescence complicate the determination of the actual limit of detection. Testing performed by Smith et al. using the most probable number method found that the limit of detection of the ScanRDI was an order of magnitude lower than the reference sterility test method (42).
For the limit of quantification, it can be seen in Table VII that the lowest dilution for which the %CV is <30% is 7 cfu for cells of Escherichia coli as compared to 52 cfu for spores of Bacillus atrophaeus. Averaging the lowest cell counts across the organisms tested for which the %CV is <30% yields 22 cfu, which agrees well with the data for precision. The true limit of quantification for the method under the conditions tested is probably between 20–30 cfu, which is comparable to the lower end of the stated range of 25–250 cfu for the reference plate count method (40).
3.1.5. Product Matrix:
Testing performed with sterile BSS and PW indicates that these diluents possess some level of background autofluorescence as evidenced by ScanRDI counts (Table VIII). For testing performed with assembled components, the average counts recovered with the ScanRDI (41 counts) were greater than the reference method (6 cfu) but did not exceed the average cfu/sample obtained by the reference method by more than a pre-established limit of 100 counts (Table IX). A limit of 100 counts was selected, as this was viewed as an acceptable degree of risk for rejecting otherwise good product in view of the low levels of pre-sterilization bioburden present in the product (Table X). This is consistent with the statement in PDA TR33 section 3.3.1 which notes that new acceptance criteria may need to be established as viability based methods may give higher recoveries than the reference method (4). The higher recovery noted with the ScanRDI is believed to be due to the detection of auto-fluorescent events associated with either the sample matrix (Table VIII), the product components (Table IX), or the test environment that were not excluded by the software discriminants of the system. For false-negative evaluation the counts obtained with BSS were not less than 70% of those obtained with sterile PW, averaging 104% for diluent only (Table VIII) and 103% for diluent and components (Table IX). Neither the product matrix or product components appear to depress the response of the ScanRDI system.
3.1.6. Natural Product Testing:
For testing performed with 11 lots of pre-sterilization natural product, the mean recovery of the ScanRDI was greater than that of the reference method for all samples tested (Table X). The results are similar to those obtained with product matrix testing of assembled components (Table IX).
3.1.7. Equivalence:
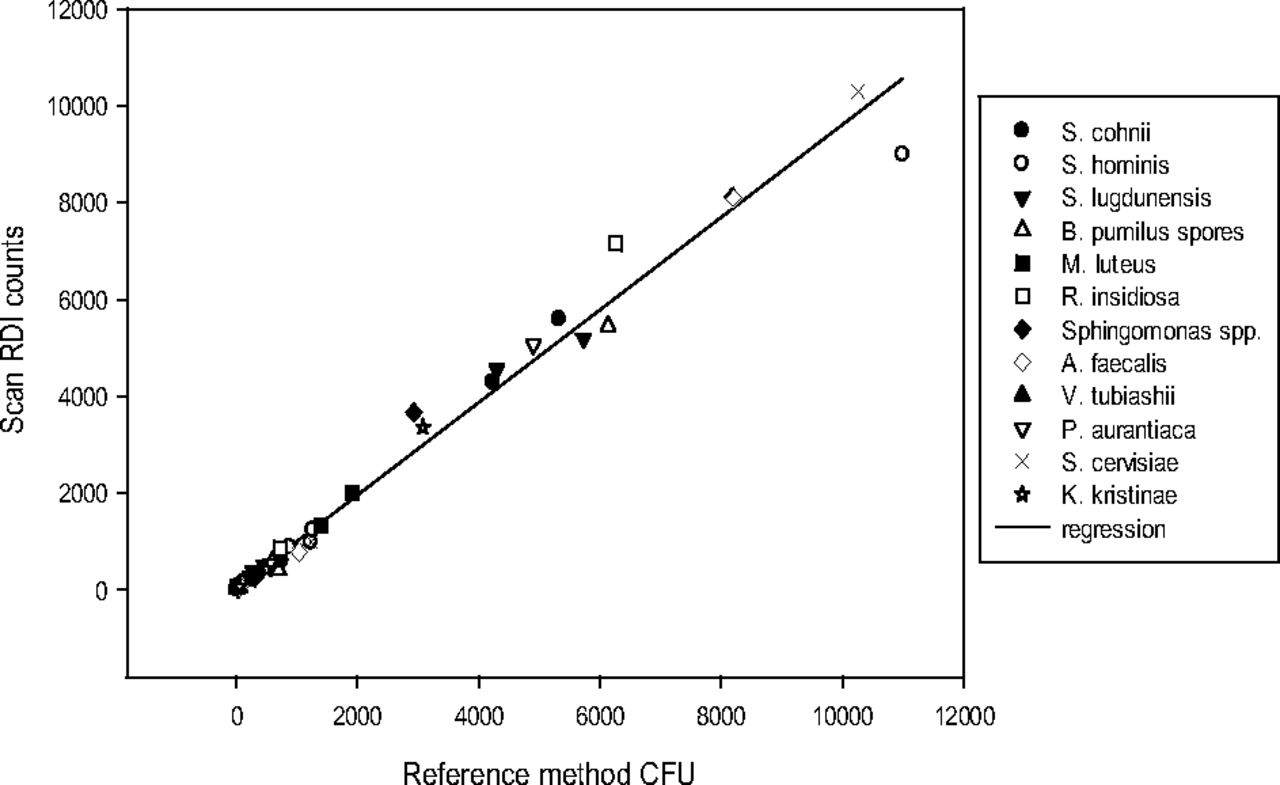
The overall mean recovery for all dilutions tested on the ScanRDI was 109 ± 22% of the reference method (Table XII). This compares favorably with the statement noted in PDA TR33 (4) and Ph. Eur. 5.1.6 (6) that if an alternative method is meant to replace a conventional method it must provide an estimate of viable microorganisms not less than 70% of the current method. Of the 71 dilutions tested, a total of three dilutions with three test organisms (S. cohnii ATCC 13509 100–500 cfu/vial, spores of B. pumilus ATCC 27142 1000–5000 cfu/vial, and V. tubiashii ATCC 19105 100–500 cfu/vial heat-shocked) were observed where the recovery on the ScanRDI was less than 70% of the reference method. With V. tubiashii ATCC 19105, inconsistent recoveries were obtained across all dilutions tested, reflecting difficulties encountered in propagating this organism (a halophile) on the standard TSA medium employed for pre-sterilization bioburden testing. When testing with S. cohnii ATCC 13509 and spores of B. pumilus ATCC 27142 was repeated, recoveries were greater than 70%, suggesting that the initial low recovery was likely due to errors in processing. Nevertheless, this data cannot be discounted and was included in the calculation of recovery efficiency. Including the three dilutions where the recovery was less than 70%, it can be stated that under the conditions tested the ScanRDI produced results equivalent to or greater than the reference method with a frequency >95% (Figure 5). There was no significant difference (P = 0.05) between the recovery of samples suspended in either 200 mL of BSS or 1.5:1 BSS: Fluid D.

Equivalence of the ScanRDI and the reference plate count method—planktonic microorganisms. The slope of the linear regression plot of all ScanRDI counts versus the reference method cfu = 0.96, r2 = 0.98, and the y-intercept = 41.0.
3.1.8. Stressed Organisms:
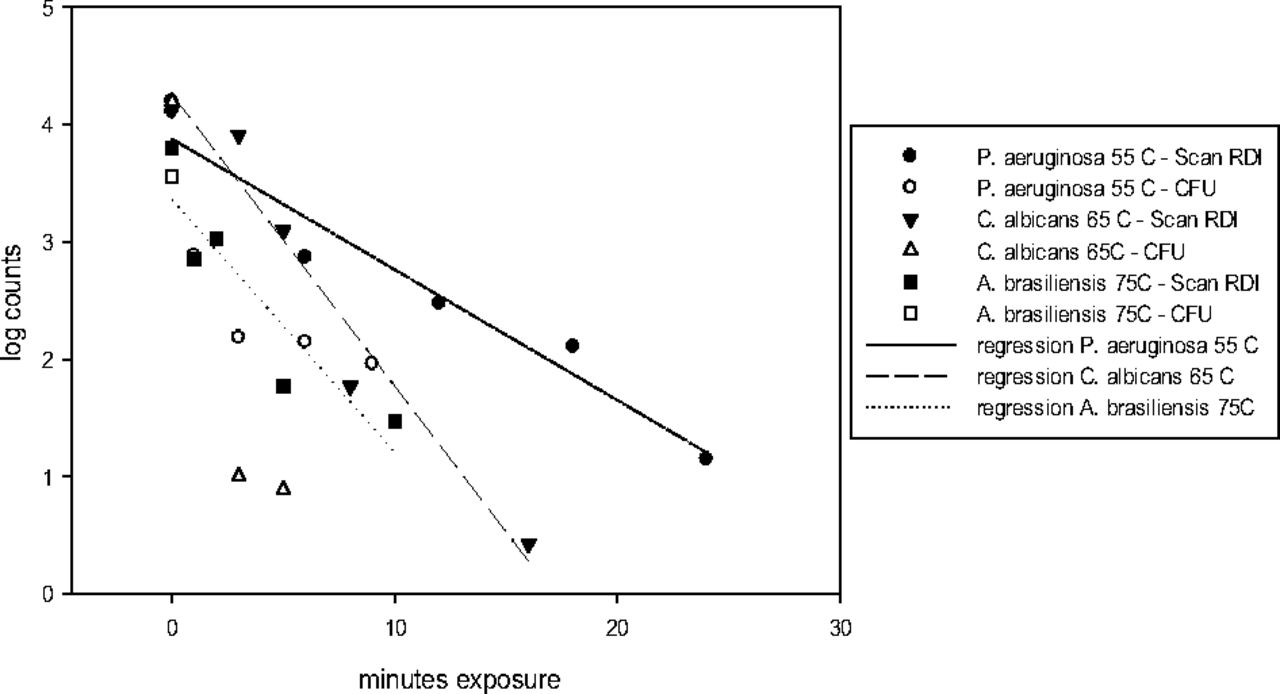
As PW is routinely heated to 65–80 °C to control microbial proliferation, testing was performed with cultures of Pseudomonas aeruginosa ATCC 9027, Aspergillus brasiliensis ATCC 16404, and Candida albicans ATCC 10231 suspended in BSS subjected to heating for varying times to evaluate the ability of the method to detect heat-stressed organisms. In all cases recovery with the ScanRDI was greater than recovery with the reference method (Figure 6). While a linear response (r2 > 0.8) was noted for plots of log ScanRDI counts versus exposure time for all three test organisms, the plots of the reference method data (log cfu counts) versus exposure time exhibited squares of the coefficients of correlation < 0.8. This is likely due to the persistence of esterase activity when heated under conditions that lead to the rapid inactivation of the test organism, making it difficult to measure esterase activity and cell viability concurrently under the conditions tested. A similar persistence of esterase activity as compared to viable counts has been reported for nonspore-forming bacteria stored in municipal water at 5–8 °C and 25 °C for up to 30 days (43).

Recovery of heat-stressed microorganisms ScanRDI versus reference plate count method. Linear regression plots of ScanRDI data only (see text). For Pseudomonas aeruginosa ATCC 9027 processed at 55 °C r2 = 0.98, for Candida albicans ATCC 10231 processed at 65 °C r2 = 0.95, and for Aspergillus brasiliensis ATCC 16404 processed at 75 °C r2 = 0.83.
3.2. Biofilm Characterization
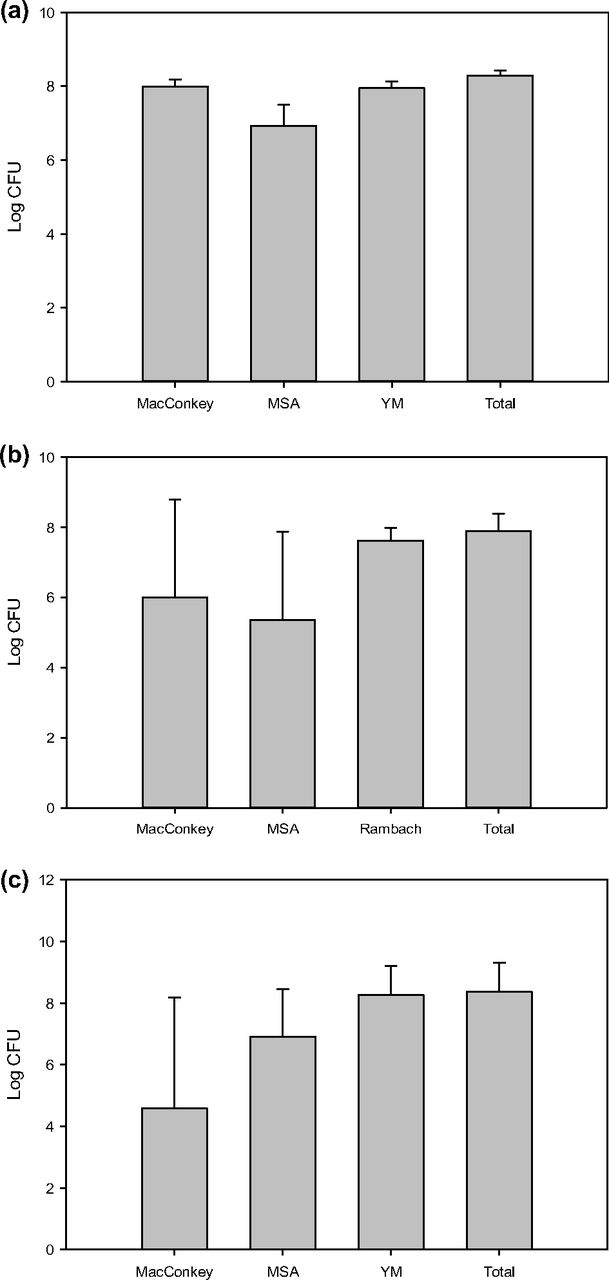
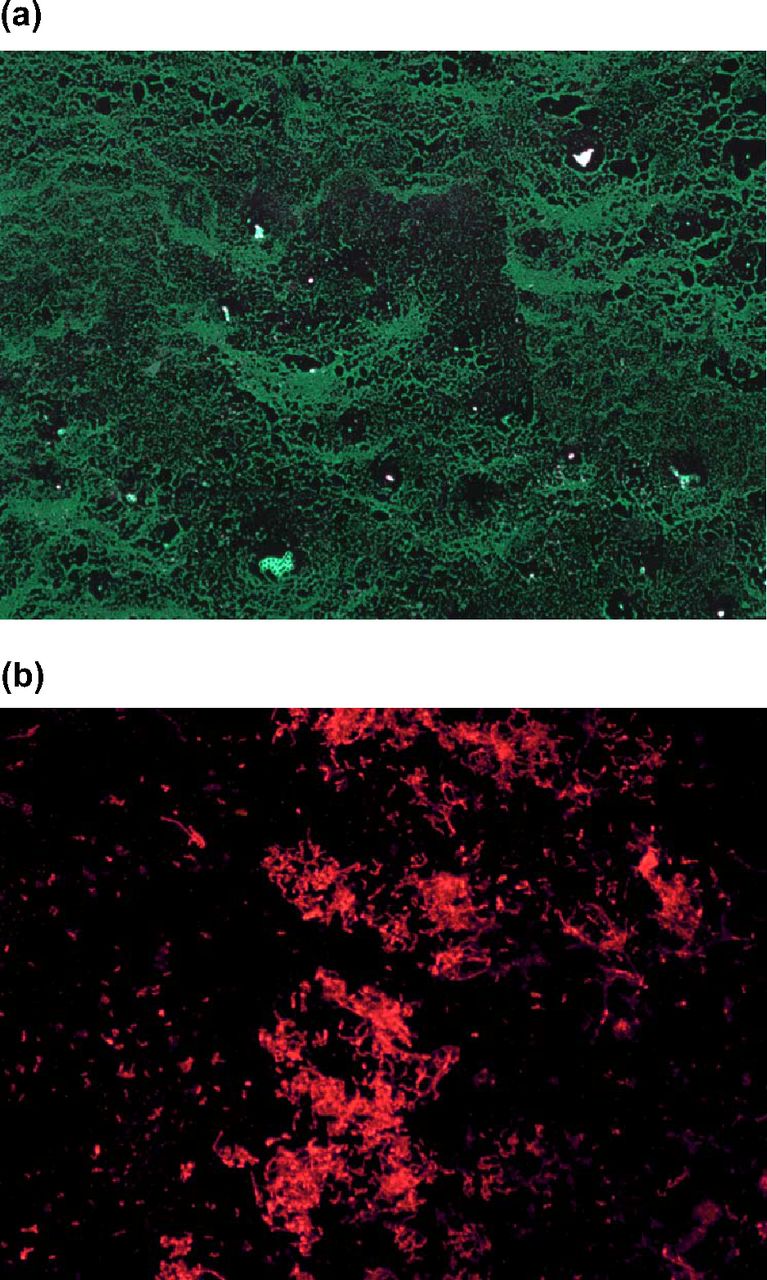
For the three biofilm consortiums tested, the mean log10 biofilm population was 8.06 ± 0.68 and the range was 7.43–9.57. The distribution of individual test organisms within biofilm Consortium #1 (Figure 7a) exhibited less variability than Consortiums #2 and #3 (Figures 7b and 7c, respectively). In early testing there were occasional failures to recover either Gram-negative (Biofilm Consortiums 2 and 3) or Gram-positive (Biofilm Consortium 2) microorganisms within the biofilm. This underscores the need to perform testing with multiple biofilm replicates and to carefully stagger the inoculation of test organism when working with mixed culture biofilms (34). Fluorescent staining of mixed culture biofilms revealed a confluent layer of microorganisms when stained with acridine orange (Figure 8a) and evidence of an extracellular protein matrix when stained with SYPRO Ruby (Figure 8b).

Relative contribution of each microbial species to mixed culture biofilms based on plating on selective media. (a) Consortium #1 consisting of Staphylococcus aureus ATCC 6538, Candida albicans ATCC 10231, and Escherichia coli ATCC 8739. (b) Consortium #2 consisting of Staphylococcus hominis ATCC 27844, Pseudomonas aurantiaca ATCC 33663, and spores of Bacillus pumilus ATCC 27142. (c) Consortium #3 consisting of Staphylococcus lugdunensis ATCC 49576, Ralstonia insidiosa ATCC 49129, and Saccharomyces cerevisiae ATCC 4098. MSA = Mannitol salt agar. YM = yeast mold agar.

Mixed culture biofilms stained with (a) acridine orange nuclear stain and (b) SYPRO Ruby biofilm matrix stain. 100× magnification.
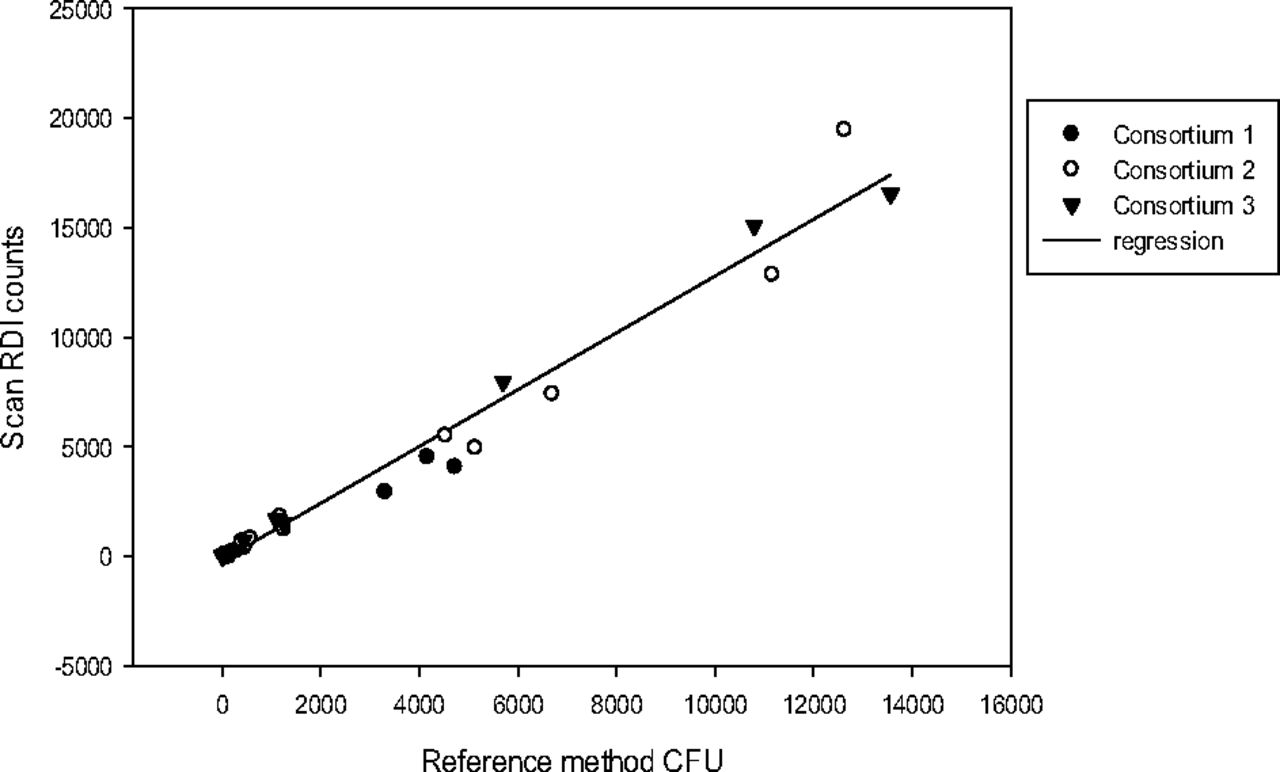
3.3. Equivalence Testing—Biofilm
Samples derived from mixed culture static biofilm consortiums exhibited an overall recovery of 116 ± 26% of the reference method (Table XIII, Figure 9). The lowest recovery noted was 78% for the lowest dilution (63 cfu) of the third replicate of Consortium #1 (Table XIII). These results are comparable to those obtained with planktonic microorganisms (Table XII, Figure 5), although the slope of the biofilm regression line is slightly greater than that obtained with planktonic organisms, suggesting a tendency for the method to overestimate the true biofilm population. This may be a consequence of failure of the method to discriminate against all autofluorescent material, the methods ability to detect viable but non-culturable microorganisms, or a combination of these factors.
Equivalence Data Biofilm Consortiums

Equivalence of ScanRDI and reference plate count method—biofilm consortiums as described in Figure 7 with 3 or 5 day incubation. The slope of the linear regression plot of all ScanRDI counts versus the reference method cfu = 1.3, r2 = 0.97, and the y-intercept = –172.
4. Conclusions
Previous studies have evaluated the use of the ScanRDI across a range of applications including monitoring pharmaceutical water systems (44), the detection of contamination in mammalian cell cultures (45), the measurement of airborne bacteria and fungi (46), and the sterility testing of pharmaceutical products (42). This study was to evaluate the use of the ScanRDI for the determination of the pre-sterilization bioburden of an IOL terminally sterilized by moist heat. In conjunction with testing performed with planktonic organisms, testing was also performed with heat-stressed microorganisms and microorganisms derived from mixed culture static biofilms. The outcome of testing indicates that ScanRDI provides an accurate indication of the pre-sterilization bioburden of the product with both planktonic microorganisms and microorganisms derived from a mixed culture static biofilm model. The ability of the ScanRDI method to detect a range of microorganisms (specificity) has been previously documented (36). This study expands on earlier work by demonstrating the ability of the ScanRDI to detect microorganisms derived from a mixed biofilm community. Testing performed with heat-stressed microorganisms supports a higher level of recovery with the ScanRDI as compared to the reference plate count method. This is consistent with reports of the ability of the ScanRDI to recover viable but non-culturable organisms (47, 48).
The ability of the ScanRDI to successfully enumerate microorganisms from a PW system with known biofilm issues has been commented on previously, although the nature of the biofilm was not characterized (44). The current study supports the earlier observation regarding the ability of the ScanRDI system to successfully enumerate microorganisms derived from biofilms by means of testing with a mixed culture static biofilm model. While a number of novel approaches for the rapid analysis of biofilm populations have been previously reported (49⇓–51), the potential impact of microorganisms derived from biofilms on the response of viability and growth-based RMMs has not been extensively discussed. In view of the prevalence of biofilms in natural environments and the potential formation of biofilm in manufacturing environments under certain conditions, testing with microorganisms derived from biofilm may merit further consideration when evaluating an RMM. Users should assess their application to determine whether biofilm formation would be of concern and whether further testing with biofilm derived microorganisms would be appropriate.
Conflict of Interest Declaration
The authors declare that they have no competing interests.
Acknowledgements
The authors gratefully acknowledge the assistance of Sophie Valery of AES Chemunex with the analysis of natural product samples taken from the manufacturing facility in France.
- © PDA, Inc. 2013


