
Abstract
Biological products can contain residual DNA from host cell substrates. It is therefore possible that such residual DNA could encode or harbor oncogenes and infectious agents, and transmit to product recipients, leading to possible oncogenic or infective events. The World Health Organization and U.S. Food and Drug Administration guidelines recommend that 10 ng/dose and 200 base pairs be the limits of content and size of residual DNA in the final product dose. This paper discusses establishment of acceptable limits of residual DNA using a risk-based approach that may differ from the current regulatory specifications. Methods currently in use for DNA safety assessment are also reviewed and compared.
LAY ABSTRACT: Medicines produced from biological sources like cells can contain DNA. It is not clear what health risk the DNA can pose in the product recipients, but often manufacturing can be designed to minimize the risk by reducing the levels of DNA. This article describes new methods for calculating the health risks.
Introduction
Development of cell-based biological products has been at the forefront of drug research and development. Utilizing sophisticated technology, biological products can be created and manipulated to treat various conditions that defy conventional, small molecule–based approaches. However, because biologics are produced from living cells, it is inevitable that residual cell DNA is present in the final products. As mammalian cells are known to carry latent proviruses as well as potentially oncogenic DNA sequences, there is a remote possibility for the residual DNA to transmit an activated oncogene or potentially an infectious viral DNA to product recipients, particularly if the biological product is manufactured in a cell line that has known tumorigenic potential (1). In the literature, the potential risks of residual DNA have been much researched by various investigators (2⇓–4). More recently, Sheng et al. (5) performed a study to test the ability of two cellular oncogenes, H-ras and c-myc, to initiate tumor induction. They found that sarcomas were formed in two different mouse strains (NIH Swiss, C57BL/6) that were co-injected with 12.5 μg each of two plasmids, containing either activated human H-ras or c-myc. In a related study, Peden et al. (6) assessed the risk associated with infectious agents in residual DNA, using human immunodeficiency virus type-1 (HIV-1) as the transfection agent in two separate cell lines. They found that residual DNA from HIV-infected cells was infectious at 2 μg. Taken together, these studies confirm the oncogenicity and infectivity of residual DNA, and they underscore the needs of both developing science and risk-based methods for safety assessment and setting regulatory limits for residual DNA.
Regulatory Specifications
The debate over risk and acceptable limits of residual DNA dated back to the late 1970s. It began with production of interferon in Namalwa human lymphoblastoid cell line and spilled over to hybridomas and Chinese hamster ovary cells in the early 1980s (4). In 1984, a group of scientists convened to discuss the issue and concluded that 10 pg/dose was an acceptable limit of DNA (7). However, the limit was, at best, an educated guess based on limited data and knowledge including the accepted level of 10 pg DNA per dose of a marketed polio vaccine produced in VERO cells. It was not until 1986 that more scientifically relevant data became available. Upon evaluation of the data, a group of experts commissioned by the World Health Organization (WHO) reached a consensus that residual DNA at 100 pg/dose or less had negligible risk, defined as a 1 in 1010 chance of inducing a tumor assuming that the cell substrate contained one copy of an activated oncogene per cell, for products administered parenterally. As a consequence, 100 pg/dose was established as the acceptable DNA limit (8).
In 2006, a WHO Study Group on Cell Substrate was formed to revisit WHO requirements in light of significant progresses made in the development of vaccines in novel continuous cell lines (CCLs) including MDCK and Hela cell lines, as well as studies conducted at the U.S. Food and Drug Administration (FDA) Center for Biologics Evaluation and Research (CBER). While CCLs, often referred to as immortal cell lines, are capable of an unlimited number of population doublings, the mechanism by which most CCLs become immortal is generally unknown. In addition, some CCLs are known to be tumorigenic. Therefore there was an increasing need to consider safety issues related to these new CCLs and develop appropriate recommendations. Such efforts led to the modification of DNA limits from 100 pg/dose to 10 ng/dose (9), and this level has been widely adopted by regulatory agencies. The study group also agreed that decreasing the size of residual DNA to below 200 bp further mitigated the risks of oncogenicity and infectivity at the 10 ng per dose limit. In the most recent publication of FDA guidance (10), it is stated, “The risks of oncogenicity and infectivity of your cell-substrate DNA can be lessened by decreasing its biological activity. This can be accomplished by decreasing the amount of residual DNA and reducing the size of the DNA (e.g., by DNAse treatment or other methods) to below the size of a functional gene (based on current evidence, approximately 200 base pairs). …” Approximate 200 bp is currently viewed as the regulatory limit for DNA size.
Interestingly, neither WHO nor FDA guideline requires manufacturers to conform to these limits; rather, as suggested in a WHO guideline (9), “a risk assessment should be done in order to define the DNA upper limit for a particular vaccine or biological product, based on the following parameters: nature of the cell substrate, inactivation process, the method used to assess DNA content, and the size distribution of DNA fragments.” Furthermore, the FDA also encourages manufacturers to discuss risk assessment and acceptable limits of residual DNA with the agency should an alternative approach or limits be used (10).
Methods of Risk Assessment
As discussed, DNA risk assessment is required by WHO and FDA guidelines. It is also a critical component of overall risk-reduction strategies that a manufacturer should adopt to ensure consistent manufacturing of safe products. Key to accurate risk evaluation is the establishment of relationship between safety margin (SM) and DNA content and size, based on an understanding of the manufacturing process, properties of cell substrate, mechanism of action of enzymatic DNA inactivation treatment, analytical methods used to detect DNA fragments and quantify size and content, and historical knowledge from the literature and targeted investigations concerning oncogenic and infective potentials of particular types of oncogenes and viral DNA. This risk-based methodology is consistent with the new FDA initiative, Pharmaceutical Current Good Manufacturing Practices (cGMPs) for the Twenty-first Century (11), intended to enhance and modernize pharmaceutical manufacturing and product quality. These practices are also consistent with the quality by design (QbD) principles in ICH Q8 (12), which enable manufacturers to develop a production process that reliably and reproducibly produces high-quality drug products without extensive regulatory oversight. Accordingly, the WHO and FDA guidelines were updated for DNA safety assessment in 2007 and 2010, respectively. In the following sections we review and discuss the two methods developed by CBER researchers and propose an alternative approach that addresses some limitations of the former (13).
Current Approaches
In the CBER's studies, risk of oncogenicity (infectivity) associated with residual DNA is quantified as a SM that is defined as the number of doses needed to induce an oncogenic (infective) event in product recipients. An approach was developed to calculate the SMs by Peden, Sheng, and Lewis (6). Assuming that each host cell genome contains I different oncogenes of size mi, and Ii copies of the oncogene i, i = 1 … I, the total number of oncogenes I0 and the average oncogene size m are
The SM of oncogenicity is calculated by
 where Om is the amount of oncogene sequences required for inducing an oncogenic event, M the genome size or total number of DNA base pairs in one copy of the host cell, respectively, and E[U] is the average amount of residual DNA per dose of the product. The expression
 in eq 2 represents the genomic mass equivalent of oncogenes in a dose. A similar formula is used for calculating SM of infectivity. However, the method does not take into account the effect of DNA fractionation, as the denominator in the right hand side of eq 2 includes both fractionated and unfractionated oncogenes. As a result, the risk estimate based on this method is likely to be overstated. To correct this issue, another method was suggested by two CBER researchers, Krause and Lewis (14). In their methodology the SM is calculated by
 where P is the percent of DNA with size greater than or equal to that of an oncogene. The formulas, establishing simple relationships between oncogenicity and infectivity SMs and parameters of interest, are both intuitive and easy to use. The quantities used in SM calculations can be either experimentally determined or extracted from the literature. We hereafter refer to these two methods as the PSL and KL methods.
An Alternative Method
Recently, a new method for DNA safety assessment was developed by Yang, Zhang, and Galinski (13), based on a mechanistic modeling of the relationship between the risk and characteristics of the purification process including DNA inactivation, and biological nature of the host cells such as the numbers and sizes of oncogenes and infectious viral DNA, amounts of oncogenes, and infectious agents required to cause oncogenic and infectious events. Key to the development of their method was to use Bernoulli and geometric distributions to describe the DNA inactivation process, and the size of the DNA fragment. Let p denote the probability that the enzyme cuts phosphate ester bond between two adjacent nucleotides. Under the same assumptions used for SM calculations by the PSL and KL methods, the SM of oncogenicity is derived as

By modeling residual DNA size as a random variable following a geometric distribution, Yang et al. showed (13) that the median size of DNA Med0 after DNA inactivation steps of the production process and p satisfy:

Combining eqs 5 and 6, we have
 where the denominator is the total amount of unfractionated oncogenes. Note that the safety factor is a decreasing factor of both the content E[U] and median size Med0 of residual DNA; the smaller E[U] and/or Med0 is, the larger is the SM. A similar formula is also derived for SM concerning infectivity:
 where Qm, J0, and ni are viral genome amount required to induce an infection, total number of viral genes contained in a host cell, and their sizes ni, respectively, N is the diploid size of the host cell genome, and the denominator is the amount of unfractionated viral genomes. We refer this approach as YZG method.
Comparison of the PSL, KL, and YZG Methods
In this section, we show that the PSL is essentially the same as the YZG method when there are no DNA reduction steps in the manufacturing process, and that the KL method is identical to the YZG method when the host cell contains only one oncogene (infective viral genome). Furthermore, we demonstrate that under the assumption that there are DNA inactivation steps involved in the manufacturing process, the PSL method underestimates SMs. However, when compared to YZG approach, the KL method may either underestimate or overestimate the SM pending on the sizes of the oncogenes (viral genome) relative to the median size of residual DNA. As the mathematical formulations for calculations of DNA oncogenic and infective risks are the same, the derivations of the above results are only done for the SM of oncogenicity.
PSL vs YZG Methods
When there is no treatment to degrade DNA, the probability p for the phosphate ester bond between two adjacent to be cut is equal to zero. Substitute p = 0 into eq 5, we obtain,
 where I0, the total number of oncogenes, and m, the average oncogene size, are defined in eq 1. This indicates the PSL is a special case of YZG under the premise that there is no DNA fractionation treatment. When this assumption does not hold, that is, p > 0, it is obvious that
 because of mi > 1, as there is no gene of the size fewer than two base pairs. As a consequence, the SM calculated from the PSL method is strictly smaller than that determined from YZG. In other words, the PSL underestimates the SMs, and thus overstates the risk of oncogenicity.
KL vs. YZG Methods
As described previously, the size of residual DNA was modeled through a geometric distribution by Yang et al. (13). Let X denote the size of DNA. Then
The percent P of DNA with size greater than or equal to the oncogene size m, in eq 4, can be calculated as

Combining eqs 6 and 12, 
When there is only one oncogene on the host cell, I =1, I1 = I0 and m1 = m. By eq 7 and eq 10, SM2 and SM3 are the same. This implies KL is a special case of YZG.
Under the assumption that the host cell contains two or more oncogenes, the SMs calculated from the KL and YZG methods have the following properties:
Define

Note the second order derivative of f(x) is
 which satisfies
In other words, the f(x) is concave and convex over the intervals [0, (2/ln 2)Med0] and ((2/ln 2)Med0, ∞), respectively. We define

The quantity f̄ is the average of function f evaluated at x = mi, i = 1 … I, and j = 1 … Ii. Note that by eq 1 the average DNA size 
Because
 with Om > 0, combining eqs 17 and 18, inequalities in eq 14 hold.
In summary, we have shown that the PSL and KL methods are special cases of YZG, under the assumptions of no DNA inactivation steps utilized in the process and one oncogene (infective agent) in hose cell genome, respectively. When the assumptions fail to be true, PSL underestimates the SMs while KL may either overestimate or underestimate the risk when compared to the YZG method.
An Example
We compared the SMs calculated from the three methods in an example situation. The amount of oncogene required to induce cancer Qm was extrapolated from Sheng et al. (5), where they demonstrate that a combined amount of 25 μg of two 12.5 μg plasmids, each containing an activated oncogene (activated human H-ras and c-myc) caused tumors in mice. It should be noted that there are approximately 200 oncogenes identified in various species (8). Using the SOURCE (located at http://smd.standford.edu) 81 expressed human oncogenes are found in 24 different tissues (8). The average size of human oncogenes is 1925 bp with a standard deviation of 87 bp. Assuming the H-ras and c-myc have a size of 1925 bp, that represents 37.7% of the plasmids (3186 bp) that harbored the oncogenes. Hence, the total oncogene contribution is 9.4 μg (25 × 37.7% = Om). We estimate the SM of oncogenicity for two scenarios: (1) with three copies of one oncogene of size 2000 per cell; (2) with three different oncogenes per host cell (I0 = 3) of size 1000, 2000, and 3000 bp. It is assumed that the residual DNA is reduced to a median size of 200 bp (Med0 = 200) due to enzymatic treatment, the genome size of host cell is M = 5 × 10⁹, and the total amount of residual DNA in a dose of product was no more than 10 ng. In this scenario the SMs based on the three methods were estimated, using eqs 2, 4, and 11, and presented in Table I. As shown in Table I, KL and YZG give rise to the same estimate of SM when there was only one oncogene per cell. However, the PSL method underestimates the SM by more than 1000 fold. In the second case where there were three different oncogenes per cell, each having one copy, the estimates by PSL and KL remain unchanged while the YZG method yielded an estimated SM of 1.41 × 10¹¹. Hence the PSL underestimated the SM by 60 fold while and KL overestimated it by 17 fold.
Estimates of Safety Margins of Oncogenicity
Risk-Based Specifications
The mechanistic modeling approach proposed by Yang et al. (13) established relationship between the risks and characteristics of the purification process such as enzyme cutting efficiency, total amount of residual DNA in the final dose, and biological nature of the host cells including numbers and sizes of oncogenes and infectious viral DNA, amounts of oncogenes and infectious agent required to cause oncogenic and infectious events, respectively. As discussed above, the method is more general than those developed by researchers at CBER, and addresses some of the issues related to the latter. Furthermore, the aforementioned functional relationships can be used to establish specifications for the content and residual DNA that potentially offer more flexibility in controlling risks of oncogenicity and infectivity.
Per the WHO and FDA guidelines (9, 10), the oncogenic and infective risks of a biological product are deemed acceptable if the content of residual DNA is below 10 ng/dose and the median size is approximately 200 bp. In the following, we explore combinations of content and median size (E[U], Med0) such that they provide greater SMs than those achieved at (10 ng/dose, 200 bp). Such combinations can be obtained by solving the following inequalities:


The left and right hand sides of inequalities (eqs 19 and 20) are the SMs of oncogenicity and infectivity evaluated at (E[U], Med0) and (10 ng/dose, 200 bp), respectively. The two inequalities can be rewritten as


Take, as an example, that we assume that there's one oncogene of size 2000 bp and one viral gene of size of 3569, the size of the smallest viral genome MS2, in the host cell. That is I0 = J0 =1, m1 = 2000, and n1 = 3569 in inequalities (eq 19). The two inequalities can be simplified as

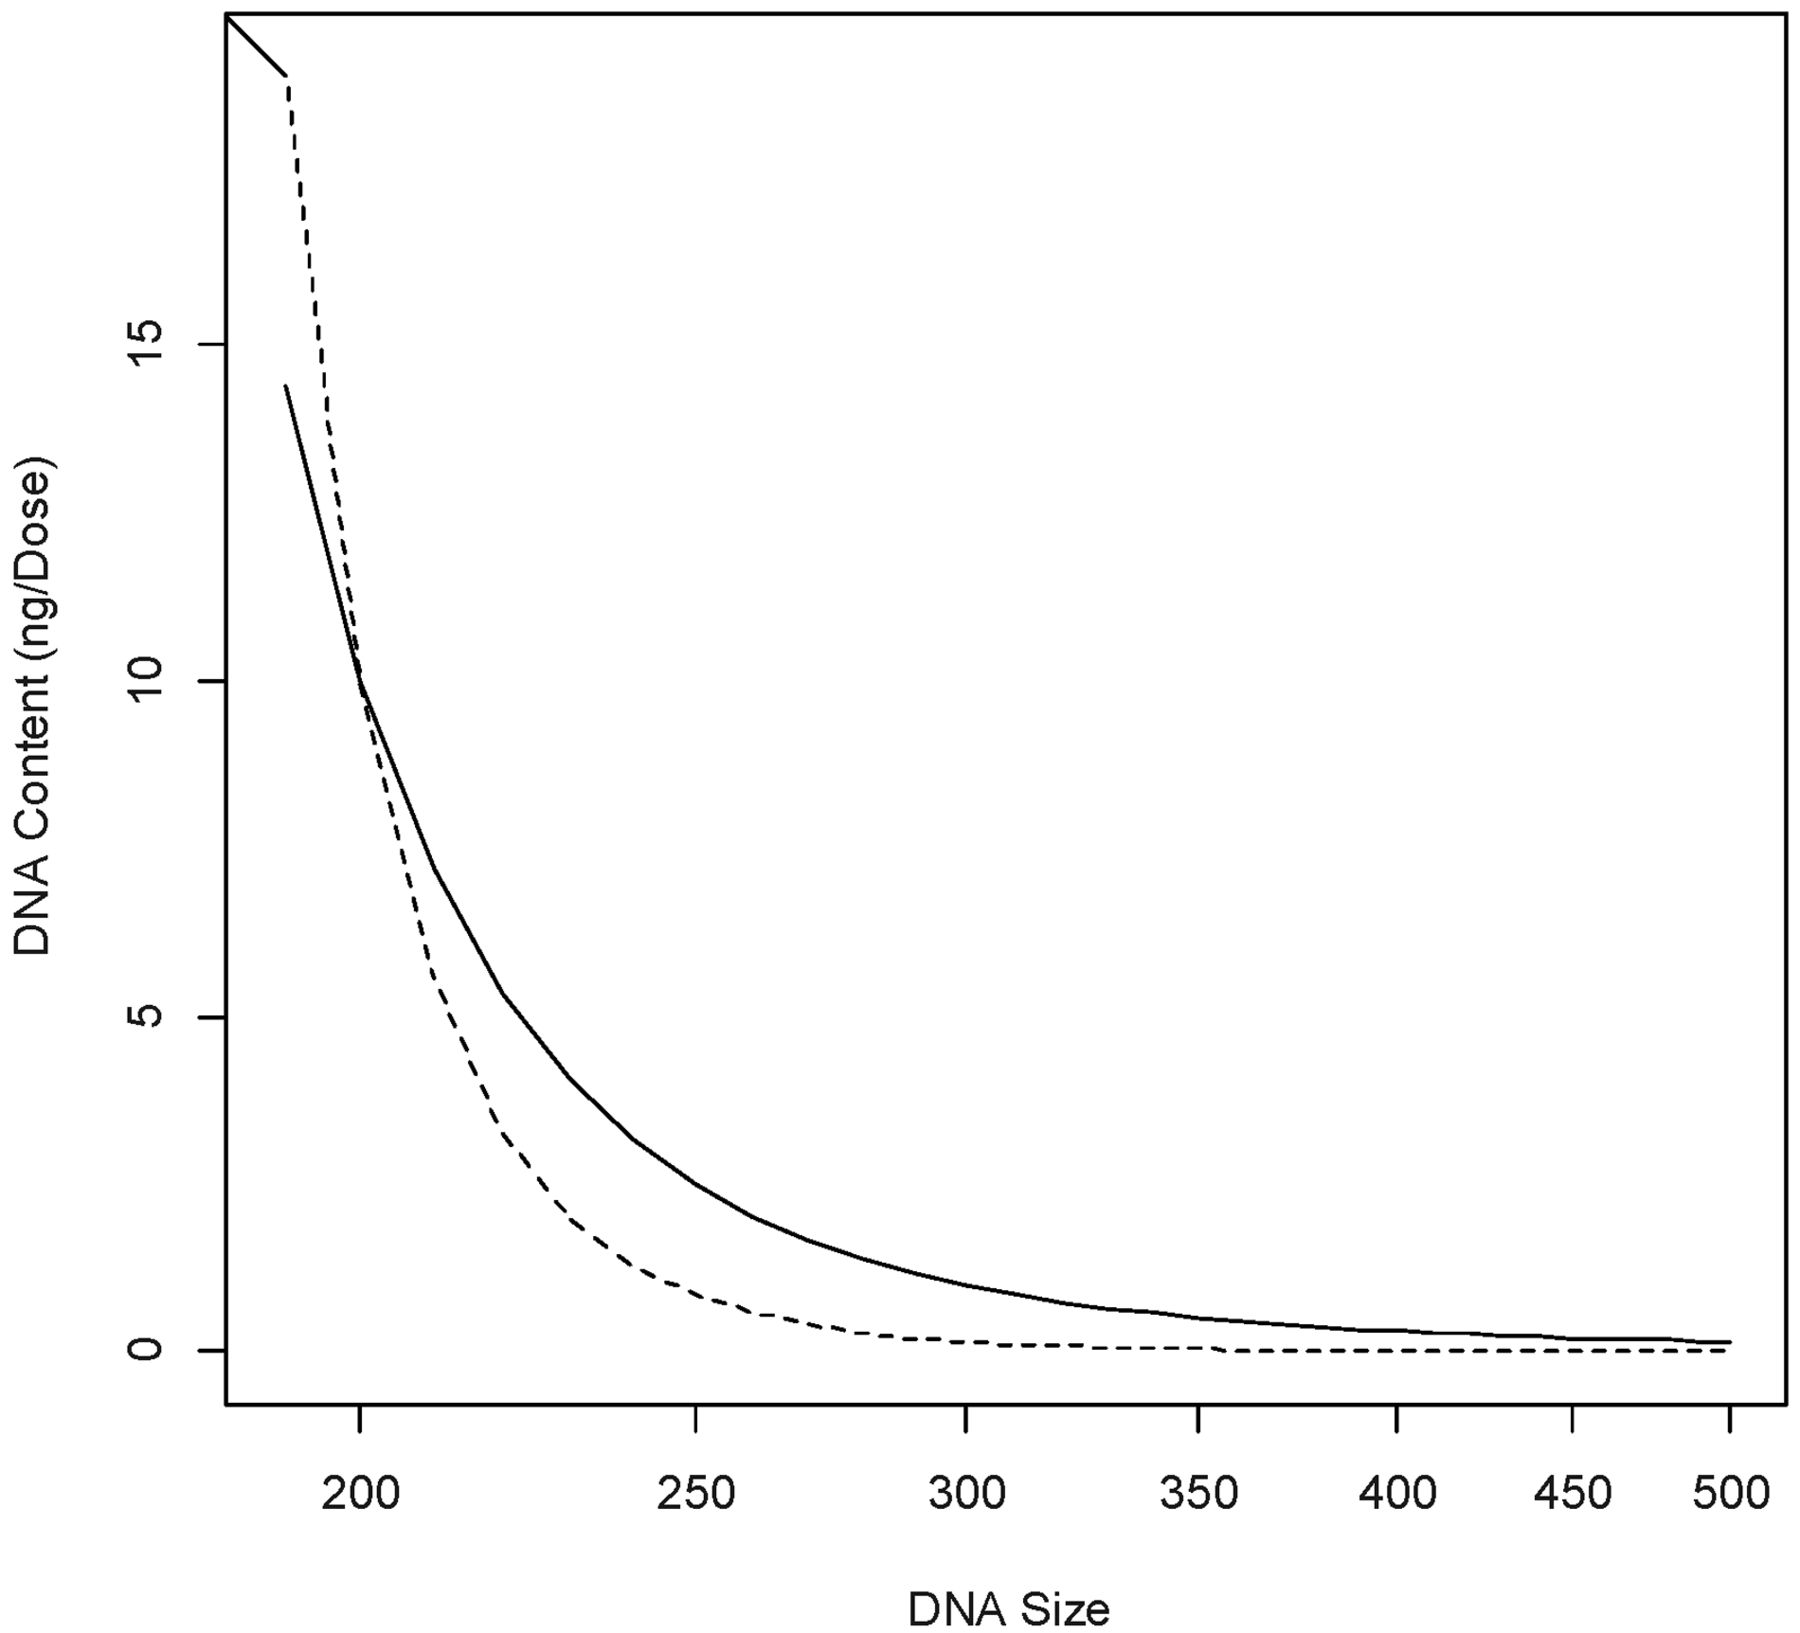
The contents and sizes of residual DNA (E[U], Med0) that satisfy eq 22 consist of the region below the two curves in Figure 1, where the solid line is equation

Combinations of DNA content and size under the solid and dotted curves give rise to SMs greater than those at content = 10 ng/dose and median size = 200 bp.
Defining relative safety margin (RSM) as the ratio of SM evaluated at (E[U], Med0) and that estimated at (10 ng/dose, 200 bp), RSM was calculated for several combinations of (E[U], Med0) in the region below the two curves shown in Figure 1. A RSM value greater than or equal to 1 is indicative a combination of (E[U], Med0) that provides more safety assurance than the regulatory limits (10 ng/dose, 200 bp). The results, summarized in Table II, indicate that oncogenic and infective risks of DNA can be mitigated through reduction of both DNA size and content, at the levels different from the regulatory specifications. For example, if the DNA degradation steps are effective, resulting in a median size of 120 bp, the limit of DNA content can be loosened to 1000 ng/dose. On the other hand, if the purification process can reduce the content of DNA in the final product to 0.01 ng/dose, the median DNA size can be as large as 450 bp yet still gives rise to acceptable SMs.
Combinations of Content and Median Size of Residual DNA Meeting Regulatory Safety Requirements
In 2005, the FDA Vaccines and Related Biological Products Advisory Committee considered an oncogenic SM greater than or equal to 107 as acceptable (16). The acceptable region of (E[U], Med0) can be alternatively explored by solving the inequalities

Discussion and Conclusions
The increasing use of novel continuous cell lines has driven innovation in the development and manufacturing of new biological products over the past decade. Despite purification steps during the manufacturing process, fragments of residual DNA are likely present in the final product. Therefore, the oncogenic and infective risks of the cell substrates need to be carefully assessed to ensure safety of the product under development. In recent years, both WHO and FDA guidelines have been updated for the purpose of setting new standards for cell line characterization and risk assessment in light of enhanced technology, deeper understanding of various cell substrates either in use or under development, and scientifically more relevant data. Although the regulatory guidelines recommend limits of 10 ng/dose and 200 base pair size of residual DNA in the final product, manufacturers are advised to conduct risk assessment specifically tailored to the cell substrate and product to be developed. The guidelines also stress the importance of applying risk-based methods to conduct the safety evaluations. Different limits of DNA content and size may be acceptable to the regulatory agencies if they are supported by scientific evidences and robust risk assessment. This paper describes the evolution of setting regulatory limits for residual DNA, highlights risk-based nature of current guidelines, pinpoints the inconsistencies in the current methodologies and introduces an alternative that is shown to be more accurate and can be effectively utilized in DNA risk assessment. The acceptable limits based on the new method may potentially lend manufacturers more flexibility in improving and controlling their process while maintaining an acceptable level of quality assurance.
It is worth noting that the need for the aforesaid flexible limits is product/process-dependent. For vaccines that are usually minimally processed and which can contain high levels of cell substrate DNA in the final product, it is highly likely that a DNA inactivation step is necessary. On the other hand, monoclonal antibodies and many other biological products regulated by the CDER within the FDA are often processed over multiple column steps that remove several logs of DNA, often several orders of magnitude below the WHO limit. For those products, the need for flexible DNA limits diminishes, so does DNA inactivation/degradation. For example, we suppose that there are two processes, Process A and Process B, both manufacturing the same biological product. The former degrades DNA to a median size of 450 bp and there is approximately 1 ng residual DNA per final dose, and the latter, more efficient in DNA content reduction, gives to rise to an amount of residual DNA of 0.05 ng per final dose. Let SFA and SFB denote the safety factors of the two processes. It is also assumed that there is only one oncogene of size 1925 bp contained in the host cell genome. By eqs 5 and 7, it can be shown that the ratio SFA/SFB is equal to (1/2−1924/450)/(1/0.05) = 0.968. This implies that Process B, which does not include a DNA inactivation step but is more efficient in DNA removal, has a slightly better safety profile.
Because model validation is an integral part of a probabilistic method development to ensure that a method is fit for its intended use, ideally the accuracy and reliability of the mathematical model we develop should be validated by comparing its estimated values with observed events. However, before a biological product is approved for marketing and distributing, there are only a limited number of doses of the product administered in human subjects during clinical development. Because the risks of oncogenicity and infectivity due to residual DNA are in general low, it would take many doses to observe some events. As a result, a short-term validation of the model based on empirical data is not very feasible. However, the validity of our approach is partially supported by the fact that the two methods, which were developed by the CBER researchers, and which have often been used by manufacturers for DNA risk assessment, are special cases of our models.
Lastly, there are both random and nonrandom factors in the bioreactor and purification processes such as anion exchange columns that may affect estimation of model parameters, specifically, median DNA size and amount of residual DNA in the final dose. To account for the random variations, multiple samples can be tested, to give rise to a set of estimates of both median DNA size and content, which allows for estimation of error associated with each of the two parameters. Using a standard technique called Taylor expansion, the variability of the safety factor estimate can be obtained. The estimated variability allows for construction of a 95% confidence interval of the safety factor, and the lower and upper limits of the interval represent the most conservative and liberal estimates of the safety factor, respectively.
Acknowledgements
The author would like to thank the two referees for their invaluable comments and instructive suggestions, which helped greatly to improve the article. The author would also like to thank Dr. Laura Richman, Dr. Nancy Kavanaugh, and Dr. Norman Greenberg for taking pains to review the manuscript and for providing helpful comments.
- © PDA, Inc. 2013


