
Abstract
The structural analysis (i.e., identification) of organic chemical entities leached into drug product formulations has traditionally been accomplished with techniques involving the combination of chromatography with mass spectrometry. These include gas chromatography/mass spectrometry (GC/MS) for volatile and semi-volatile compounds, and various forms of liquid chromatography/mass spectrometry (LC/MS or HPLC/MS) for semi-volatile and relatively non-volatile compounds. GC/MS and LC/MS techniques are complementary for structural analysis of leachables and potentially leachable organic compounds produced via laboratory extraction of pharmaceutical container closure/delivery system components and corresponding materials of construction. Both hyphenated analytical techniques possess the separating capability, compound specific detection attributes, and sensitivity required to effectively analyze complex mixtures of trace level organic compounds. However, hyphenated techniques based on mass spectrometry are limited by the inability to determine complete bond connectivity, the inability to distinguish between many types of structural isomers, and the inability to unambiguously determine aromatic substitution patterns. Nuclear magnetic resonance spectroscopy (NMR) does not have these limitations; hence it can serve as a complement to mass spectrometry. However, NMR technology is inherently insensitive and its ability to interface with chromatography has been historically challenging. This article describes the application of NMR coupled with liquid chromatography and automated solid phase extraction (SPE-LC/NMR) to the structural analysis of extractable organic compounds from a pharmaceutical packaging material of construction. The SPE-LC/NMR technology combined with micro-cryoprobe technology afforded the sensitivity and sample mass required for full structure elucidation. Optimization of the SPE-LC/NMR analytical method was achieved using a series of model compounds representing the chemical diversity of extractables. This study demonstrates the complementary nature of SPE-LC/NMR with LC/MS for this particular pharmaceutical application.
LAY ABSTRACT: The identification of impurities leached into drugs from the components and materials associated with pharmaceutical containers, packaging components, and materials has historically been done using laboratory techniques based on the combination of chromatography with mass spectrometry. Such analytical techniques are widely recognized as having the selectivity and sensitivity required to separate the complex mixtures of impurities often encountered in such identification studies, including both the identification of leachable impurities as well as potential leachable impurities produced by laboratory extraction of packaging components and materials. However, while mass spectrometry–based analytical techniques have limitations for this application, newer analytical techniques based on the combination of chromatography with nuclear magnetic resonance spectroscopy provide an added dimension of structural definition. This article describes the development, optimization, and application of an analytical technique based on the combination of chromatography and nuclear magnetic resonance spectroscopy to the identification of potential leachable impurities from a pharmaceutical packaging material. The complementary nature of the analytical techniques for this particular pharmaceutical application is demonstrated.
Introduction
The United States Food and Drug Administration (FDA) has established that certain dosage forms (e.g., inhalation aerosols and solutions, injectables, and injectable suspensions) are at relatively high risk for the likelihood of interaction between the drug product formulation and packaging system, while also being of highest concern regarding route of administration (1). Also of relatively high concern in both categories are ophthalmic solutions and suspensions, nasal aerosols, transdermal ointments and patches, and nasal sprays (1). These regulatory concerns can be interpreted in terms of the relative risk that a particular dosage form type will leach organic or inorganic compounds from the container closure system over its shelf life, and that these leachables could pose a potential safety risk to patients. For inhalation drug products (i.e., orally inhaled and nasal drug products, or OINDP), a working group of the Product Quality Research Institute (PQRI) has established safety and analytical thresholds for leachables evaluation and qualification (2, 3). In addition, the PQRI working group established best practices for pharmaceutical development of inhalation drug products relative to leachables and potential leachables (2, 4), the scientific principles of which can be extrapolated to other dosage forms, such as parenterals, injectables, and ophthalmics (5). When present in inhalation drug products, as well as other relatively high-risk dosage forms, organic leachables are typically at trace levels (i.e., parts-per-million and parts-per-billion) and can also be present as relatively complex mixtures (6). Potential leachables, also termed extractables, which are produced during laboratory controlled extraction studies of container closure system components and packaging materials of construction, are also typically complex mixtures and can be at trace levels depending on the extraction solvent/conditions employed and the levels of individual extractables in the component or material being extracted (7⇓–9). The PQRI thresholds for leachables require identification and evaluation of leachables and potential leachables at these relatively trace levels to help ensure patient safety.
The structural analysis (i.e., identification) of organic leachables and extractables has traditionally been accomplished with techniques involving the combination of chromatography with mass spectrometry (10, 11). These include gas chromatography/mass spectrometry (GC/MS) for volatile and semi-volatile compounds, and various forms of liquid chromatography/mass spectrometry (LC/MS or HPLC/MS) for semi-volatile and relatively non-volatile compounds. GC/MS and LC/MS techniques are considered to be complementary for structural analysis applications to leachables and extractables. Additionally, both hyphenated analytical techniques incorporate the separating capability, compound specific detection attributes, and sensitivity required to effectively analyze the potentially complex mixtures of trace level organic compounds that can appear as drug product leachables and laboratory extractables. However, any hyphenated technique based on mass spectrometry must incorporate the known limitations of mass spectrometry for structural analysis. While mass spectrometry offers the ability to obtain molecular weights, molecular formulas, and fragmentation patterns of unknown organic chemical entities at trace levels, it does not allow for the determination of complete bond connectivity and therefore unambiguous proof of structure. Other limitations include the inability to distinguish between many types of structural isomers, and the inability to unambiguously determine aromatic substitution patterns. Nuclear magnetic resonance (NMR) spectroscopy is capable of establishing chemical bond connectivity, distinguishing between various structural isomers, and determining aromatic substitution patterns, hence serving as a complement to mass spectrometry. However, NMR spectroscopy has low sensitivity, requiring approximately 10–100 μg of an organic compound for complete structure characterization (as compared with approximately 1–100 ng for mass spectrometry). Likewise, the inherent low sensitivity of NMR spectroscopy combined with on-flow dynamics issues can compromise the ability of NMR spectroscopy to routinely interface with chromatography relative to mass spectrometry.
Over the past two decades, the combination of NMR spectroscopy and high-performance liquid chromatography (HPLC) has become a reality in the form of the hyphenated techniques collectively termed LC/NMR. LC/NMR can be accomplished with four basic instrument configurations:
On-flow—Similar to an LC/MS experiment. The NMR spectrometer is acquiring data as the HPLC column eluent passes through a specially designed flow-probe. This technique is extremely insensitive and requires deuterated mobile phase constituents.
Stop-flow—The HPLC pump(s) are stopped as each eluting peak of interest enters the flow-probe. This technique allows for increased sensitivity through signal summing, but still requires deuterated mobile phase constituents.
Loop-collection—Eluting peaks of interest are collected in specially designed sample loops, which can be sequentially moved to the flow-probe for analysis. This technique also allows for increased sensitivity through signal summing, but still requires deuterated mobile phase constituents.
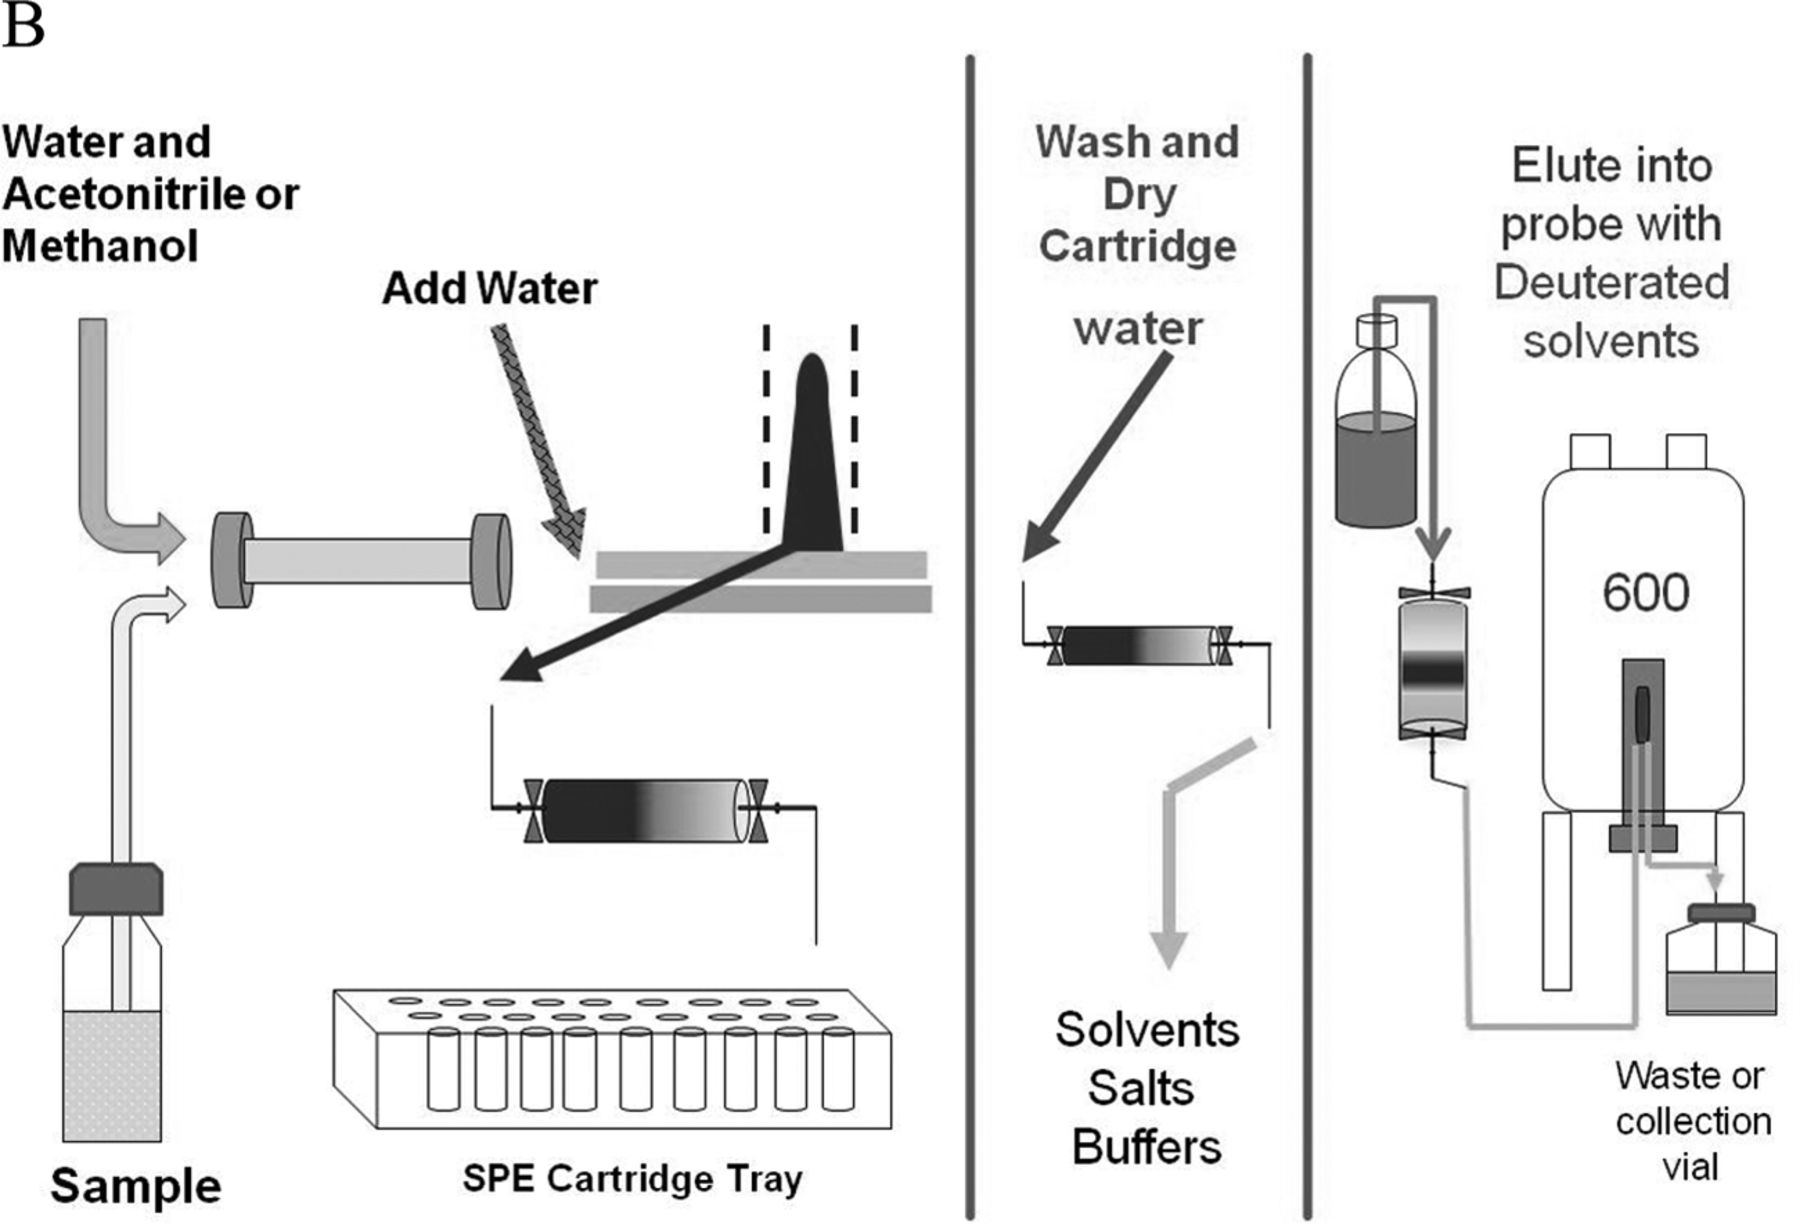
Automated Solid Phase Extraction (SPE)—Eluting peaks of interest are collected and concentrated in separate SPE cartridges, which are sequentially washed, dried, and eluted with deuterated acetonitrile into the flow-probe for analysis. This technique allows for peaks of interest to be concentrated from multiple sample injections, resulting in significantly enhanced sensitivity. Deuterated mobile phase constituents are not required.
Note that on-flow, stop-flow, and loop-collection are discussed in greater detail in Norwood et al. (12). Automated SPE interfaced with LC/NMR allows for peaks of interest to be collected in sufficient amounts and purities for NMR structural analysis, while not encumbering the HPLC platform with constraints on mobile phase composition.
This article describes the application of NMR coupled with liquid chromatography (LC/NMR) and automated solid phase extraction (SPE) to the structural analysis of extractable organic compounds from a pharmaceutical packaging material of construction. The HPLC/SPE analytical method was evaluated and optimized using a series of model compounds chosen to represent the chemical diversity of extractables and having a wide range of Log P (octanol/water partition coefficient; 1.89 to 18.83). SPE cartridges packed with C8, C18, and GPResin (a polymeric “C18” phase) were evaluated, and SPE cartridge performance was assessed by determining the recovery of each model compound from each SPE cartridge type with a reverse-phase HPLC platform. Every determined recovery takes into consideration the trapping efficiency from the HPLC platform, as well as the elution efficiency from the SPE cartridge with deuterated acetonitrile under the prescribed conditions of the experiment. Recovery was assessed by transferring individual trapped peaks to a room temperature (rt) flow-probe with acquisition of a one-dimensional (1D) 1H NMR spectrum, followed by separate HPLC/UV analysis of samples flushed from the flow-probe. The resulting optimized SPE-LC/NMR platform was then applied, in combination with separate LC/MS analyses, to the structural analysis of potential leachables resulting from the laboratory extraction of a cyclic olefin co-polymer (COC) pharmaceutical packaging material of construction. Note that COC is used for the fabrication of pre-filled syringes, vials for small-volume parenterals, and bags for large-volume parenterals. This particular COC material of construction was known to contain Irganox 1010 as an antioxidant. Peaks of interest from the COC extractables profile were recovered from the optimized SPE platform and eluted into the NMR flow-probe where 1D 1H NMR spectra were acquired in order to determine if an adequate amount of material had been recovered for NMR structural analysis. Additional NMR structural characterization was accomplished by flushing individual samples from the rt-flow-probe for analysis on a second NMR spectrometer equipped with a 1.7 mm capillary cryoprobe. A schematic of the overall work flow is shown in Figure 1⇓.
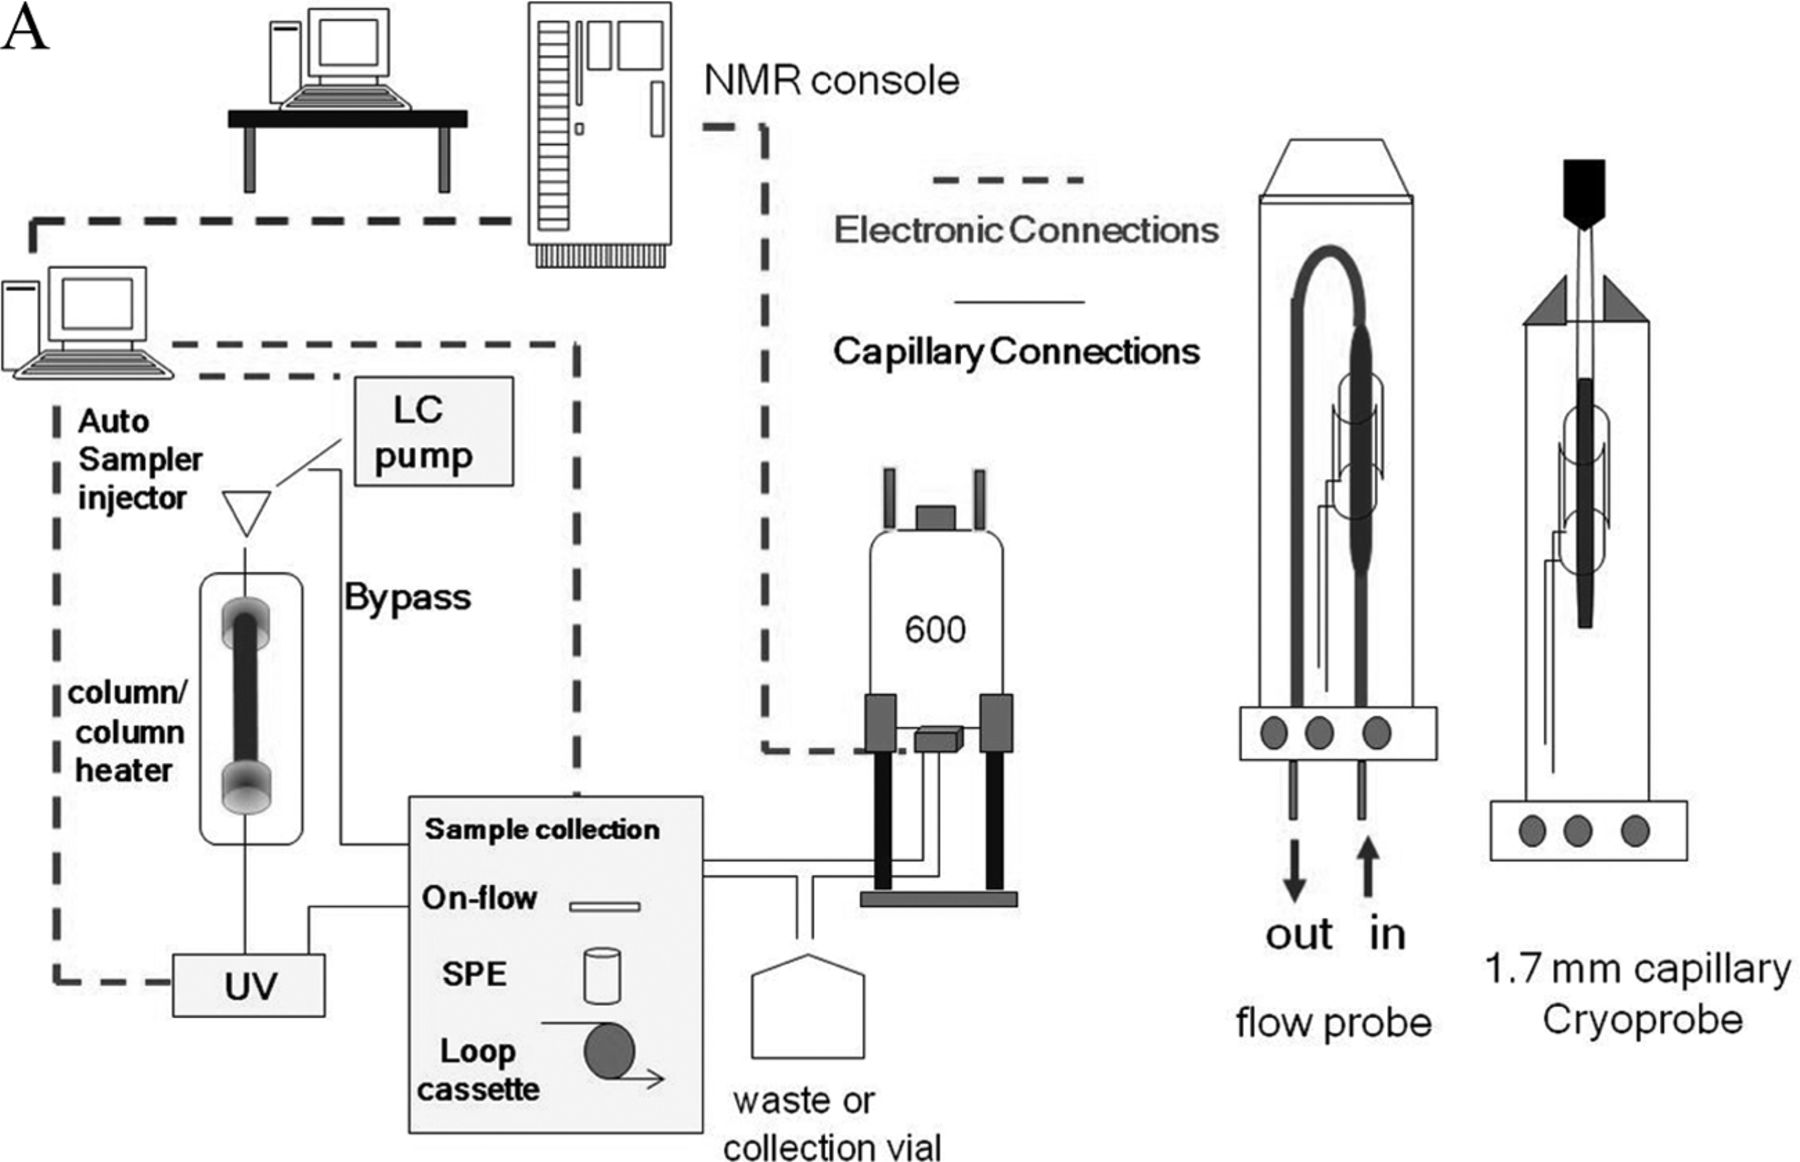
A representation of the basic workflow of the SPE-LC/NMR system. Note that the Bruker “sample collection module” is configured with appropriate components for accomplishing all types of LC/NMR, including on-flow, stop-flow, loop-collection, and automated SPE. Note also the pictorial representation of the LC/NMR flow-probe and 1.7 mm capillary cryoprobe.

Detailed representation of the automated SPE-LC/NMR process. Note that individual HPLC/UV peaks are collected on separate SPE cartridges, which are subsequently washed, dried, and eluted into the NMR flow-probe.
Experimental
Model Compounds for SPE-LC/NMR Recovery Evaluation
The model compounds for SPE-LC/NMR recovery evaluation were selected as representative of the chemical diversity of organic additives used in elastomer and plastic container closure/delivery system/medical device components and materials of construction (2, 13⇓15–16). These model compounds, with their wide range of log P (1.89–18.83) also represent the chemical diversity of potential leachables amenable to analysis by HPLC techniques. The model compounds include (I) benzothiazole (CAS #95-16-9); (II) 3,8,15,20-tetraoxatricyclo[20.2.2.210,13]octacosa-10,12,22,24,25,27-hexaene-2,9,14,21-tetrone (“PBT Dimer”; CAS #63440-93-7); (III) N-phenyl-benzenamine (diphenylamine; CAS#122-39-4); (IV) 4,4'-(1-methylethylidene)bis-phenol (“bisphenol A”; CAS #80-05-7); (V) (2-hydroxy-4-methoxyphenyl)phenyl-methanone (2-hydroxy-4-methoxybenzophenone; CAS #131-57-7); (VI) 1,2-benzenedicarboxylic acid, 1-(2-ethylhexyl) ester (“MEHP”; CAS #4376-20-9); (VII) phenol, 2,6-bis(1,1-dimethylethyl)-4-methyl- (“BHT”; CAS #128-37-0); (VIII) 1,2-benzenedicarboxylic acid, 1,2-bis(2-ethylhexyl) ester (DEHP; CAS #117-81-7); (IX) benzenepropanoic acid, 3,5-bis(1,1-dimethylethyl)-4-hydroxy-, octadecyl ester (Irganox 1076; CAS #2082-79-3); (X) phenol, 2,4-bis(1,1-dimethylethyl)-, 1,1',1''-phosphite (Irgafos 168; CAS #31570-04-4); (XI) benzenepropanoic acid, 3,5-bis(1,1-dimethylethyl)-4-hydroxy-, 1,1'-[2,2-bis[[3-[3,5-bis(1,1-dimethylethyl)-4-hydroxyphenyl]-1-oxopropoxy]methyl]-1,3-propanediyl] ester (Irganox 1010; CAS #6683-19-8); (XII) bis(dibutylcarbamodithioato-κS,κS')-, (T-4)- zinc (“Zn DBDC”; CAS #136-23-2). These compounds were obtained from various commercial sources (Chem Service, West Chester, PA; Sigma-Aldrich, St. Louis, MO; Accustandard, New Haven, CT; USP, Rockville, MD; Lancaster Synthesis, Pelham, NH; Ciba-Geigy, Hawthorne, NY) and were used without further purification. The “PBT Dimer” was obtained as a synthetic reference standard from Cardinal Health (now Catalent Pharma Solutions, Research Triangle Park, NC) (Cardinal Health, lot TTP-CPS-M0014-SD-2-16-34).
HPLC Platform
Table I lists the conditions and parameters used in the HPLC platform for the model compound recovery experiments, LC/MS experiments, and SPE-LC/NMR experiments on model compounds and material extracts. For the model compound recovery experiments via HPLC/UV, an Agilent Technologies (Wilmington, DE) 1100 HPLC system was used, which included a quaternary pump (model G1311A), diode-array detector (model G1315B), column compartment (model G1316A), degasser (model G1379A), and autosampler (model G1313A). Data acquisition and processing were accomplished with custom in-house applications software.
HPLC Platform
COC Extract Preparation (17⇓–19)
Approximately 5 g of COC material was weighed and transferred to a round-bottom flask, followed by approximately 200 mL of hexane (Sigma-Aldrich). The sample was then heated for 2 h under reflux conditions and the round-bottom flask was allowed to cool to room temperature. After solvent reduction below a volume of 100 mL, the extract was transferred to a 100 mL volumetric flask and then brought to final volume with additional hexane. A 15 mL aliquot of extract was taken and reduced to approximately 1 mL, to which 2.0 mL of methanol was added as a keeper solvent. The final volume was reduced to 1.0 mL using a stream of dry nitrogen prior to LC/MS and SPE-LC/NMR analyses. Note that during the extraction process, measured quantities of internal standards were added, including 2-fluorobiphenyl, Bisphenol M, and Irganox 415. As these internal standards were added to support other aspects of a larger extraction study protocol (e.g., extraction efficiency determination, analyte recoveries, analyte quantitation), the details of their use are not described here.
LC/MS Analyses
LC/MS analyses of COC hexane extracts were initially accomplished on an Agilent Time-of-Flight (TOF) mass spectrometer (model G1969A_1) with negative ion atmospheric pressure chemical ionization (APCI), interfaced with an Agilent 1100 HPLC system. The mass range was 50–3200 amu with a transient scan of 10,000. The injection volume was 5 μL and in-line UV detection was accomplished at 280 nm. The other HPLC platform parameters are listed in Table I. The Agilent 1100 HPLC system included a binary pump (model G1312A), diode-array detector (model G1315B), column compartment (model G1316A), degasser (model G1379A), and autosampler (model G1367A).
Additional LC/MS analyses were accomplished on a Thermo Finnigan LTQ FT Ultra with positive and negative electrospray ionization (ESI), interfaced with an Agilent 1200 HPLC system. This hybrid LC/MS instrument incorporates a linear quadrupole ion trap mass spectrometer (LTQ) linked with a Fourier Transform ion cyclotron resonance mass spectrometer (FT-ICR). Data acquisition was accomplished in “FT mode” over a mass range of 150–1500 amu at 50,000 resolving power. The injection volume was 10 μL and in-line UV detection was accomplished at 205 nm. The other HPLC platform parameters are listed in Table I. The Agilent 1200 HPLC system included a binary pump (model G1312B), diode-array detector (model G1315C), column compartment (model G1316B), degasser (model G1379B), and autosampler (model G1367C).
SPE-LC/NMR System and Conditions
SPE-LC/NMR experiments were accomplished using an Agilent Technologies 1200 HPLC system that included a quaternary pump (model G1311A), diode-array detector (model G1315D), degasser (model G1322A), and autosampler (model G1367B), along with a variable temperature-regulated Bruker (Bruker Biospin, Billerica, MA) column compartment (model BMSO). Automated solid phase extractions of target HPLC/UV peaks were accomplished on a Spark Holland (Emmen, The Netherlands) Prospekt-2 system, interfaced to the HPLC. The Prospekt-2 system included an ACE LC-SPE-NMR Interface, an Organizer, a dual-syringe pump Dispenser (for cartridge wash water and deuterated acetonitrile), and a K-120 make-up pump for post-HPLC column (pre-SPE cartridge) addition of water. Trapped compounds were eluted from each solid phase extraction cartridge with deuterated acetonitrile (Cambridge Isotope Laboratories, Inc., Andover, MA) into the 30 μL rt-flow-probe installed on an Avance III 600 MHz NMR spectrometer (Bruker BioSpin) operating at 600.04 MHz for 1H-NMR. 1D 1H-NMR spectra were acquired at 300 K using a spectral width of 12019 Hz, WET 1D solvent suppression with 13C low power decoupling during WET and acquisition, and a relaxation delay of 3 s (20). Data were processed using exponential multiplication with line broadening of 1.0 Hz.
SPE Cartridge Evaluation
Model compounds were prepared at a nominal concentration of 2 mg/mL each in acetonitrile (Sigma Aldrich, Chromsolv grade), except for Zn DBDC and Irgafos 168 which, due to limited solubility, were prepared at nominal concentrations of 1 mg/mL and 0.6 mg/mL, respectively. The SPE cartridges evaluated were C8, C18, and GPResin (Spark Holland). Two injections of each model compound (HPLC platform described above) were trapped onto each cartridge type under evaluation (water make-up flow of 2 mL/min). Prior to trapping, each SPE cartridge was conditioned and equilibrated with acetonitrile and water. Each SPE cartridge containing a trapped model compound was dried with nitrogen gas (30 min) and eluted with deuterated acetonitrile (330 μL at 300 μL/min) into the LC/NMR flow-probe for 1D 1H-NMR analysis. Following NMR data collection, the sample was transferred to a vial and diluted to 1 mL with acetonitrile for chromatographic analysis to determine recovery. Each analyte was assayed via HPLC/UV against an external three-point calibration curve at concentrations of 0.002 mg/mL, 0.02 mg/mL, and 0.1 mg/mL. The most efficient SPE cartridge (GPResin) was utilized for subsequent SPE-LC/NMR isolation of potential leachables derived from the COC material of construction.
SPE-LC/NMR of COC Extract
Unknown target extractables from the COC hexane extract were separated with the standard HPLC platform and trapped on separate GPResin SPE cartridges using the conditions described above. In order to isolate sufficient amounts of the target compounds, 10 sequential, 50 μL sample injections were made with each target HPLC peak concentrated on a separate SPE cartridge.
NMR (1.7 mm Capillary Cryoprobe)
Unknown COC extract peaks were eluted from the NMR 30 μL rt-flow-probe with a stream of dry nitrogen gas and collected in 1 mL glass test tubes. Each isolated sample was reduced to dryness at 30 °C with a Biotage microdryer (Biotage AB, Uppsala, Sweden) using a gentle stream of dry nitrogen gas. The material was subsequently dissolved in approximately 30 μL of deuterated acetonitrile and transferred to a 1.7 mm capillary tube for NMR analysis.
The 1H NMR experiments were performed at 300 K on a Bruker Biospin AV 600 spectrometer operating at 600.2 MHz and using a 1.7 mm CP TCI Z gradient probe. Indirect detection 1H13C NMR experiments were performed with 13C operating at 150.92 MHz. 1H and 13C chemical shift assignments were referenced to acetonitrile-d3 at 1.93 ppm and 118.2 ppm, respectively. 1D 1H data were obtained using a spectral width of 12376 Hz, a 10° pulse and a 2 s relaxation delay. Solvent suppression on the cryoprobe was achieved using WET 1D with 13C low power decoupling during WET and acquisition, a sweep width of 12019 Hz, and a relaxation delay of 3 s (20). All 1D data were processed using exponential multiplication with line broadening of 0.05–1 Hz.
2D gradient-selected 1H-1H gCOSY spectra, using a shaped pulse for double off-resonance presaturation with continuous wave (cw)-decoupling on the 13C channel, were obtained using a relaxation time of 2.0 s per transient, and a spectral width of 9614 Hz in both dimensions (2K complex points in f2, 160 real points along f1). A 90° read pulse was used. These data were processed by zero filling to 2K complex points in f2, 512 real points in f1, followed by SINE apodization in both dimensions; Fourier transformation produced a magnitude spectrum with positive absorption in both f1 and f2 dimensions.
2D 1H-1H gTOCSY (21) data were obtained in phase-sensitive mode using two power levels for excitation and spinlock. WET solvent suppression with sine.1 shaped pulse and 13C decoupling on during WET and data acquisition were used. Data were acquired using 2K complex points in f2, 256 real points along f1, a relaxation time of 1.5 s per transient, and a spectral width of 8680 Hz in both dimensions. A 60 ms spin lock time was used. These data were processed by zero filling to 2K complex points in f2 filling to 512 real points in f1, followed by QSINE apodization in both dimensions, Fourier transformation, and phasing.
2D phase-sensitive 1H-1H ROESY (22) spectra with cw spinlock for mixing and presaturation of the water resonance were obtained (1K complex points in f2, 256 real points along f1) using a relaxation time of 2.0 s per transient, and a spectral width of 12,004 Hz in both dimensions. A 500 ms mixing time was used. These data were processed by zero filling to 2K complex points in f2, 1K real points in f1, followed by QSINE apodization in both dimensions, Fourier transformation, and phasing.
13C data were obtained using a 2D 1H-13C HSQC (23) with 1H/X correlation via double inept transfer. The specta were collected in a phase-sensitive mode using Echo/Antiecho-TPPI gradient selection with a sine.1 shape pulse with decoupling during acquisition. Spectra were obtained (1K complex points in f2, 256 real points along f1) using GARP decoupling, a relaxation time of 1.5 s per transient, and a spectral width of 8012 Hz in f2 and 30,187 Hz in f1. The carrier frequency for 13C was 15092 Hz. Delays were used for a 1J (13C-1H) coupling constant of 145 Hz. These data were processed by zero filling to 1K complex points in f2, 1K real points in f1, followed by QSINE apodization in both dimensions. Fourier transformation and phasing were applied to achieve positive absorption in both f1 and f2 dimensions.
2D gradient selected 1H-13C gHMBC (24) data were obtained (2K complex points in f2, 512 real points along f1) using WALTZ-16 decoupling, a relaxation time of 1.5 s per transient, and a spectral width of 8680 Hz in f2 and 36225 Hz in f1. The carrier frequency for 13C was 17,358 Hz. Delays were based on a 1J (13C-1H) coupling constant of 145 Hz and an average long-range 2-bond/3-bond J (13C-1H) coupling constant of 4.5 Hz. These data were processed by zero filling to 2K complex points in f2, 1K real points in f1, followed by QSINE apodization in both dimensions. Fourier transformation produced a magnitude spectrum with positive absorption in both f1 and f2 dimensions.
Results and Discussion
SPE-LC/NMR Experiments on Model Extractables
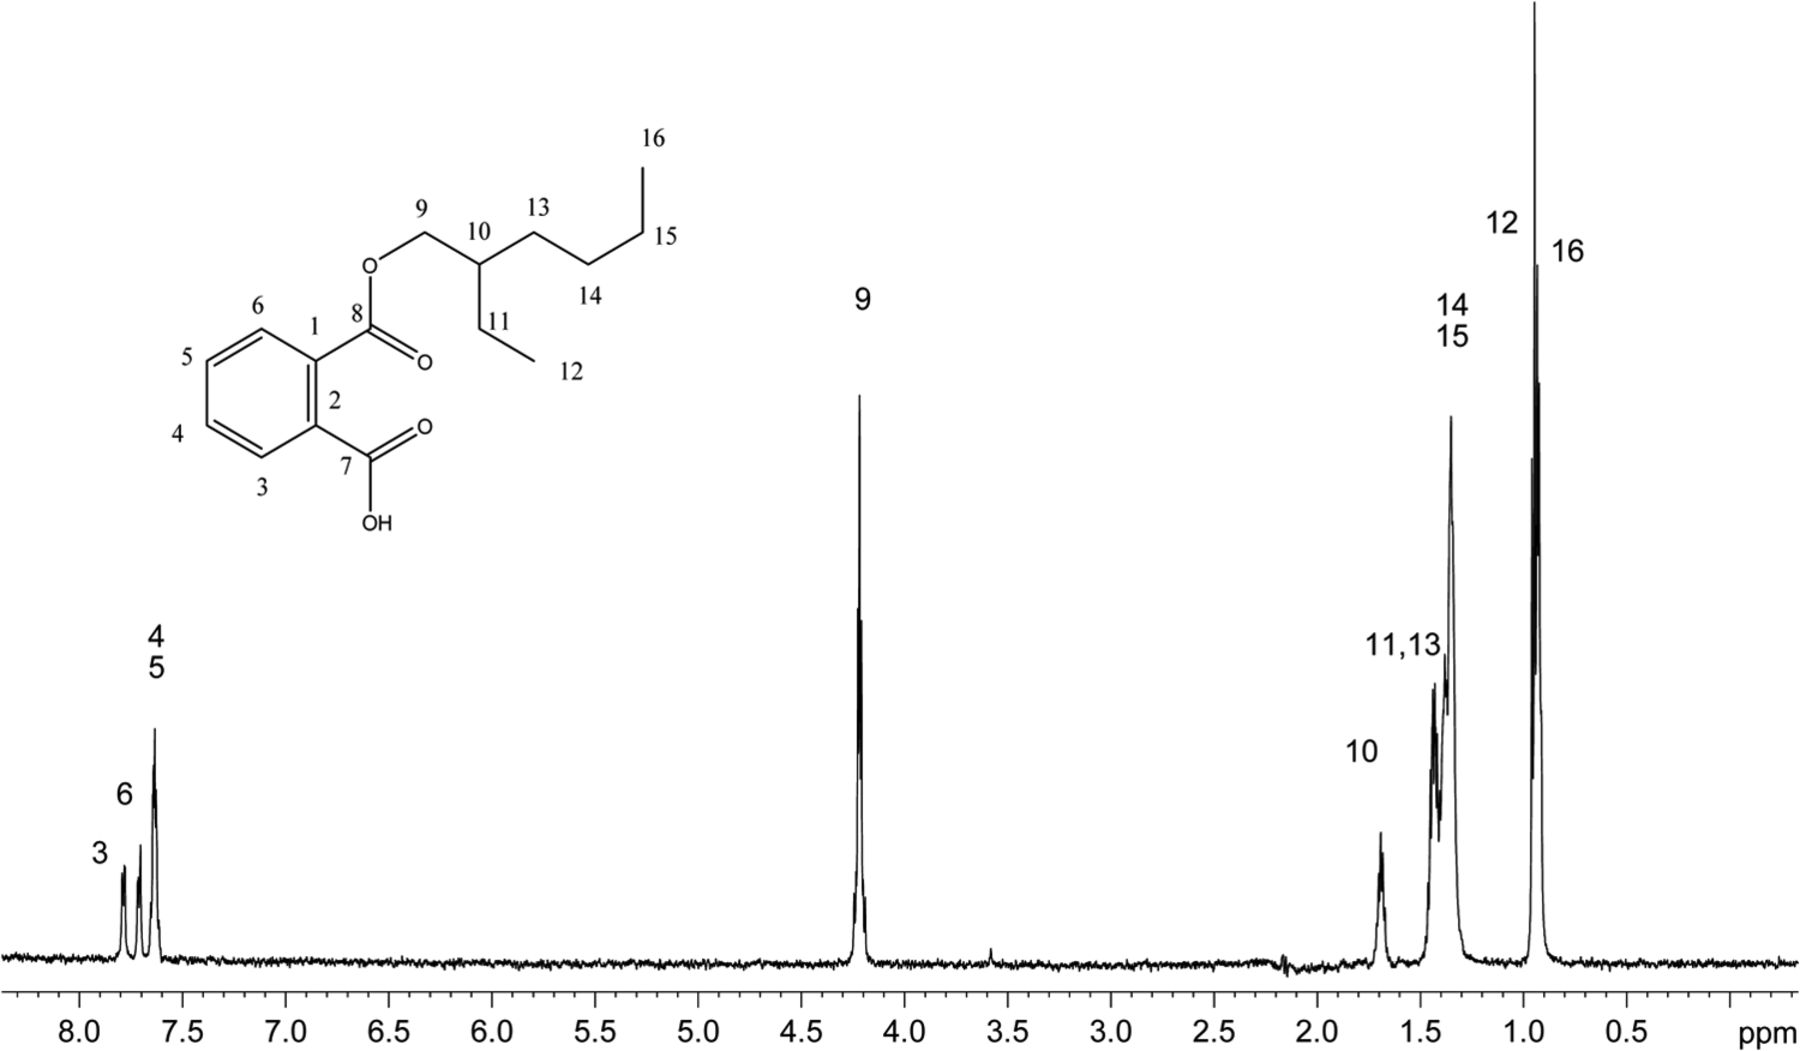
The recoveries of model extractables with SPE-LC/NMR using the three different SPE cartridge types are summarized in Table II. Mean recoveries observed for the each SPE cartridge type were GPResin 76.9%, C18 55.2%, and C8 48.1%, which clearly suggests that the platform incorporating GPResin was superior across the wide range of Log P and chemical diversity required to accomplish structural analysis of unknown extractables. Note that the calculated mean recoveries exclude zinc dibutlydithiocarbamate because this particular compound's recovery was relatively poor across all SPE-LC/NMR platforms (5.3–16.0%). Figure 2 shows a representative 1D 1H NMR spectrum of monoethylhexyl phthalate obtained with the 30 μL rt-flow-probe from one of the SPE-LC/NMR experiments. Based on these experiments with model extractables, the SPE-LC/NMR platform incorporating GPResin was chosen for application to the COC hexane extract.
Model Compound Recoveries from Various SPE Cartridges

1H 1D NMR spectrum of mono-ethylhexyl phthalate acquired in acetonitrile-d3 on a NMR spectrometer operating at 600.04 MHz, equipped with a 30 μL rt-flow probe. Wet solvent suppression was used to remove the large solvent peaks. A total of 256 scans were acquired.
LC/MS and SPE-LC/NMR Analysis of the COC Extract
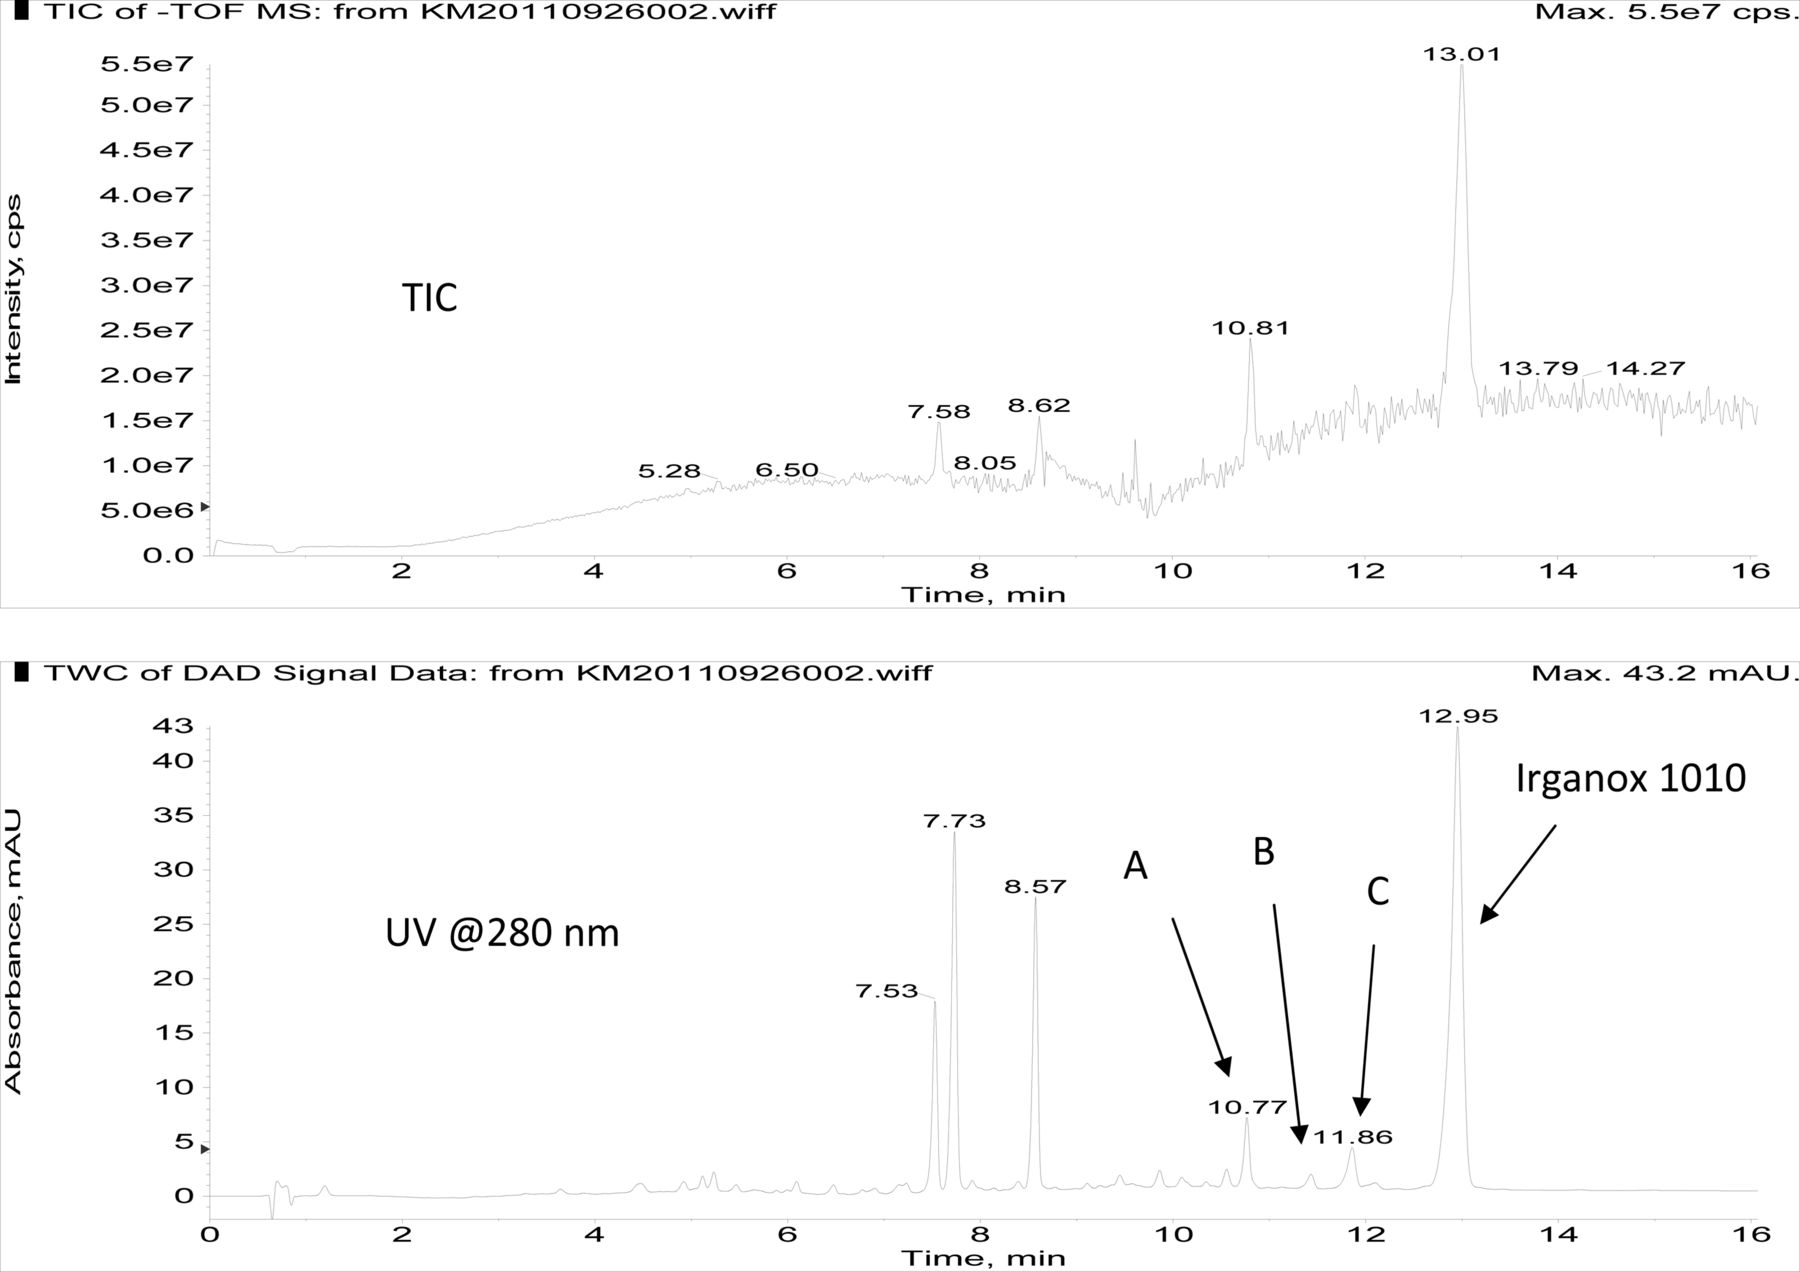
Figure 3 shows an overlay of the total ion current (TIC) chromatogram and in-line UV chromatogram from the negative ion APCI LC/MS analysis of the COC hexane extract (Agilent TOF LC/MS system). The major peak in both the TIC and UV chromatograms was determined to be Irganox 1010 (12.95 min retention time in the UV chromatogram). Note that the three significant UV peaks at retention times of 7.53, 7.73, and 8.57 min, respectively, were internal standards added to the COC extract (i.e., Bisphenol M, 2-Fluorobiphenyl, and Irganox 415, respectively). Three additional, relatively small UV chromatographic peaks, presumed to be structurally related to Irganox 1010, were selected for additional structural analysis by LC/MS and SPE-LC/NMR, and these are labeled A, B, and C in Figure 3. The structure of Irganox 1010 is shown below:


Total ion chromatogram (top) and in-line UV chromatogram (bottom) from the negative ion APCI LC/MS analysis of the COC extract (Agilent LC/TOF). Note that the major UV peak is identified as Irganox 1010, with unknowns for structural analysis labeled A, B, and C. The peaks at 7.53, 7.73, and 8.57 min in the UV chromatogram are internal standards.
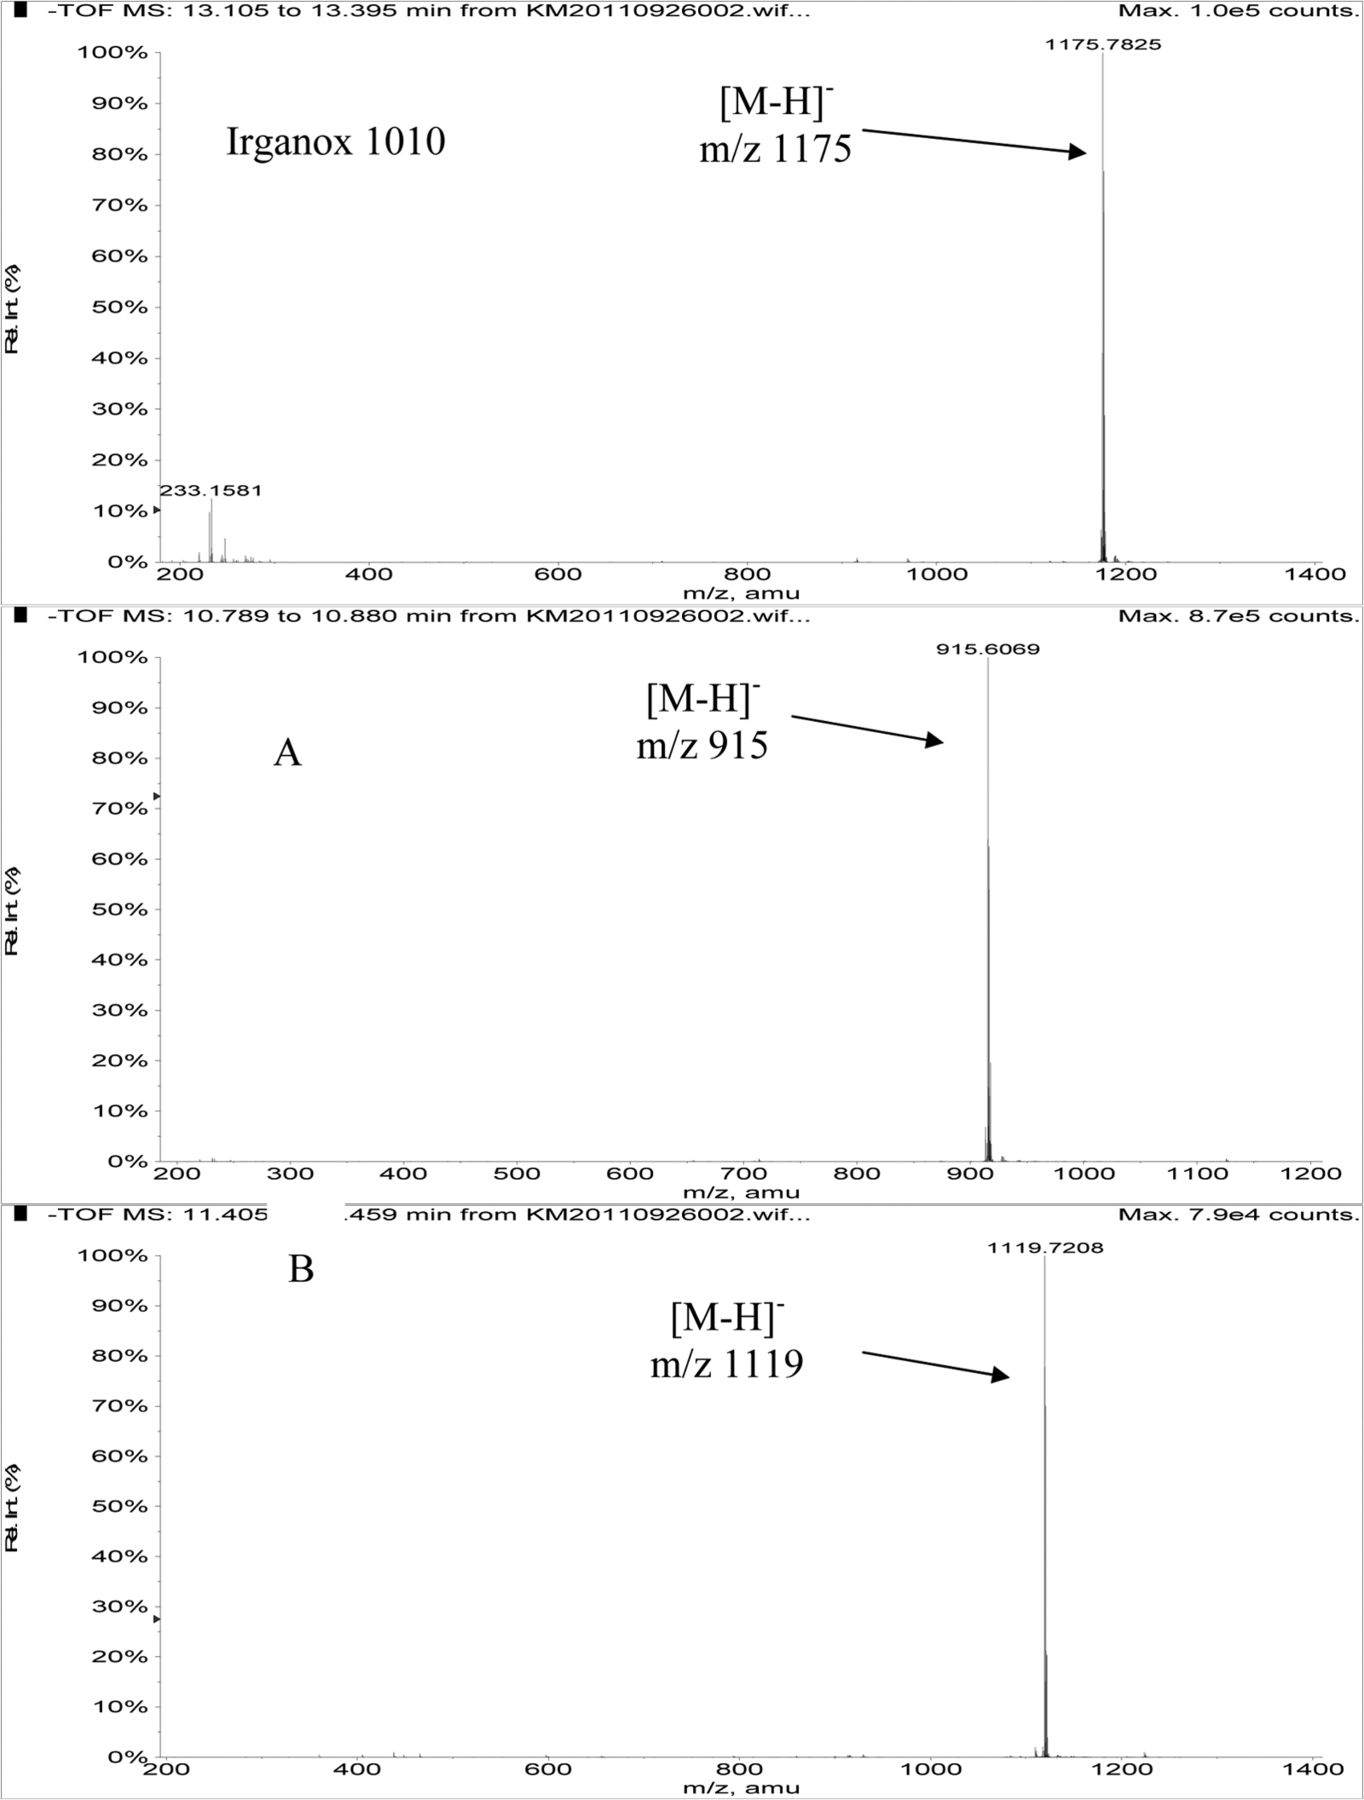
Table III summarizes the LC/MS information for Irganox 1010 and the three unknowns. Note that Irganox 1010 shows a clear [M-H]− at m/z 1175 (nominal monoisotopic molecular weight 1176), which was confirmed by an adduct ion with trifluoroacetate (TFA) in its negative ion ESI mass spectrum, and multiple adduct ions in its positive ion ESI mass spectrum. High-resolution, accurate mass measurements from the positive ion ESI spectrum confirmed the molecular formula. Unknowns A and B were confirmed to have nominal molecular weights of 916 and 1120, respectively (see Table III). Figure 4 shows representative negative ion APCI mass spectra of Irganox 1010 and unknowns A and B. 1D 1H NMR spectra from the SPE-LC/NMR analysis (data not shown) confirmed that unknowns A and B were structurally similar to Irganox 1010. Consideration of the structure of Irganox 1010, along with the nominal molecular weights and determined molecular formulae of unknowns A and B (Table III), suggested that these unknowns were simple degradation products of the parent Irganox 1010 structure. Unknown A was determined to be benzenepropanoic acid, 3,5-bis(1,1-dimethylethyl)-4-hydroxy-, 1,1'-[2-[[3-[3,5-bis(1,1-dimethylethyl)-4-hydroxyphenyl]-1-oxopropoxy]methyl]-2-(hydroxymethyl)-1,3-propanediyl] ester (CAS #84633-54-5), which represents loss of one of the symmetrical “arms” of the parent molecule:
Summary of Mass Spectrometry Data from Irganox 1010 and Related Structures

Negative ion APCI mass spectra of Irganox 1010 (top), unknown A (middle), and unknown B (bottom) from the COC extract (Agilent LC/TOF).
Unknown B was determined to be benzenepropanoic acid, 3,5-bis(1,1-dimethylethyl)-4-hydroxy-, 2-[[3-[3,5-bis(1,1-dimethylethyl)-4-hydroxyphenyl]-1-oxopropoxy]methyl]-2-[[3-[3-(1,1-dimethylethyl)-4-hydroxyphenyl]-1-oxopropoxy]methyl]-1,3-propanediyl ester (9CI) (CAS #159494-96-9), which represents loss of one of the symmetrical tert-butyl groups of the parent molecule:
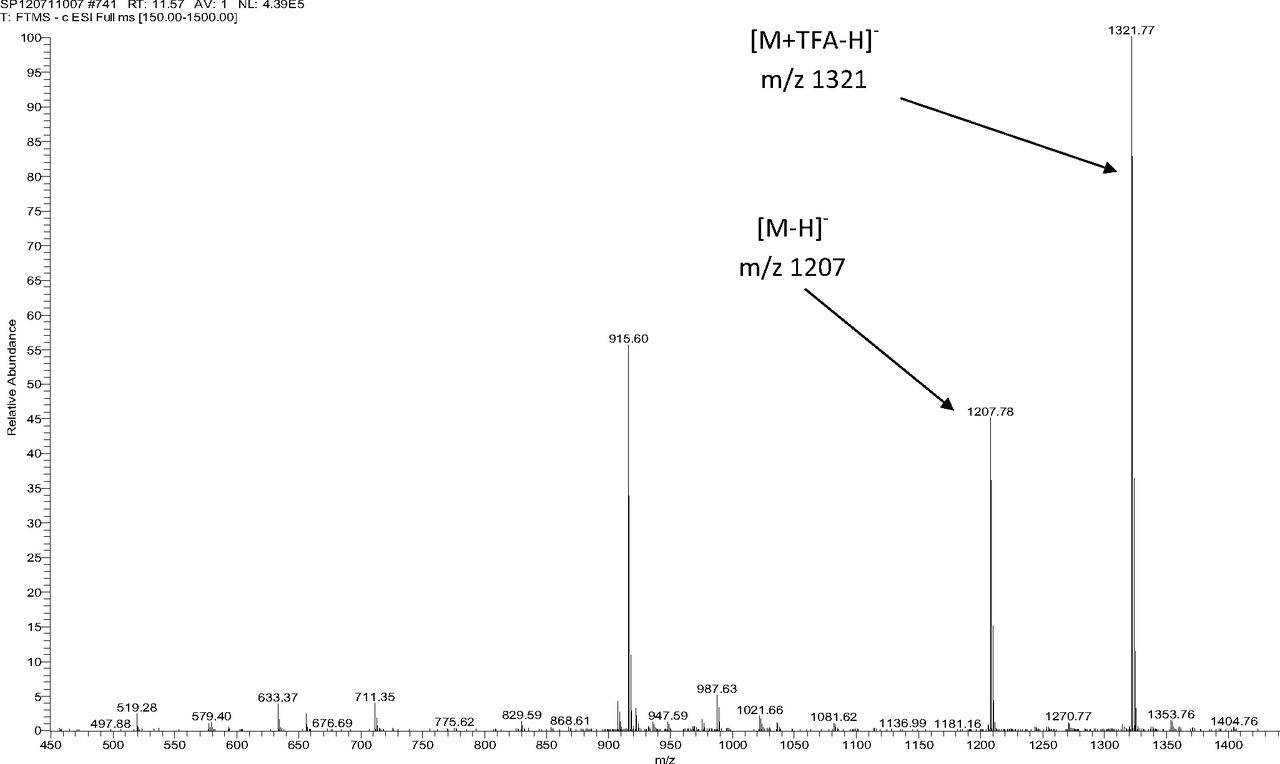
Figure 5 shows the negative ion APCI mass spectrum of unknown C. Note that this molecule fragments extensively (either through thermolytic or unimolecular processes in the APCI source) when compared to the other related structures (Figure 4), which makes the molecular ion difficult to identify. Positive and negative ion ESI spectra confirmed the nominal molecular weight to be 1208 (see Figures 6⇓–8 and Table III), with the determined molecular formula corresponding to the addition of two atoms of oxygen to the parent Irganox 1010 molecule. SPE-LC/NMR and 1.7 mm cryoprobe NMR analyses were then focused on the structural analysis of unknown C (Figure 9 shows an in-line UV chromatogram from an SPE-LC/NMR analysis with indication of peak isolations). 1D 1H NMR spectra of Irganox 1010 and unknown C (estimated at 5 μg) obtained using the 30 μL rt-flow-probe are shown in Figure 10. Comparison of theses spectra confirmed that unknown C was structurally related to Irganox 1010 with the addition of several new resonances noted as the minor component in Figure 10 (this term refers to the modified structural feature in unknown C).
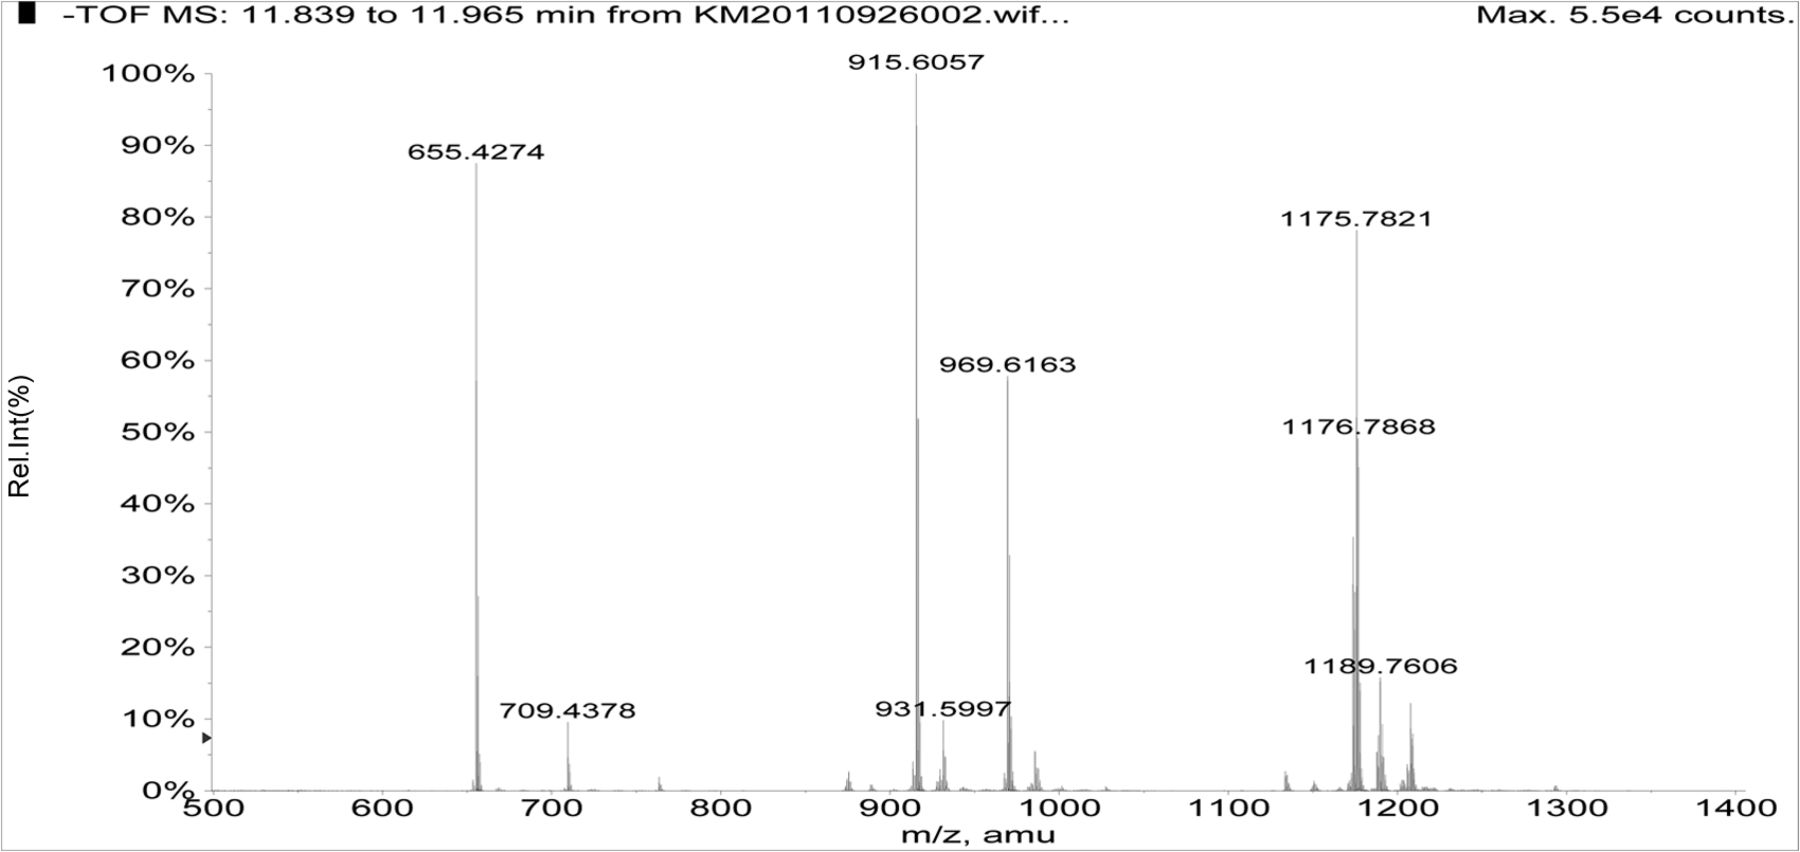
Negative ion APCI mass spectrum of unknown C from the COC extract (Agilent LC/TOF).
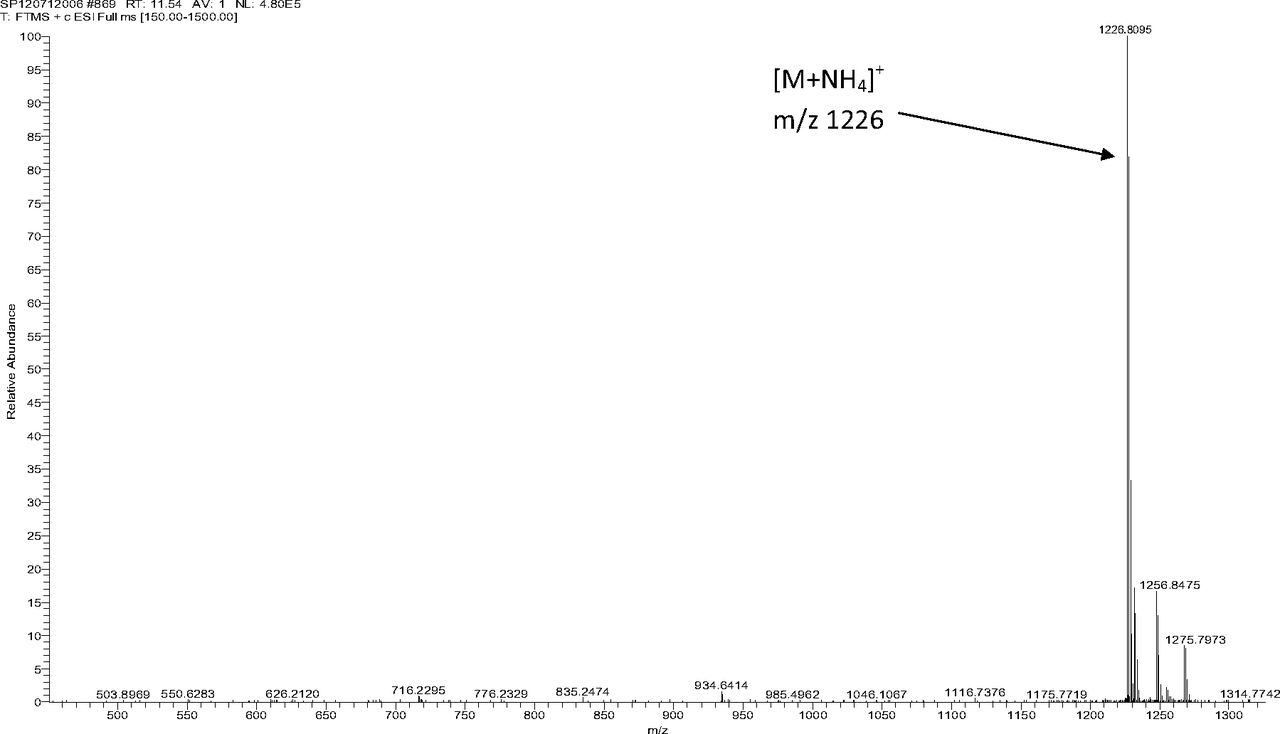
Positive ion ESI mass spectrum of unknown C from the COC extract (Thermo Finnigan LTQFT Ultra).

Expanded molecular ion region of the positive ion ESI mass spectrum of unknown C from the COC extract (Thermo Finnigan LTQFT Ultra) (EA: ethylamine; ACN: acetonitrile).

Negative ion ESI mass spectrum of unknown C from the COC extract (Thermo Finnigan LTQFT Ultra) (TFA: trifluoroacetic acid).
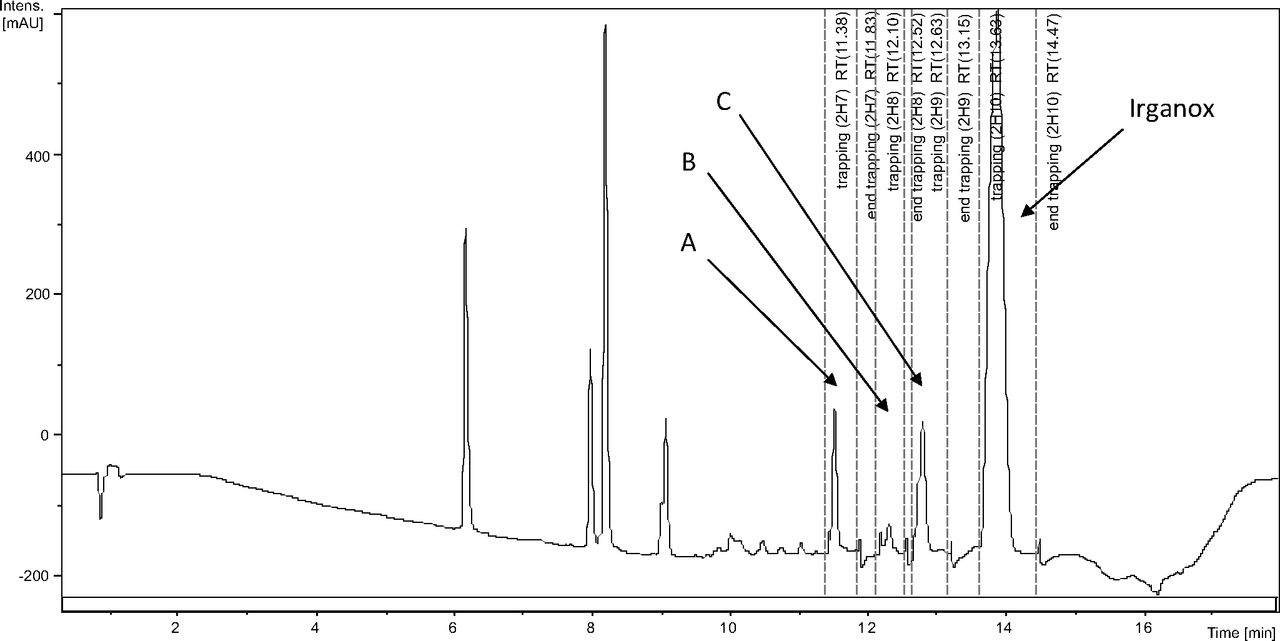
In-line LC/UV chromatogram from the automated SPE-LC/NMR analysis of the COC extract. Note the four regions of peak collection which included Irganox 1010 and unknowns A, B, and C.
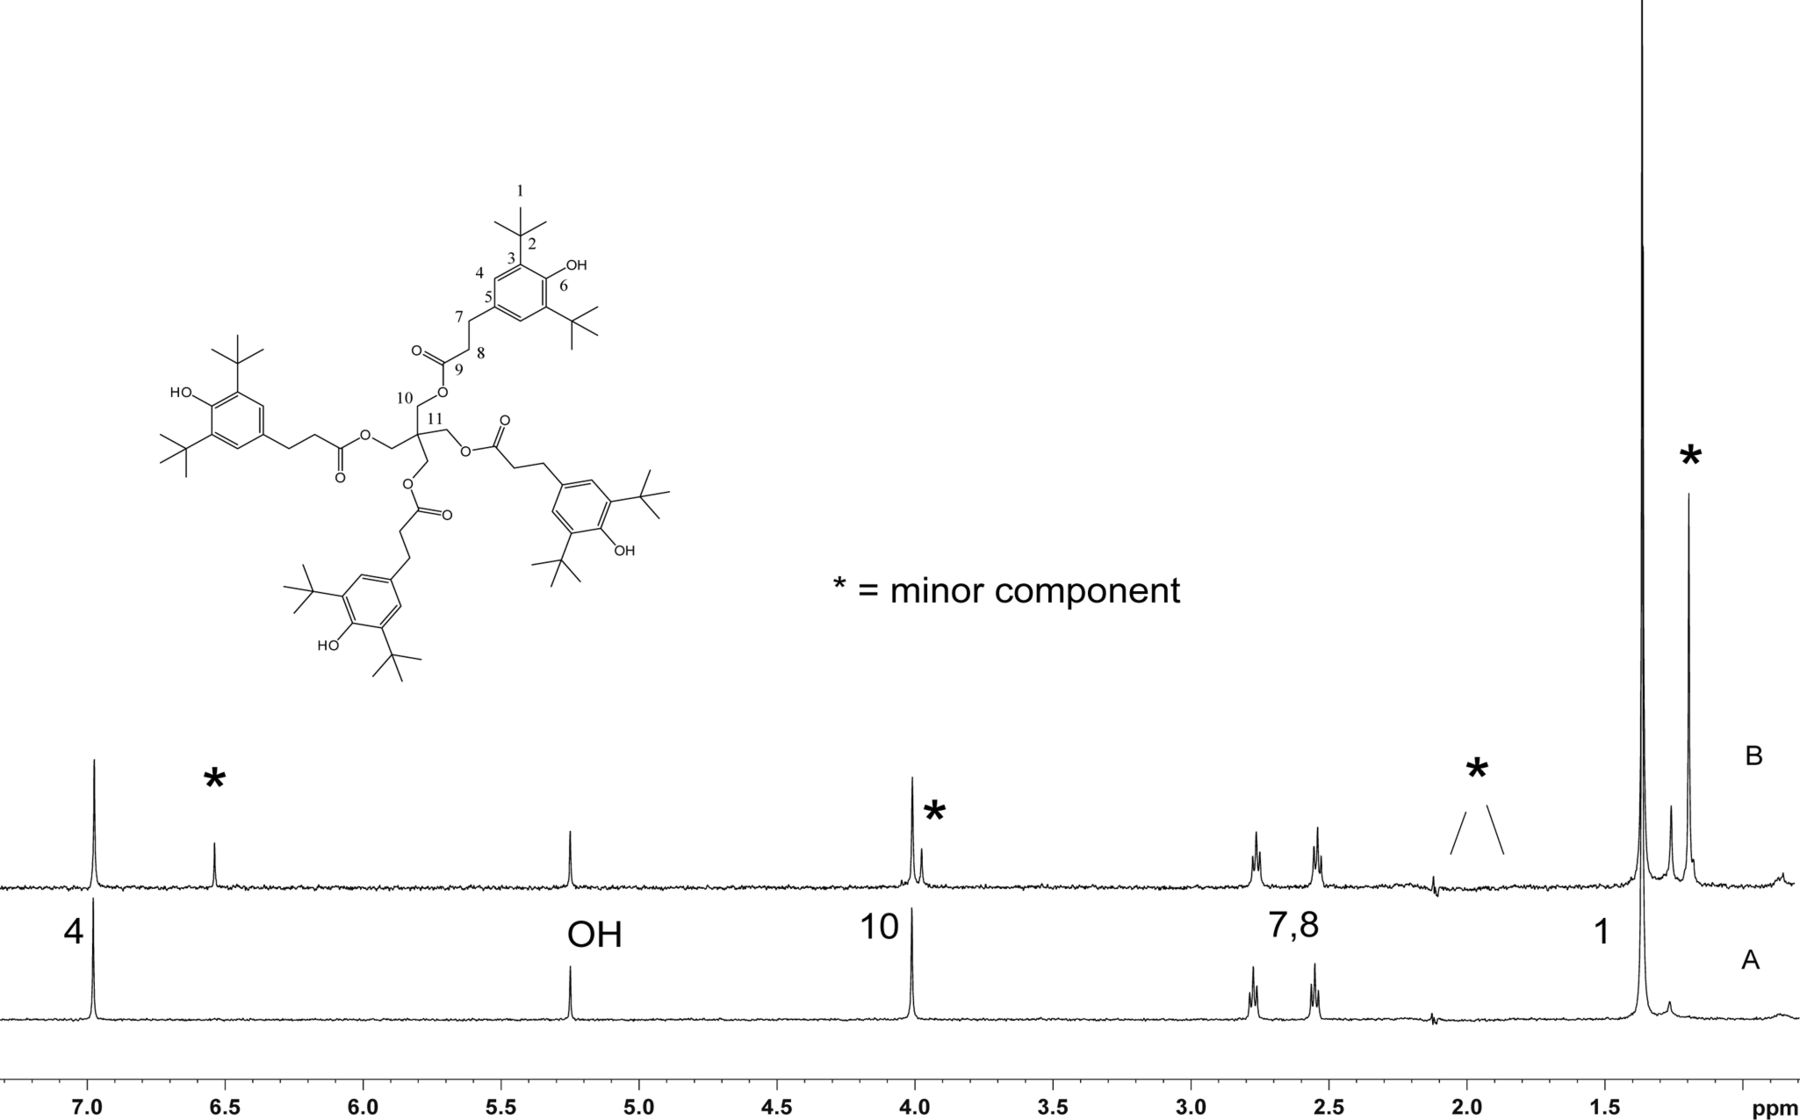
Comparison of the 1D 1H NMR spectrum of Irganox 1010 with that of unknown C from the COC extract. Data were acquired in acetonitrile-d3 on a NMR spectrometer operating at 600.04 MHz, equipped with a 30 μL rt-flow probe. WET solvent suppression was used to remove the large solvent peaks. A total of 128 scans were acquired for both spectra. (Bottom) Spectrum of Irganox 1010. Assignment of protons is shown. (Top) Spectrum of isolated unknown C. Peaks from the minor component in the structure are identified with an *. Signals of methylene peaks (1.9–2.2 ppm) that overlapped with solvent were suppressed.
The sample of unknown C was subsequently transferred to a capillary tube and data acquired using the 1.7 mm cryoprobe to enable full structure elucidation. A 1D 1H-spectrum with WET solvent suppression was acquired to reduce the large water peak so that signals from the isolated extract of unknown C could be observed. As previously found in spectra from the rt-flow probe, a major and minor set of resonances were observed. The 1D 1H NMR spectrum is shown in Figure 11, along with a structure that was proposed based on the mass spectral data showing the addition of two oxygens to a single arm of the Irganox 1010 molecule (note the m/z 915 fragment ion in the negative ion ESI spectrum shown in Figure 8).
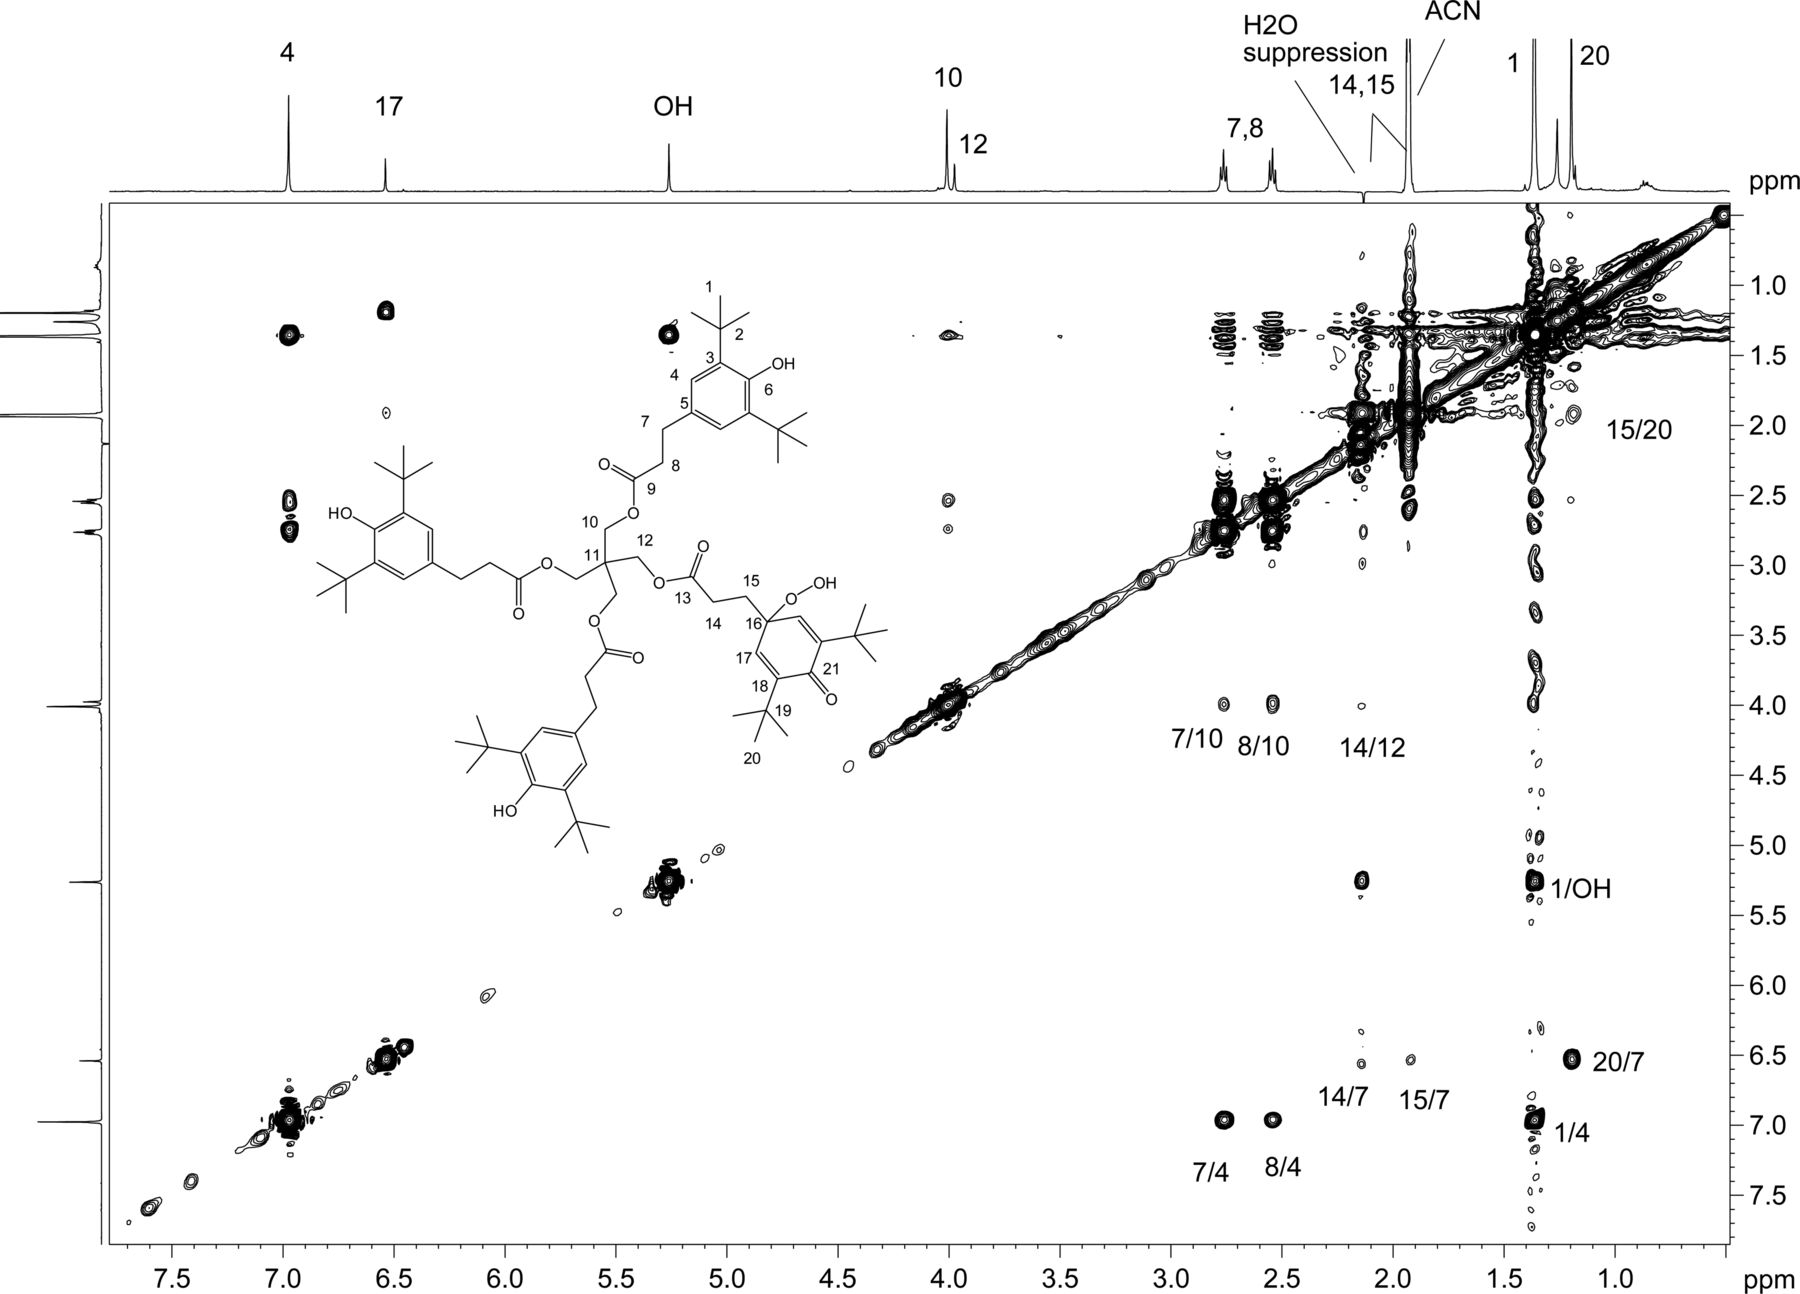
2D 1H,1H ROESY spectrum with presaturation of unknown C acquired in acetonitrile-d3 on a NMR spectrometer operating at 600.2 MHz, equipped with a 1.7mm CP TCI Z gradient probe. A 500 ms mixing time was used. Key 1H,1H ROESY cross peaks are shown on the spectrum consistent with the proposed structure. A total of 64 transients per Free Induction Decay (FID) were collected. The 1D 1H NMR spectrum of unknown C (64 scans) acquired at 600.2 MHz, with a 1.7mm CP TCI Z gradient probe is projected on the axis. Proton assignments are shown on the spectrum. Methylene protons H14 and H15 are overlapped with water and acetonitrile-d3, respectively.
2D homonuclear-correlated NMR spectra were acquired to associate protons within the major and minor spin systems. The major spin system showed 2D correlations consistent with the Irganox 1010 structure. A separate set of 2D correlations was observed for the minor spin system. Methylene protons H14 and H15 from the minor spin system overlapped with water and acetonitrile, respectively, and hence were masked in the 1D spectrum. These proton signals became visible as a result of through-bond coupling interactions between H14 and H15 that were clearly observed in the WET-1H,1H-gCOSY and WET-1H,1H-gTOCSY experiments, unequivocally establishing their presence and close structural proximity. Through-space correlations in the 1H,1H-presat-ROESY spectrum between H14 and H12 and between H17 and H15/H20 defined the minor spin system in the molecule (Figure 11). The minor component showed ROESY correlations of the methylene protons similar to those observed for Irganox 1010, which suggested a similar spatial orientation. Large differences between the major and minor spin systems were observed for chemical shifts in the aromatic region where the aromatic protons for H4 at 6.97 ppm (major) are shifted upfield to 6.53 ppm for H17 (minor), which is consistent with a transition from aromatic to olefinic bond character.
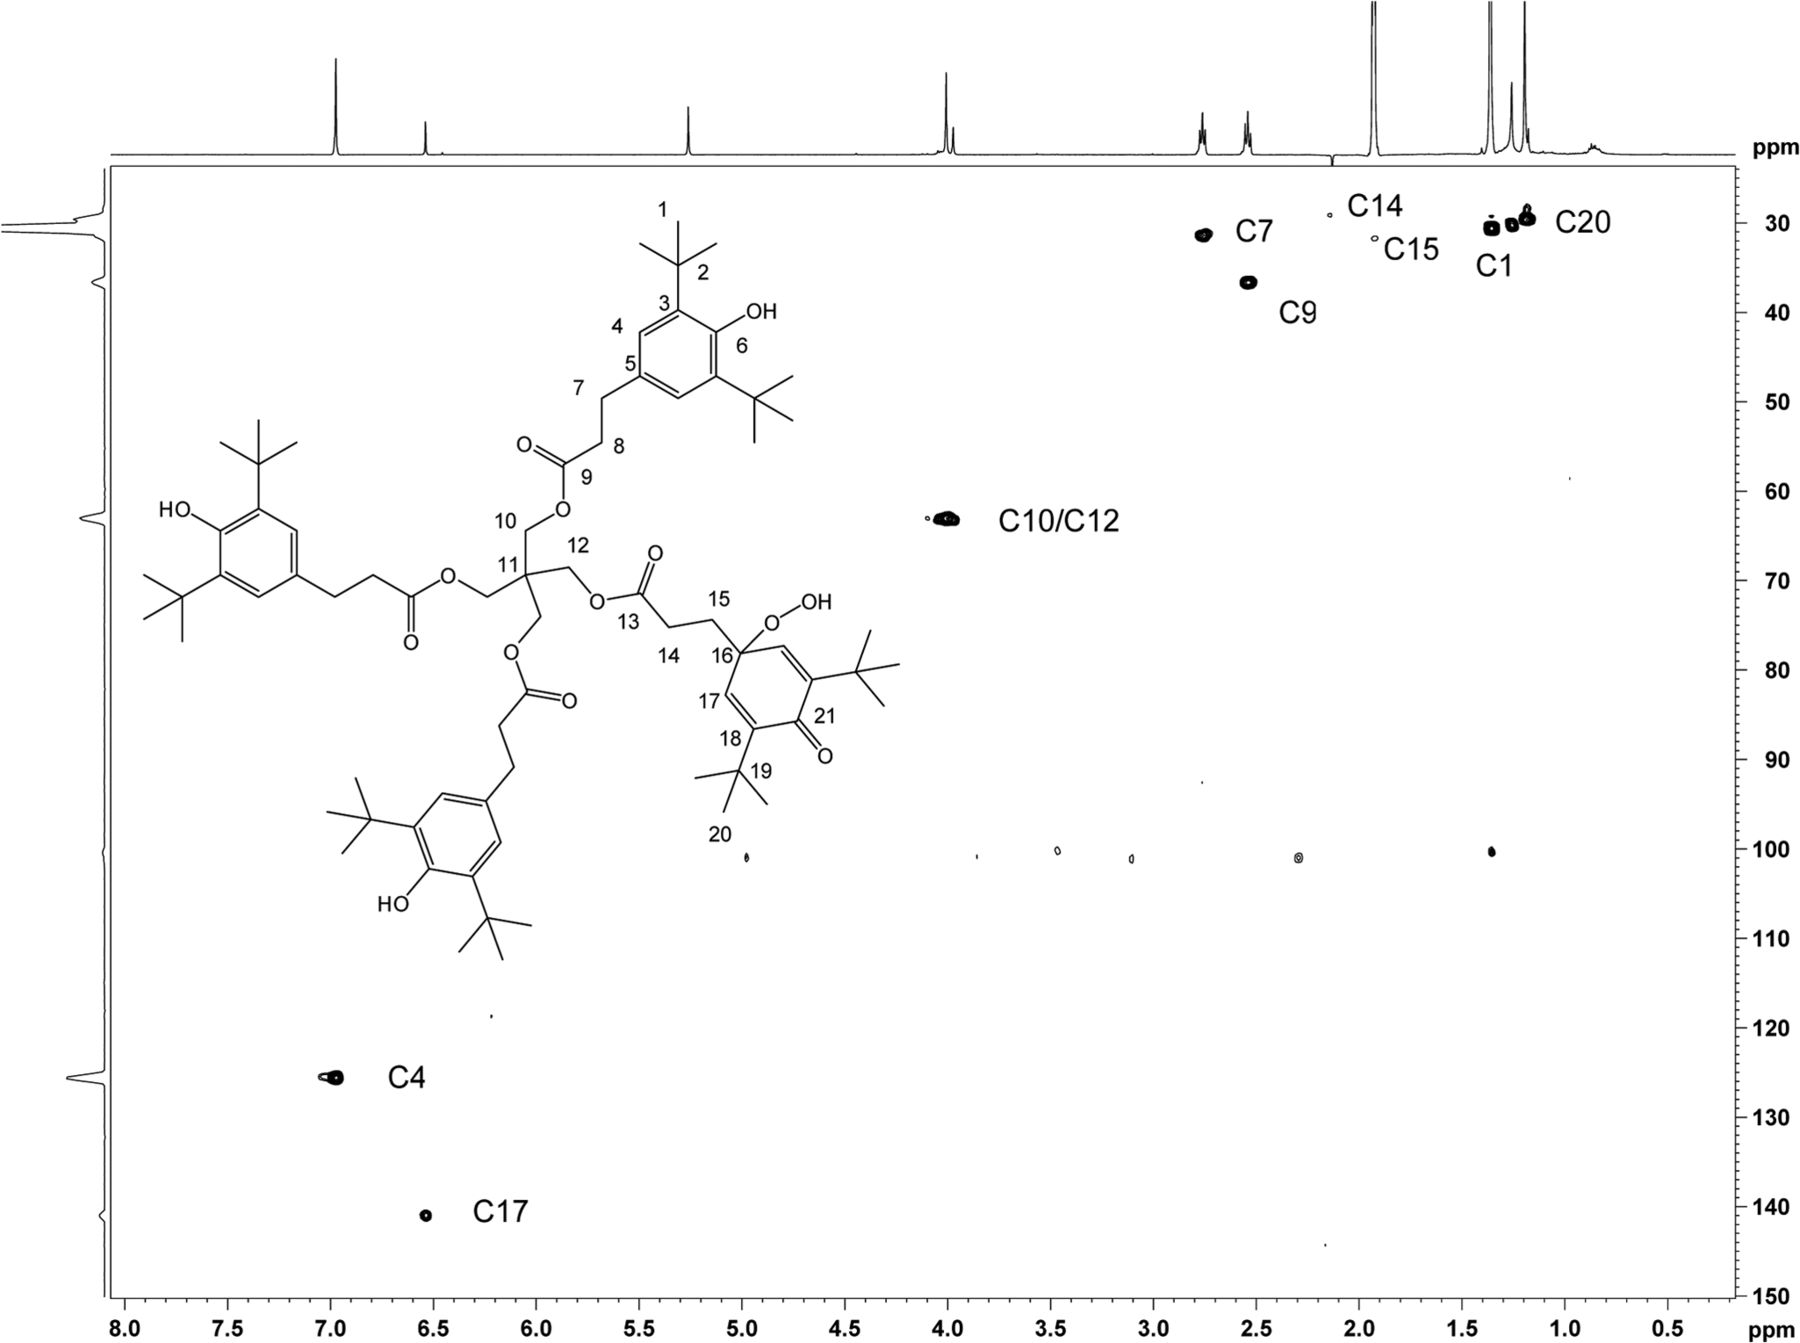
Heteronuclear 1H,13C 2D experiments gHSQC (Figure 12), and gHMBC (Figure 13) were carried out, which enabled full carbon assignment. The 1H,13C heteronuclear experiments were critical in identifying through-bond connectivity that defines the carbon skeleton. The major set of resonances showed gHSQC C-H connectivity consistent with the Irganox 1010 scaffold. Heteronuclear gHMBC data (Figure 13) showed correlations between H4 and C6/C2 as well as between OH and C3/C6 for the major component of unknown C. These results were also consistent with correlations for the Irganox 1010 structure. For the minor component of the unknown C, proton H17 appears in a spectral region consistent with olefinic character and correlates with C21 in the gHMBC spectrum. The downfield chemical shift of C21 (187.2 ppm) is consistent with a carbonyl carbon resonance, hence the H17/C21 correlation supports a cyclohexadieneone structure. Key connectivity between H10 and C11 and between H12 and C11 link the major and minor spin systems at the central quaternary carbon C11, confirming a single molecular structure. The 1H and 13C chemical shift assignments of unknown C are given in Table IV.

2D 1H,13C-HSQC spectrum of unknown C acquired in acetonitrile-d3 on a NMR spectrometer, operating at 600.2 MHz for 1H and 150.9 MHz for 13C, and equipped with a 1.7mm CP TCI Z gradient probe. A total of 96 transients per FID were collected. Assignments of the C-H carbons are shown.
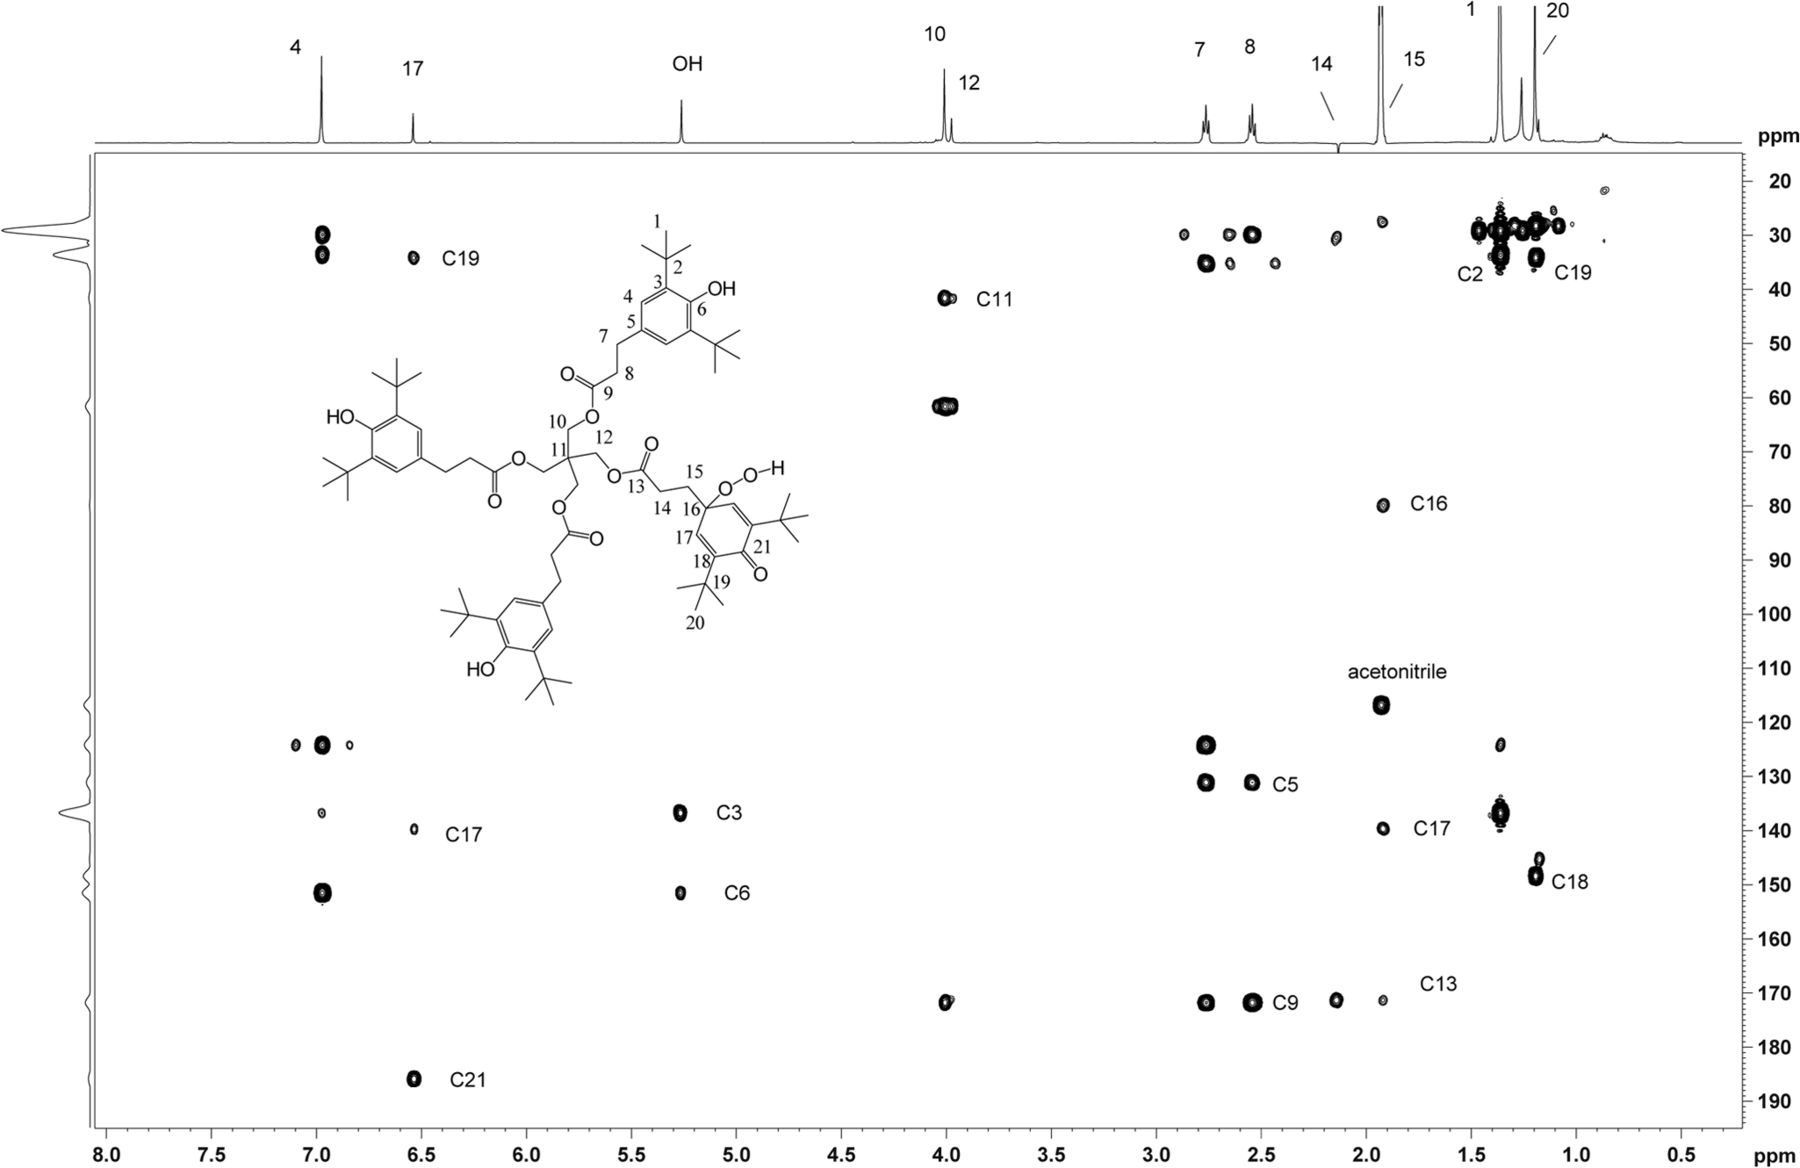
2D 1H,13C-HMBC spectrum of unknown C acquired in acetonitrile-d3 on a NMR spectrometer, operating at 600.2 MHz for 1H and 150.9 MHz for 13C, and equipped with a 1.7mm CP TCI Z gradient probe. Assignments of the quaternary carbons and carbonyl carbons are shown consistent with the proposed structure. A total of 384 transients per FID were collected.
1H and 13C NMR Assignments for Unknown C
Because chemical shifts for the major component of the unknown C were identical with Irganox 1010, the major parts of the molecule showed no evidence of being affected by the addition of two oxygens. The minor structural component, however, does present an opportunity for incorporation of a peroxide moiety in the position para to the dieneone carbonyl C21, yielding a 2,6-di-tert-butyl 4-hydroperoxy-cyclohexa-2,5-dienone moiety. 1H,13C gHMBC correlations between methylene protons H15 and carbon C16 establish connectivity consistent with this proposed structure. In addition, the chemical shift for C16 at 81.3 ppm shows loss of carbon aromaticity but is consistent with the addition of peroxide functionality. The proton on the peroxide, however, was not observed in the NMR spectrum, most likely due to rapid exchange with water. The ability to observe the hydroxyl proton (OH) on the major spin system and Irganox 1010 may be attributed to the fact that this proton is protected from rapid solvent exchange by the adjacent bulky t-butyl groups.
Overall, the NMR data are consistent with the proposed structure benzenepropanoic acid, 3,5-bis(1,1-dimethylethyl)-4-hydroxy-, 1,1'-[2-[[3-[3,5-bis(1,1-dimethylethyl)-1-hydroperoxy-4-oxo-2,5-cyclohexadien-1-yl]-1-oxopropoxy]methyl]-2-[[3-[3,5-bis(1,1-dimethylethyl)-4-hydroxyphenyl]-1-oxopropoxy]methyl]-1,3-propanediyl] ester (CAS #1010699-03-2), which is known in the scientific literature (25, 26):
Note that the possibility for formation of peroxycyclohexadienones with Irganox 1010 had previously been proposed based upon mass spectrometry studies (27), suggesting that this structure is consistent with the expected reaction chemistry of Irganox 1010. The unambiguous structural analysis of this molecule is significant because if it were found to exist as a drug product leachable then it could have patient safety implications that should be thoroughly assessed by a toxicologist.
It should be noted that proton integrations of the NMR spin systems were compromised due to uneven excitation of the spectral bandwidth during solvent suppression, hence accurate assessment of the number of protons was not possible in this study. This integral uncertainty was further compounded by the potential for a trace amount of Irganox 1010 carry-over in the chromatographically isolated sample of unknown C. Nonetheless the presence of a dieneone and oxidation of a single arm of the molecule was unequivocally established and full structure elucidation was achieved using a combination of LC/MS, SPE-LC/NMR, and cryoprobe NMR technologies.
Conclusions
This work has demonstrated that it is possible to develop an optimized SPE-LC/NMR platform capable of structural analysis application to the significant chemical diversity represented by organic extractables associated with pharmaceutical packaging components and materials of construction. NMR was also shown to complement LC/MS for the structural analysis of organic extractables. It is clear that the identification categories and criteria proposed by PQRI (2, 4), which are based on mass spectrometry, should be modified to include NMR and LC/NMR.
Conflict of Interest Declaration
The authors declare that they have no competing interests.
Acknowledgements
The authors wish to acknowledge the member companies and Secretariat of the International Pharmaceutical Aerosol Consortium on Regulation and Science, the Product Quality Research Institute (PQRI) (including all of its present and past member organizations, staff and other participants), the members of the PQRI Leachables and Extractables Working Group, the members of the PQRI Parenteral and Ophthalmic Drug Products Working Group, and Boehringer Ingelheim Pharmaceuticals, Inc.
- © PDA, Inc. 2013


