
Abstract
The Parenteral Drug Association conducted an anonymous global survey of quality culture in the pharmaceutical industry to determine whether there is a relationship between certain quality behaviors and certain quality attributes, and whether these quality attributes could be used as surrogates (or proxy variables) to assess quality culture. Other studies have shown that an unhealthy quality culture is a root cause of many quality or compliance issues seen by sites and organizations. Statistical analysis of survey data suggests that certain attributes are driving good behaviors, and the demographic data suggests that this relationship holds irrespective of the geographic location of the site. Executive survey respondents had a more optimistic view of the current state of quality culture than survey respondents at large, with cross-functional vision showing the biggest gap (P-value = 0.07, F-Test). The top five quality attributes that can serve as surrogates for quality culture were (1) Management communication that quality is everyone's responsibility, (2) Site has formal quality improvement objectives and targets, (3) Clear performance criteria for feedback and coaching, (4) Quality topics included in at least half of all-hands meetings, and (5) Collecting error prevention metrics. These identified mature quality attributes are related to management responsibility, and continual improvement of the pharmaceutical quality system sections of ICH Q10, and therefore may be amenable to be incorporated in audit programs or in regulatory inspections. Additional research and discussion is required to build a coherent approach, which the pharmaceutical industry and regulators can adopt.
Introduction
The U.S. Food and Drug Administration (FDA) 2012 Safety and Innovation Act has given the FDA new authority to collect data and information prior to or in lieu of on-site inspections. The FDA intends to use this new authority to collect product and/or site-specific data to calculate quality metrics. Quality metrics will be used to gauge the good manufacturing practice (GMP) status of sites for risk-based inspection scheduling and to help identify and prevent drug shortages. Performance and quality metrics are widely used management and continuous improvement tools in the pharmaceutical industry. However, there is increasing recognition that, in addition to metrics, quality culture plays a critical and complimentary role because it affects the decisions that contribute to the data that are used for calculating the metrics. A good quality culture is often described as one that puts the interest and safety of patients and consumers above all else and where people do what is right versus what is good enough.
Further, a good quality culture would manifest itself as all conscious trade-offs are in favor of the customer, all employees feels they have a role and stake in quality, and all employees are accountable for assuring quality of their companies' products. Furthermore, companies that have quality- or compliance-related issues would be well advised to look to their culture as a root cause of their problems. Srinivasan and Kurey define quality culture as “an environment in which employees not only follow quality guidelines but also consistently see others taking quality-focused actions, hear others talking about quality, and feel quality all around them” (1). It is this definition that will be used as the basis of this report. Furthermore, they see quality culture as “a culture in which employees ‘live’ quality … as a personal value rather than simply obeying an edict from on high”. These “quality-focused actions” could be interpreted as behaviors, so if one can measure and monitor behaviors then perhaps it is possible to imply a certain strength of a quality culture. Every organization has its own culture, and many companies strive to build a strong culture across their entire supply chain. Building a strong quality culture and measuring progress and maturity of that culture across the supply chains, which increasingly are a result of mergers and acquisitions, cross geographies, and have in-house and contract manufacturing, can be extremely challenging. In fact, numerous articles have been published that discuss how to embed and create a quality culture, but very few articles give insight into how to quantitatively measure quality culture. The PDA Quality Metrics Task Force has hypothesized that there are certain behaviors that correlate with a strong quality culture, and that these behaviors are driven by maturity attributes that can be measured and quantified. If this hypothesis is true, measuring the somewhat more quantifiable maturity attributes allows one to make inferences about the strength of an organization's quality culture. This paper describes the analysis conducted on the data and presents results and conclusions of these analyses.
Definitions
Before moving on to the analyses and discussions around them, it is important to ensure that the definitions of the following key terms are well understood by the reader.
Culture: The attitudes and behavior characteristic of a particular social group.
Aggregate behavioral score: Section B of the PDA Quality Culture Metrics Survey contains questions asking whether participants observed specific behaviors in their organization or site in such categories as communication & transparency, commitment & engagement, technical excellence, and standardization of requirements. The aggregate behavioral score is the sum of all the “yes” responses to questions in Section B. More “yes” responses equals a higher aggregate behavioral score, reflecting more frequently observed behaviors supporting a positive quality culture at the site or organization.
Mature quality attribute: Objective characteristics of a quality system that can be observed or verified upon inspection or internal audit and that have a positive relationship with quality culture behaviors.
Aggregate maturity score: Section C of the PDA Quality Culture Metrics Survey contains questions asking whether an organization or site has specific formal programs in such areas as preventive maintenance, environmental health & safety, risk management, human error prevention, and training or continuous improvement. The aggregate maturity score is the sum of all of the “yes” responses to questions in Section C. More “yes” responses equals a higher aggregate maturity score reflecting more formal programs or activities in place.
Senior management: Person(s) who direct and control a company or site at the highest levels with the authority and responsibility to mobilize resources within the company or site (ICH Q10 based in part on ISO 9000:2005).
Survery Analyses and Methodology
In mid-2014, the PDA launched the Quality Culture Survey to test the hypothesis that certain observed behaviors and certain maturity attributes are correlated. Two surveys were sent out, one directly to targeted executives and the other to non-executives. Both surveys were designed to be anonymous and were similar in the format and questions asked. The biggest exception to this was that the executives were asked to answer the survey with a consideration to the overall organization, whereas the non-executive survey respondents were asked to answer the questions with consideration to their site only. The survey was divided into the following three sections:
Demographic Section: This section collected important information regarding roles, site location and size, and types of products manufactured.
Quality Culture Behavior (a.k.a. quality culture attributes): Questions in this section were designed to collect information on behaviors observed at the site or organization of the respondent.
Mature Quality Attributes (a.k.a. quality system maturity): This section collected information on what programs and system attributes were implemented at site or organization of the respondent.
Both surveys are available from the PDA bookstore at https://store.pda.org.
In December 2014, survey data analysis was presented at the 2014 PDA Pharmaceutical Quality Metrics Conference, in Washington, DC. During the conference, the analysis was reviewed at simultaneous breakout sessions, and the attendees were asked to participate in a facilitated discussion on the survey results. At that time the attendees had an opportunity to add any additional behaviors and quality attributes for consideration, and each attendee was asked to electronically vote for the top five he or she believed were most important. The group breakout sessions helped validate the survey analysis and refine our model with expert review.
The analysis methodology used for the survey results is presented in Figure 1.
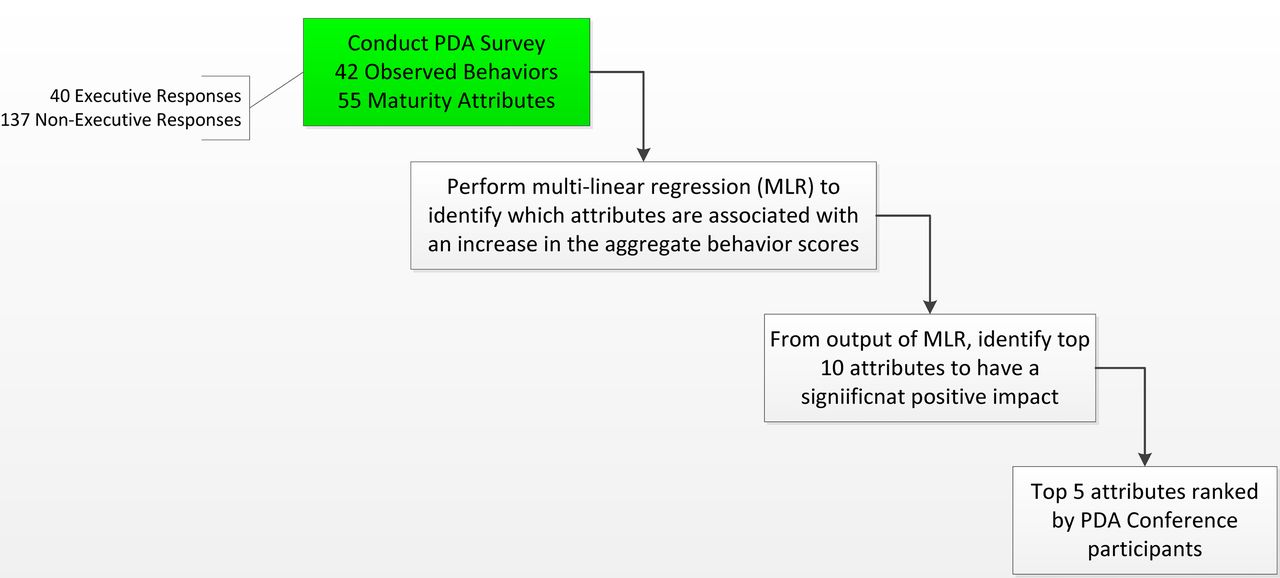
Flow of analysis methodology.
From the survey, multi-linear regression (MLR) was conducted to identify which maturity attributes are associated with an increase in the aggregate observed behavior score. The MLR controlled for each demographic characteristic in the survey and estimated the effect that each maturity attribute had on each respondent's the aggregate behavior score. The team used this MLR model to identify 10 maturity attributes that had a positive estimated impact on a respondent's behavior score and were significant at the 95% confidence level. These 10 attributes were discussed at the PDA conference, where five were voted as “most important” via polling of the conference attendees. In conducting this analysis, the survey data did not violate any of the major assumptions associated with regression models, namely, linearity, constant variance, independence, and multicollinearity.
Survery Results and Analysis
Analysis was conducted on responses from 325 respondents, of which 136 completed only the demographic section (Section A), 52 completed only Sections A and B, and 137 respondents completed the entire survey. In addition to the 325, another 93 respondents identified their job function as either “N/A” or “consultant” and were excluded from the analysis.
For the executive survey, 100 individuals were invited to take the survey, of which 40 completed the entire survey.
Survey Demographics
The responses to the six demographic questions from the non-executive survey are presented in Figures 2 through 7.
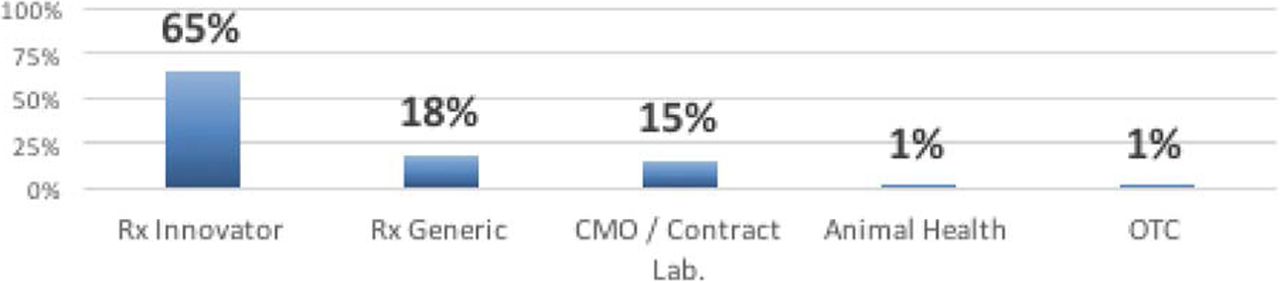
Primary site business.
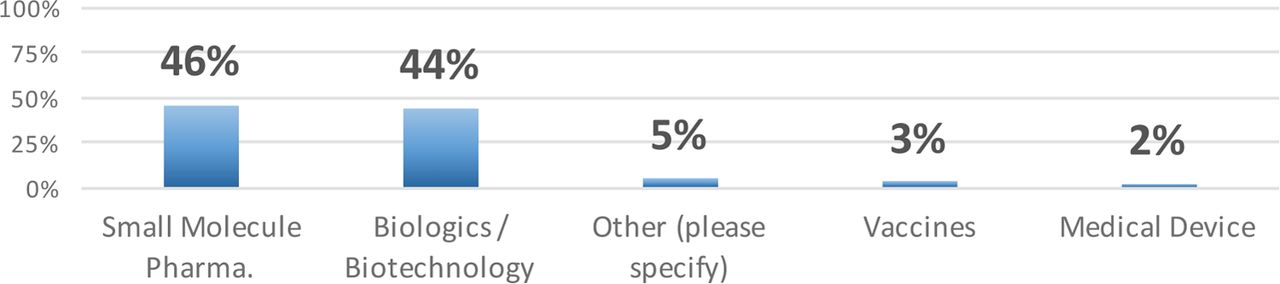
Product class.

Product type. DP, drug product; API, active pharmaceutical ingredient.
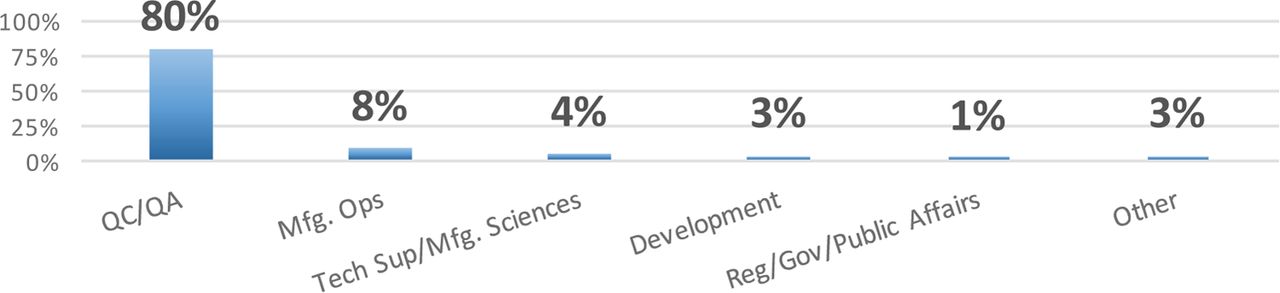
Respondent's organization. QC/QA, quality control/quality assurance.
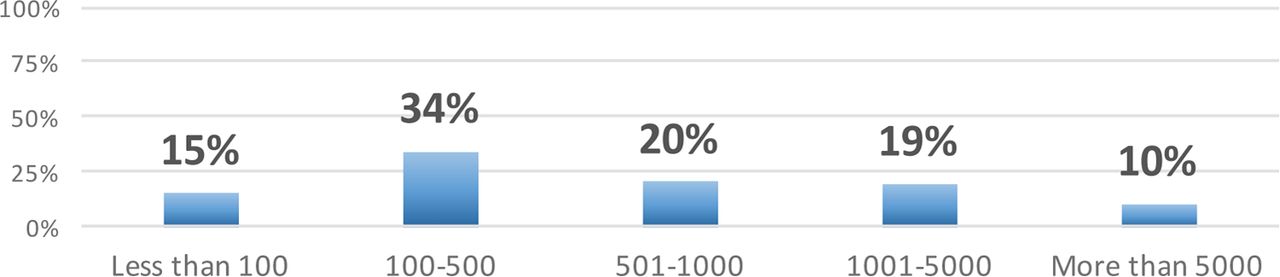
Number of employees at the site.
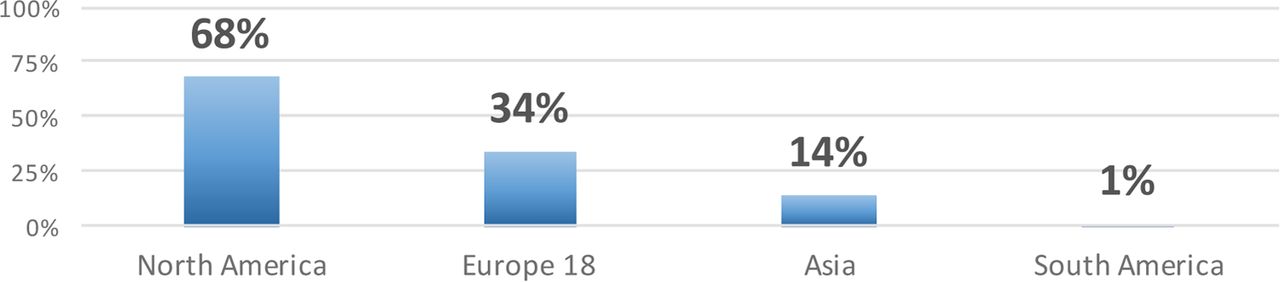
Location of site.
As expected, the vast majority of respondents (80 %) was from quality assurance/quality control (QA/AC) units within their organization. This is because the survey was initially sent to PDA members who selected quality as their primary function. Overall, the responses indicate participation from personnel representing a wide variety of company types and sizes.
The Relationship between Mature Quality Attributes and Observed Behaviors
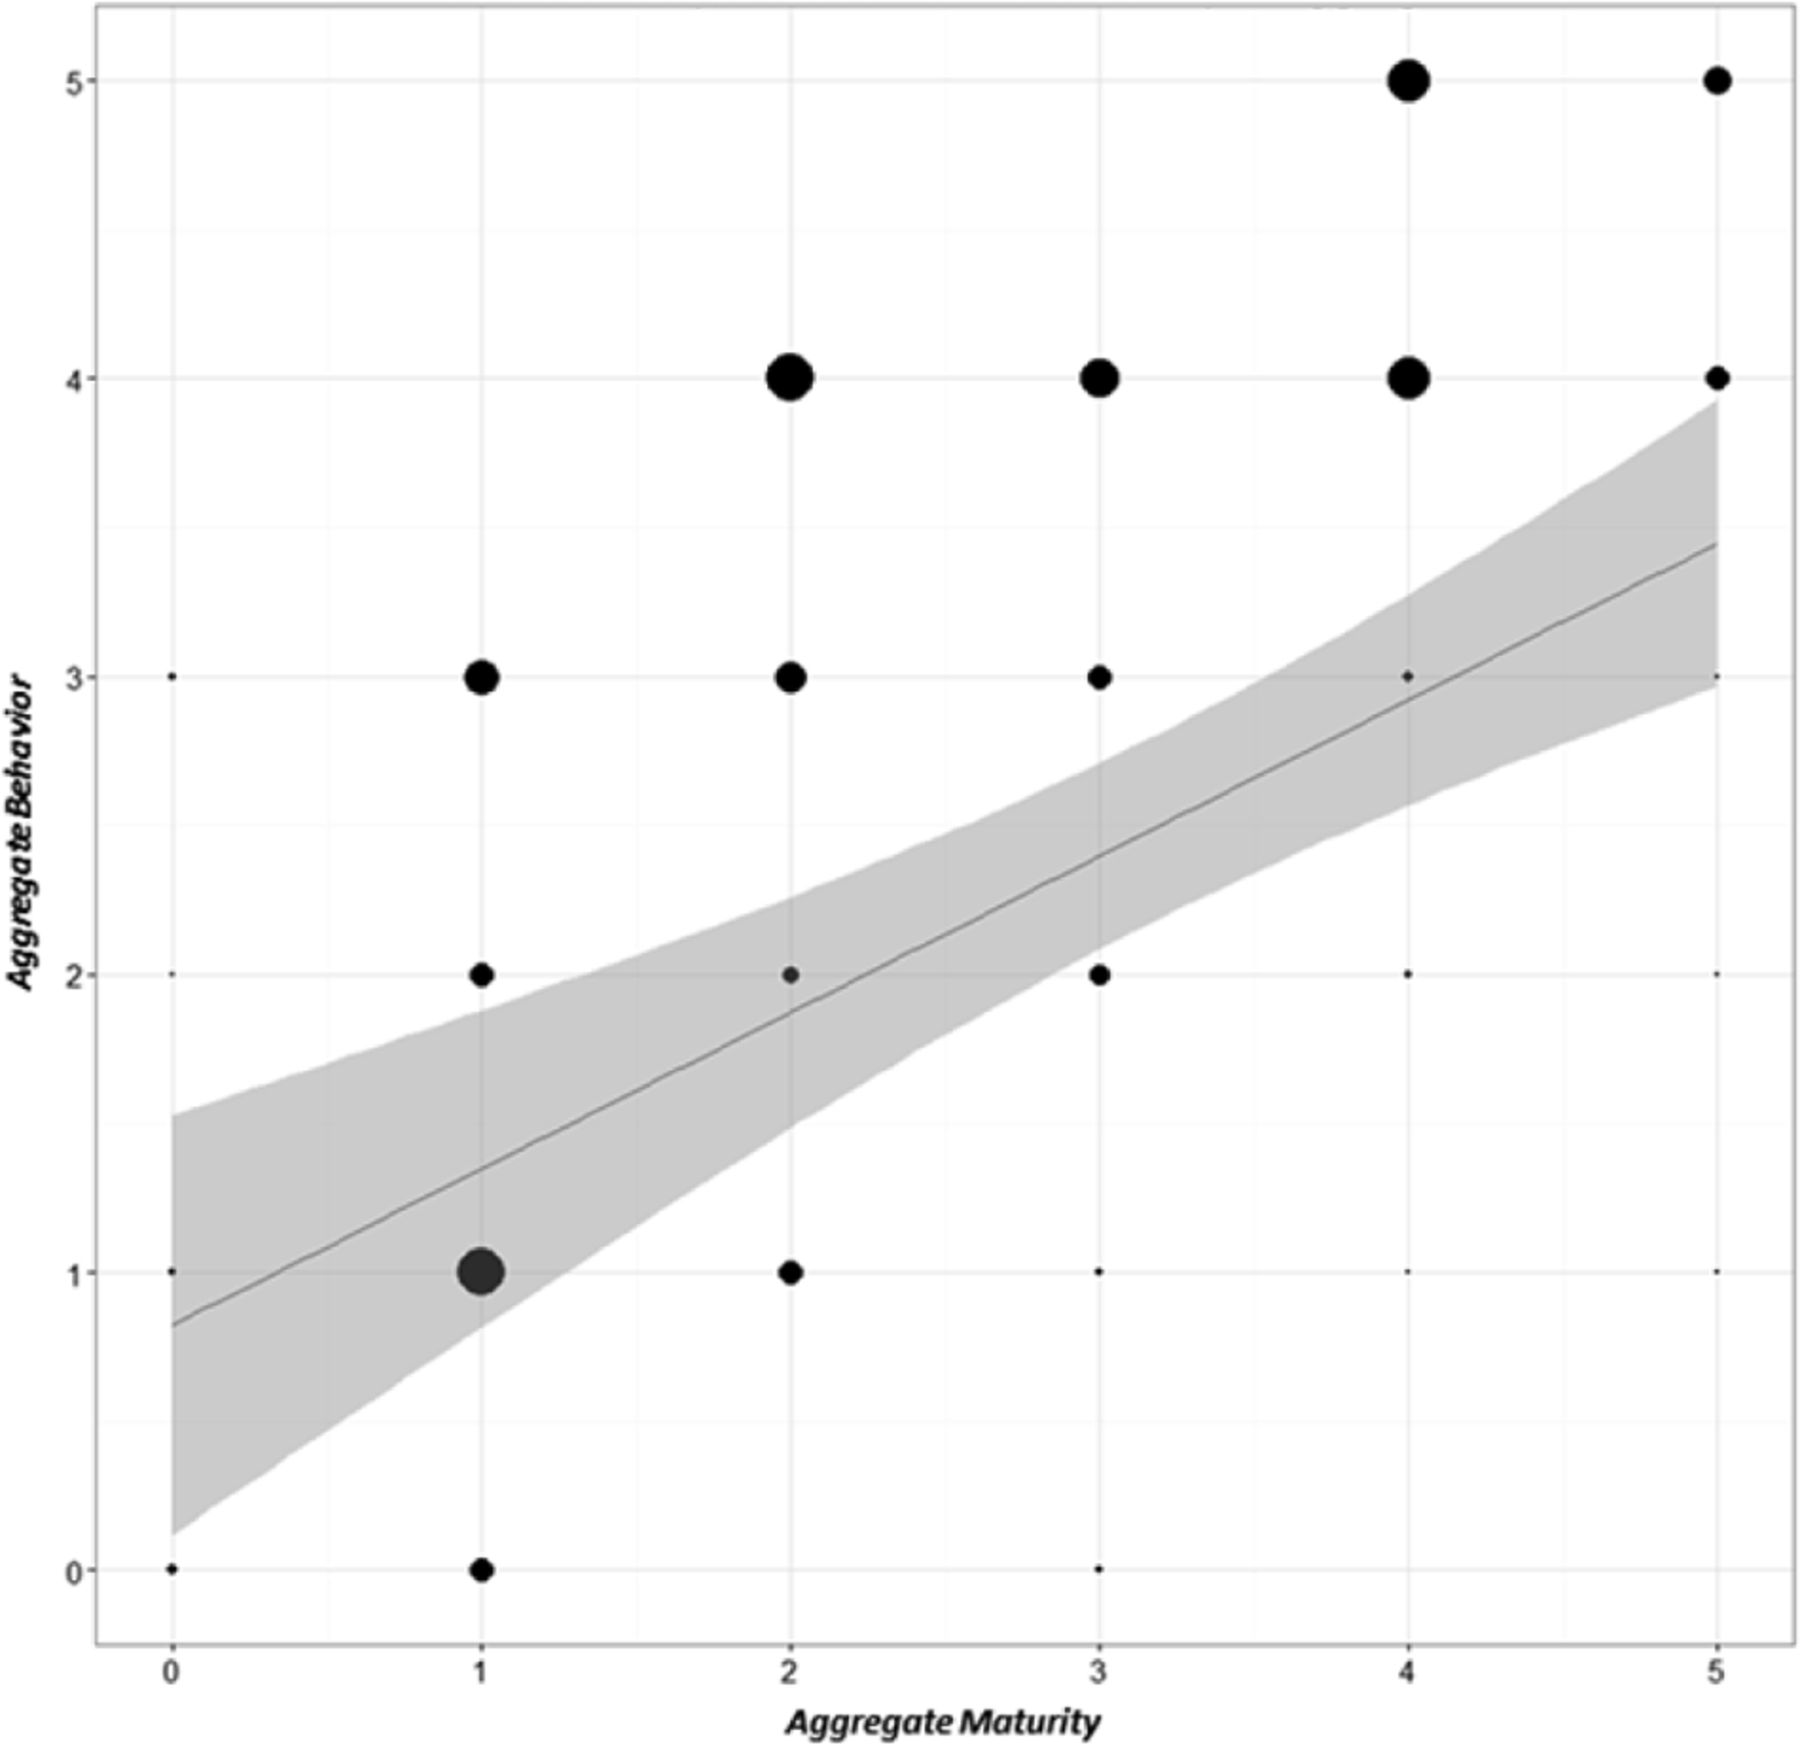
The next analysis was to determine if a relationship exists between the aggregate behavior score and the aggregate maturity score. Figure 8 shows the scatter plot created as part of this analysis. The aggregate behavior score is represented on the vertical axis, and the aggregate maturity score is represented on the horizontal axis. The general upward trend from the lower left to the upper right suggests a positive relationship between the two sets of scores, that is, a higher maturity of the quality systems is accompanied with a higher behavioral score. High scores for both behavior and maturity will arguably indicate a higher/stronger quality culture. The strength (or boldness) of each point on the plot indicates the number of respondents who recorded a given pair of behavioral and maturity scores.

Correlation between aggregate maturity score and aggregate behavior score.
R2 is a statistical measure scaled from 0 to 1 that represents the degree to which data fit a statistical model. The R2 value for the scatter plot in Figure 8 is 0.3378. This means that 33.78% of the observed variation can be explained by the relationship (blue line) as seen in Figure 8. For a behavioral study of this nature, Cohen (2) refers to an R2 of 0.25 as a large effect size. A relationship of this magnitude is of practical importance and is worth examining in detail because this is a simple bivariate linear model without any control variables. Thus, this analysis indicates both a statistically significant and a practically important relationship between the two scores.
The next analysis was to determine how the executives and non-executives viewed themselves with regards to maturity level. Figure 9 reports this information. It should be no surprise that executives have a rosier view than non-executives. A similar finding was also observed in the survey conducted by the American Society of Quality (ASQ) and Forbes (3), whereby “nearly three out of five survey respondents (59%) say their organization exhibits ‘a comprehensive, group-wide culture of quality’. But there is often a disconnect—while 75% of senior or C-suite titles believe this, responses drop to less than half among those with quality job titles. In other words, the further from the C-suite, the less favorable the view of the culture of quality (a tendency that remains relatively consistent throughout the survey results).”

Perceived quality culture maturity level by executives and non-executives.
In-Depth Analysis
To further our understanding, the survey data, along with the data from the conference, was used to test the following hypotheses:
Hypothesis 1: There is no difference in the job functions and regional make-up between those who responded to the survey, the 2014 PDA Conference attendees, and the PDA membership.
Hypothesis 2: There is no statistical difference in the aggregate behavior score and maturity score when considering geographical locations of the sites.
Hypothesis 3: From a geographic perspective, there is no difference when comparing respondents who completed the survey to those who started the survey but did not complete it.
Hypothesis 4: There is no statistical difference in aggregate behavior score and aggregate maturity score between the executive and non-executive survey respondents.
In addition to these four hypothesis to be tested, a correlation between the top five behaviors (aggregated) and the top five maturity attributes (aggregated) that were identified at the December 2014 conference was estimated. Each analysis will be discussed further below.
Hypothesis 1: There is no difference in the job functions and regional make-up between those who responded to the survey, the 2014 PDA Conference attendees, and the PDA membership.
The objective of this analysis is to determine if the survey respondents are a true representation of the PDA membership and those who attended the 2014 conference.
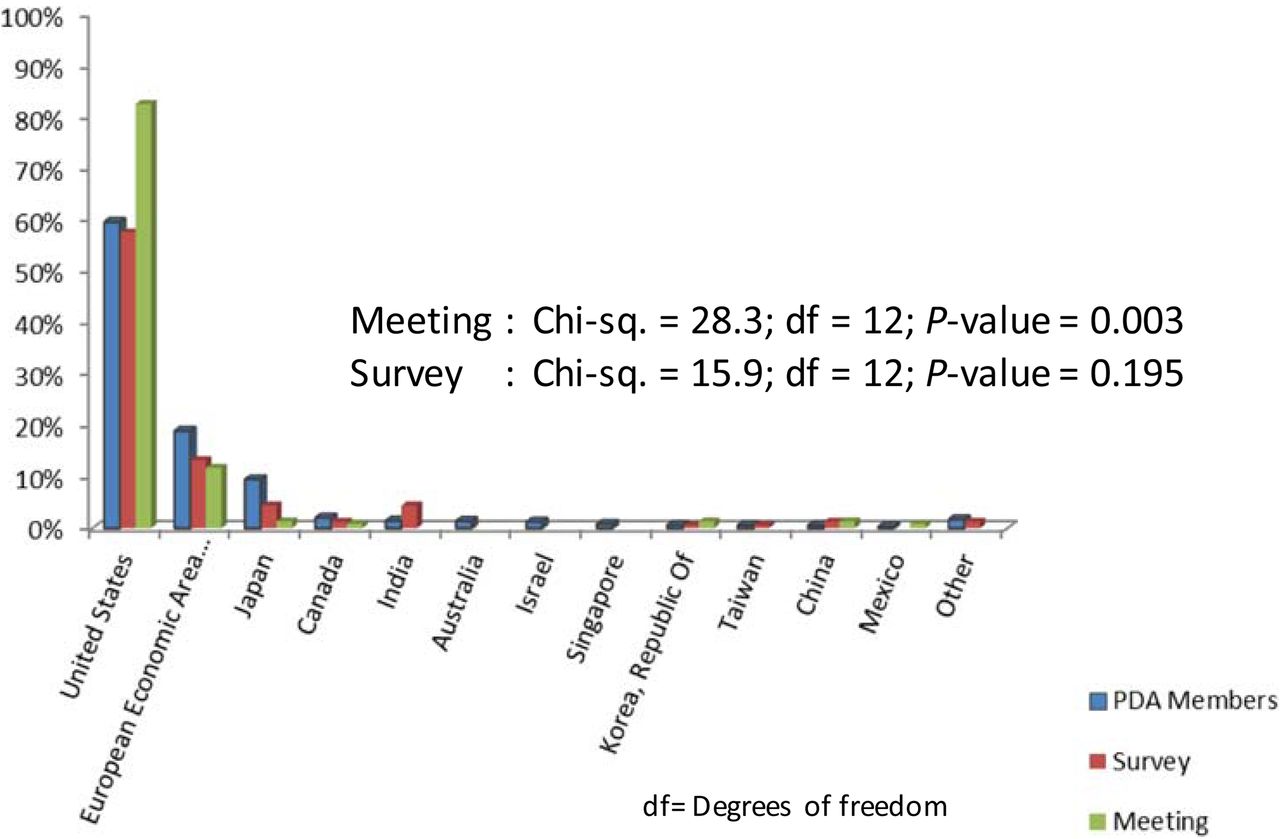
This analysis supports the fact that survey respondents and conference attendees represent the population of PDA membership. This analysis was conducted with respect to the two demographic categories: job function and location. Figure 10 shows the comparison for location, and Figure 11 shows the comparison for job function. A statistical test based on the chi-squared distribution was performed to test the null hypothesis that the proportion of members in each category is the same for the three populations. A P-value less than 0.05 provides evidence against the null hypothesis, that is, a value less than 0.05 provides evidence of a difference among the three populations.

Regional make-up of meeting, survey, and membership.

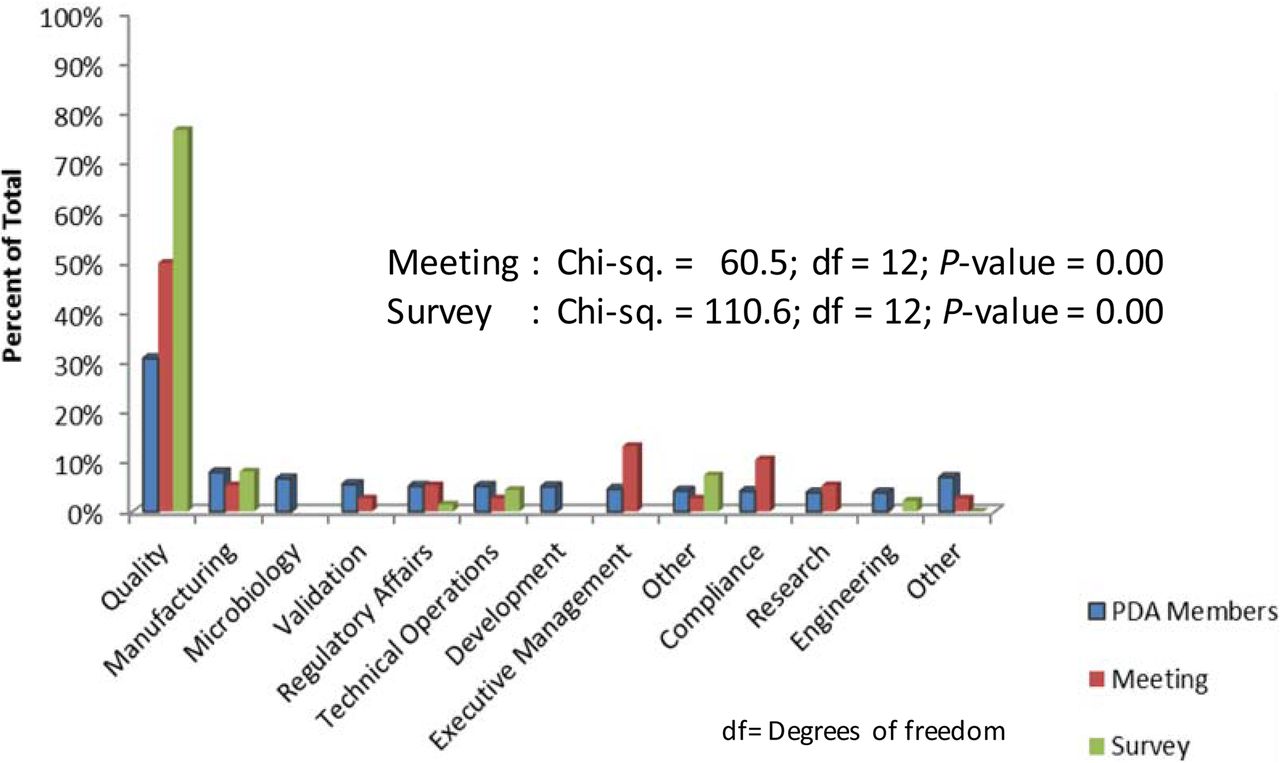
Job function of meeting, survey, and membership.
Here we see that the regional make-up of the conference attendees is statistically different (P-value = 0.003) from the PDA membership. No such evidence of a difference was observed for the survey respondents (P-value = 0.195).
The statistical tests displayed in Figure 10 provide very strong evidence that all three populations are different with respect to job function. Proportionally more survey respondents and conference attendees were from quality-related functions than PDA's membership as a whole. The following could explain this difference:
The survey was initially sent to all PDA members identified as having a quality function.
Collecting and analyzing quality metrics is perceived to be an initiative to be led by the quality unit. Thus, members whose job functions are not in quality did not respond thinking that their quality team members would take the lead.
Hypothesis 2: There is no statistical difference in the aggregate behavior score and maturity score when considering geographical locations of the sites.
This next analysis examined whether there is no statistical difference in aggregate behavior and aggregate maturity as a function of location. The intent is to examine whether one's geographic location has an influence over one's behaviors and the overall maturity of an organization. Results of this analysis are shown in Figure 12, where location is defined as continent.

Maturity and behavior scores shown by continent.
Figure 12 demonstrates that there is no appreciable difference due to geographic location for maturity score (P-value = 0.0893) and behaviors scores (P-value = 0.2674) reported for respondents in Asia, Europe, and North America. Based upon this, it can be concluded that the correlation between behavior and maturity is generally universal. Two additional findings from Figure 12 are that participants from Asia reported less variation than those from North America, and that within North America, there was a large variation in reported scores.
The reason why maturity scores have a greater span than attribute score is that the total number of questions asked (and hence points) was more for the maturity section of the survey than the attribute section of the survey.
Hypothesis 3: From a geographic perspective, there is no difference when comparing respondents who completed the survey to those who started the survey but did not complete it.
The intention of this analysis was to determine if the continent location could explain why some respondents did not complete the survey.
For the non-executive survey the response rate for all 418 respondents was calculated and plotted for each question. These profiles were then further subdivided by continent. The graphical representation of the response rate is displayed in Figure 13.

Response rate by continent.
With the exception of Africa and Australia & New Zealand, the profiles among the other four continents are similar. This suggests that respondents were equally likely to respond to all questions on the survey. The data do not report how subjects responded, or whether they all interpreted the questions in the same manner.
From the analysis for Hypotheses 2 and 3, it can be concluded that
The tight variation seen in Figure 12 for the Asian continent could be artificially driven by a low number of respondents from Asia. More respondents from sites in Asia can help to understand this further.
From Figure 12, there does not seem to be a statistically significant difference in observed behaviors and maturity attributes among sites in different continents.
From Figure 13, there was no difference between the response rate to questions by respondents in different continents, thereby suggesting that the questions and intent of the survey was well understood by all participants.
Hypothesis 4: There is no statistical difference in aggregate behavior score and aggregate maturity score between the executive and non-executive survey respondents.
This analysis investigates whether aggregate maturity scores and aggregate behavior scores differ between the executives and non-executives. For this analysis, a statistical test (an F-test) was used to test the hypothesis. A P-value less than 0.05 provides evidence that the means are not equal. Table I presents the results of the statistical test.
Summary Statistics for Analysis 4
The key finding from this analysis is that there is no evidence that maturity scores differ between executives and non-executives (P-value = 0.952). However, when asked about the behaviors observed, the evidence shows that the average score for non-executives is less than the average for executives (P-value = 0.011).
Statistical comparisons between executives and non-executives were then conducted across all the categories of behavior. Table II presents the P-values associated with these tests. The “Cross-Functional Vision” category had the lowest P-value.
P-values from Testing the Different Behavior Categories for Both Surveys
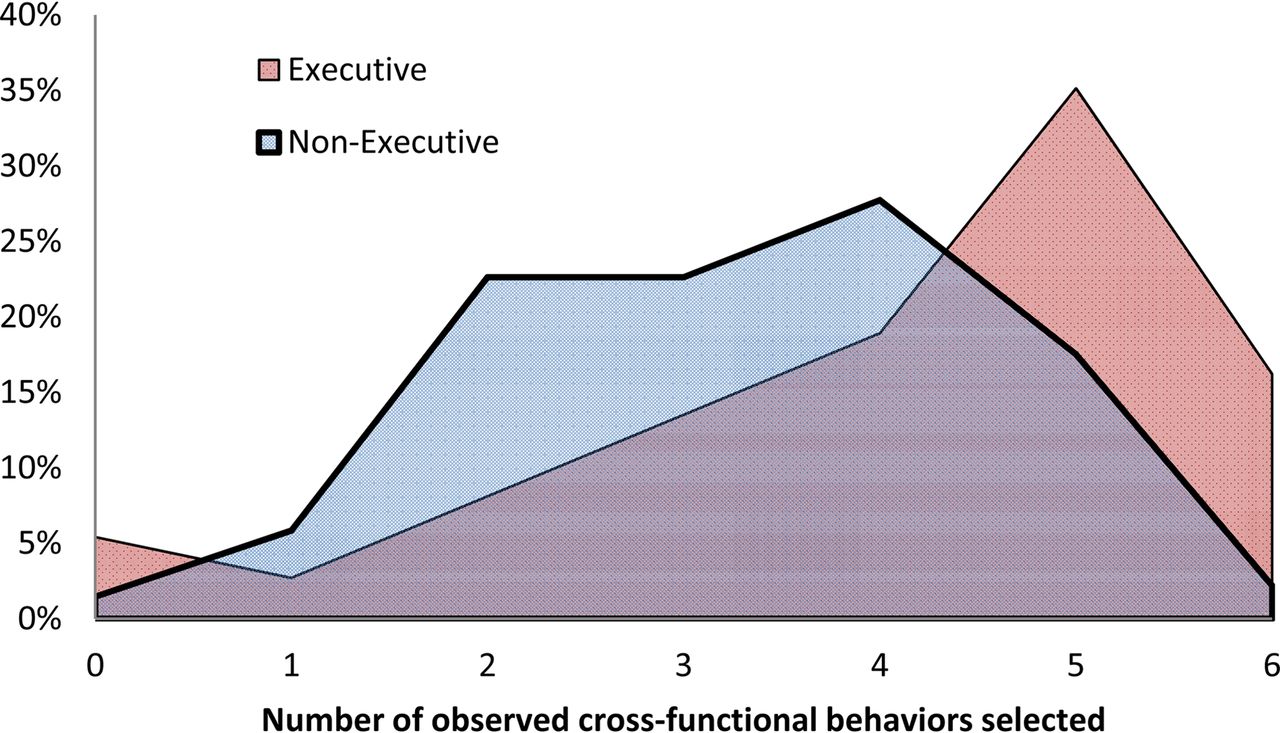
For this category, a density curve was constructed with number of attributes on the horizontal axis and percentage of respondents on the left-side vertical axis. The density curve is shown in Figure 14.

Density curves of the cross-functional vision category per survey.
As the curve illustrates, more executives were selecting a higher number of observed cross-functional behaviors than non-executives.
Correlation between the Top 5 Behaviors (Aggregated) and the Top Five Maturity Attributes (Aggregated)
This final analysis considers only data that were generated from the 2014 Conference. The intent here is to validate the output of the survey data with the actual conference attendees. One of the key activities from the breakout session was for the attendees to select their top five observed behaviors and top five maturity attributes from those identified by the MLR model. The observed behaviors identified were
Leaders who exemplify quality culture behavior
Incentive program supports a strong quality culture
Timely feedback and coaching of job performance
Following clear and transparent governance processes
Adoption of a quality by design (QbD) mindset and approach
Similarly, the top five maturity attributes identified were
Management communication that quality is everyone's responsibility
Site has formal quality improvement objectives and targets
Clear performance criteria for feedback and coaching
Quality topics included in at least half of all-hands meetings
Collecting error prevention metrics
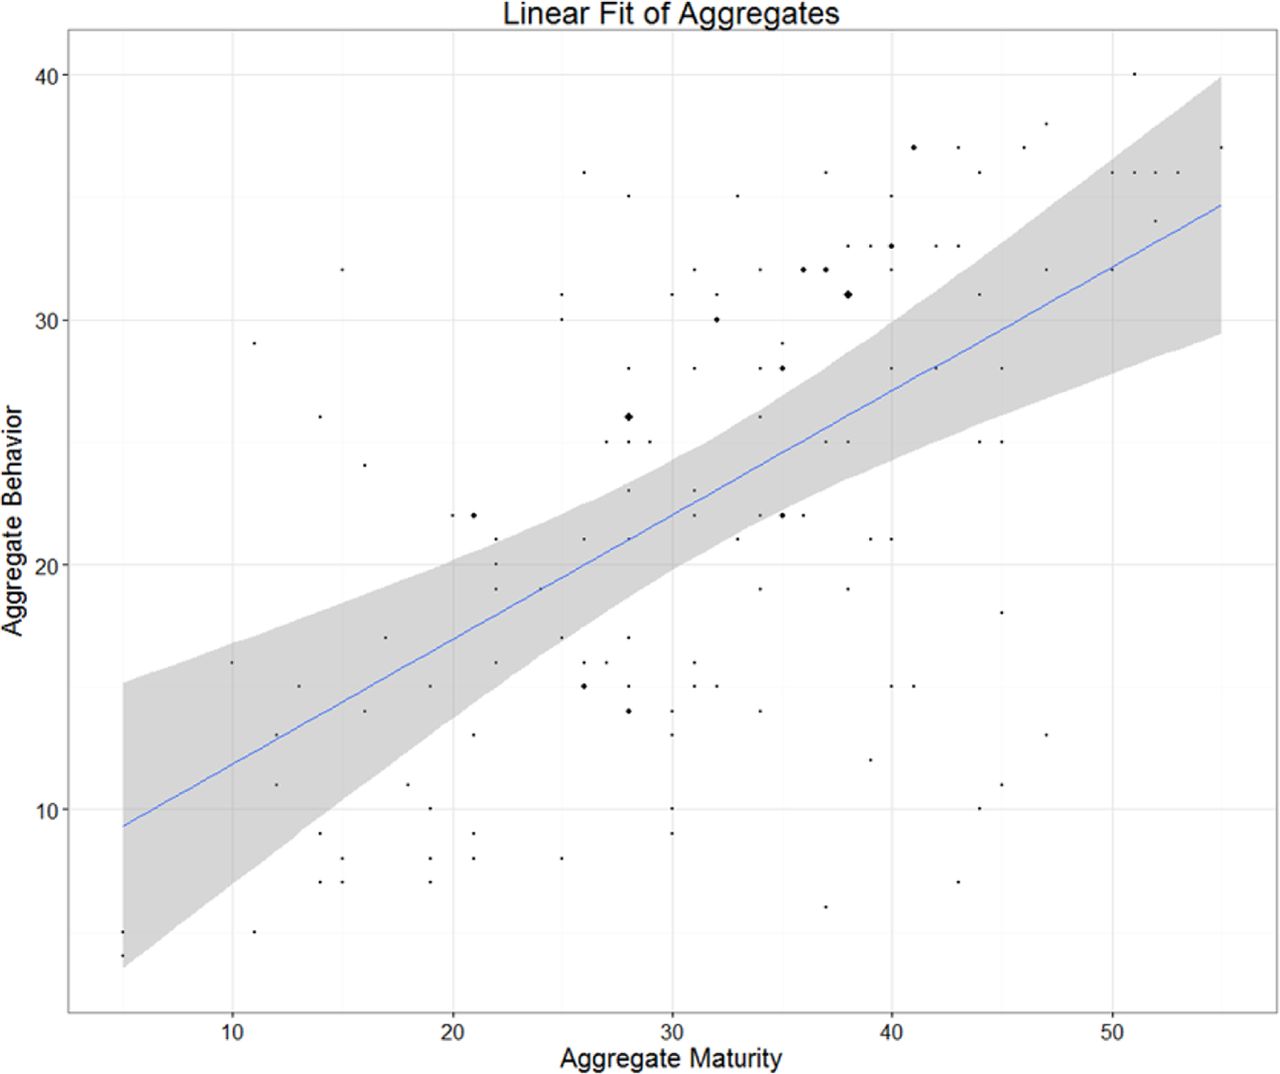
Next, a new aggregate score for behaviors was calculated using only the five behaviors identified, and this was similarly done for the maturity attributes. A scatter plot of these data is shown in Figure 15.
The relationship between the conference top five aggregates.
A positive relationship between aggregate behavior scores and maturity attributes was also seen in data from the conference. For this correlation, the R2 value was 0.36. This result is slightly higher than the value observed in the survey (0.34) and is again viewed as having a large practical impact. Although the heiearchy of attributes selected by the conference attendees was not identical to the heiearchy observed in the survey results, there are similarities between the two sets of results. Overall, one may argue that the results from the survey might be more insightful than the conference, as the survey responses come from an individual's experience and understanding, and as such are not influenced by any external factors. During the breakout sessions, high level of engagement and robust debates were observed that appeared to sway attendees' opinions. This observation is supported by the fact that differences were observed between the results from different breakout rooms. Also during the breakout sessions, the alignment of the survey and conference results provides further confirmation of the validity of the correlation between behavior and maturity.
In their study, Srinivasan and Kurey (1) identifed the following four essentials of quality:
Maintaining a leadership emphasis on quality
Ensuring message credibility
Encouraging peer involvement
Increasing employee ownership and empowerment
Common themes between the PDA's survey and that of Srinivasan and Kurey (1) are that quality is everyone's responsibility and that providing coaching and feedback encourages employee involvement, ownership, and empowerment.
Conclusions and Rcommendations
The PDA Quality Culture Survey was undertaken to determine whether quality culture, which manifests itself in the form of behaviors, could be measured using quality attributes as a proxy measure. The evidence suggests that certain attributes do correlate with good behaviors. Further analyses of demographic data suggest that this relationship holds irrespective of the geographic location of the site. Based on the survey results and feedback from the PDA Quality Metrics Conference attendees, the following attributes were identified to be good indicators of the strength of the quality culture at a site (Table III). Interestingly, several attributes identified are consistent with the requirements of ICH Harmonized Tripartite Guideline, Pharmaceutical Quality System, ICH Q10 (4).
Comparison of the Identified Maturity Attributes to the Requirements of ICH Q10
Based on the survey results and feedback received during the conference, the quality attributes described are not very amenable to meaningful measurement. Therefore it may be more meaningful to evaluate quality culture using a standardized approach. Based on the PDA's current work, we believe an on-site assessment of site mature quality attributes is more powerful in assessing quality culture than a direct quality culture metric. A similar approach to looking at a company's quality system, and hence overall quality culture, is described in the Quality Systems Inspection Techniques (QSIT) handbook published by the Center for Devices and Radiological Health (CDRH) (5). Additional discussion is still required to understand a coherent approach to assessing maturity levels for each of these quality systems maturity attributes identified. This is an initiative that the PDA Quality Metrics Task Force will be working on in 2015.
Footnotes
PDA PAPER DISCLAIMER: The following paper is a special contribution from the Parenteral Drug Association (PDA). This article was internally reviewed by PDA and the task force members and not peer-reviewed by the PDA Journal. Note: This PDA Paper is protected by copyright and unauthorized distribution or use is prohibited.
- © PDA, Inc. 2015


