
Abstract
Using bottom-mounted mixers, particularly those that are magnetically driven, is becoming increasingly common during the mixing process in pharmaceutical and biotechnology manufacturing because of their associated low risk of contamination, ease of use, and ability to accommodate low minimum mixing volumes. Despite these benefits, the impact of bottom-mounted mixers on biologic drug product is not yet fully understood and is scarcely reported. This study evaluated four bottom-mounted mixers to assess their impact on monoclonal antibody formulations. Changes in product quality (size variants, particles, and turbidity) and impact on process performance (sterile filtration) were evaluated after mixing. The results suggested that mixers that are designed to function with no contact between the impeller and the drive unit are the most favorable and gentle to monoclonal antibody molecules. Designs with contact or a narrow clearance tended to shear and grind the protein and resulted in high particle count in the liquid, which would subsequently foul a filter membrane during sterile filtration using a 0.22 μm pore size filter. Despite particle formation, increases in turbidity of the protein solution and protein aggregation/fragmentation were not detected. Further particle analysis indicated particles in the range of 0.2–2 μm are responsible for filter fouling. A small-scale screening model was developed using two types of magnetic stir bars mimicking the presence or absence of contact between the impeller and drive unit in the bottom-mounted mixers. The model is capable of differentiating the sensitivity of monoclonal antibody formulations to bottom-mounted mixers with a small sample size. This study fills an important gap in understanding a critical bioprocess unit operation.
LAY ABSTRACT: Mixing is an important unit operation in drug product manufacturing for compounding (dilution, pooling, homogenization, etc.). The current trend in adopting disposable bottom-mounted mixers has raised concerns about their impact on drug product quality and process performance. However, investigations into the effects of their use for biopharmaceutical products, particularly monoclonal antibody formulations, are rarely published. The purpose of this study is three-fold: (1) to understand the impact of bottom-mounted disposable mixer design on drug product quality and process performance, (2) to identify the mixing mechanism that is most gentle to protein particle formation, (3) to apply the learning to practical mixing operations using bottom-mounted mixers. The outcomes of this study will benefit scientists and engineers who develop biologic product manufacturing process by providing a better understanding of mixing principles and challenges.
- Bottom-mounted mixing
- Monoclonal antibody
- Levitation mixer
- Magnetic mixer
- Disposables
- Filter fouling
- Particle formation
Introduction
Mixing is an important unit operation in biopharmaceutical manufacturing (e.g., cell culture, fermentation, purification, and fill finish) (1). The impact of the mixing operation during fill finish (e.g., dilution, pooling, homogenization, etc.) on product quality is particularly critical because of its close proximity to final product. Thus, a full understanding of the effect of mixing on protein drug product quality and process performance is required, albeit scarcely reported. There are many mixer designs and mechanisms available, but bottom-mounted (or entry) mixers (BMMs) are gaining increasing interest due to their low risk of contamination, ease of use, and ability to accommodate low minimum mixing volume (1, 2).
The most common BMMs are magnetically coupled impellers (MCIs) designed with permanent magnets embedded into the impeller and the drive unit. These magnets form a strong interlocking magnetic field to drive the impeller, which is technologically superior in eliminating contamination due to the absence of shaft seals. MCIs typically use the bearing design (e.g., coupling the impeller's female bearing to the male bearing of the shaft drive unit), which allows an efficient way to manage torque and stresses (Figure 1a & b). Unfortunately, when mixing biopharmaceutical liquid formulations, such as proteins, monoclonal antibodies (mAbs), and so on, this bearing design may cause some concerns because the narrow clearance between the bearings may shear or grind the protein and generate particles. Particle formation will affect not only drug product quality but also the process performance. Mixing (or compounding) is normally followed by a filtration step; thus, particles in the mixed liquid may decrease the filtration rate or even cause filter fouling.

(a) Photograph of a MDB 50 Mavag Mixer impeller and (b) a detailed drawing of the coupled impeller and drive unit.
Our literature search yielded no published reports on this topic. In contrast, there were several studies reported in the area of drug product filling (3⇓–5). In these filling studies, particulates of mAb formulations were observed after filling using rotary piston pumps, which feature a piston moving rotationally and translationally in the pump housing. Like the male and female bearings of MCIs, the clearance/gap between the piston and the cylinder (housing) will be filled with the liquid formulation to serve as lubricant. In general, three theories were hypothesized for data interpretation: shear (3, 4, 6, 7), cavitation (4), and heterogeneous nucleation of protein on foreign particles (5). Tyagi and co-workers (5) demonstrated that microparticles/nanoparticles of foreign stainless steel materials shed from piston-housing grinding could stimulate protein aggregation and particle formation. They further extended their hypothesis to any solid material with which the protein solution is in contact could potentially be a source of foreign particles. It is a reasonable claim, but it is also quite broad. This theory, however, could not be confirmed in the study by Nayak and co-workers (4). Instead, they determined that the majority of particles are proteinaceous, and they attributed their finding to shear/friction in the narrow annular gap (typically ∼10 μm) and to cavitation along the surface of the moving piston due to localized pressure drop. Overall, this phenomenon is more complicated than anticipated and might be caused by a combination of mechanisms that are difficult to differentiate.
Does mixing with bottom-mounted, magnetically coupled impellers bear a resemblance to filling via the piston pump in underlying particle formation mechanisms? The main objective of this study was to answer this question by assessing different impeller designs and mixing mechanisms of four BMMs. Three of the four mixers tested were disposable for single use because many types of these disposable BMMs are commercially available and easy to set up for testing (1, 8). All four mixers were rotating stirrer–based units that can be categorized into two groups: magnetically levitated, which features the impeller levitating above the drive unit with no contact; and magnetically mechanically coupled, which couples the impeller with the drive unit via either male/female shaft bearing or bead bearing (with narrow gap or contacts).
Further in this study, a small-scale mixing model utilizing stir bars with different designs was proposed to enable a preliminary understanding of the sensitivity of protein/mAb formulations to mixing shear with only a small sample size. Five mAb formulations were tested to identify the formulation that was most sensitive to mixing, which was then assessed in the mixers. The characterization of the mixed mAb solutions included size-exclusion high-pressure liquid chromatography (SEC-HPLC) for soluble aggregates, solution turbidity, particle count analysis, and filtration rate.
Materials and Methods
Small-scale and large-scale experiments were performed to mix
solutions of high-concentration sucrose (55% w/w) with green food dye (NEON! Food Color and Egg Dye, McCormick & Company, Inc., Hunt Valley, MD) to determine mixing efficiency of each mixer; and
five formulations of mAbs to determine the impact of mixing on product quality and process performance.
These five mAbs are mAb A1 (25 mg/mL), mAb A2 (55 mg/mL), mAb B (60 mg/mL), mAb C (125 mg/mL), and mAb D (200 mg/mL). All were manufactured at Genentech Inc. (South San Francisco, CA) into formulations containing a stabilizer (e.g., sodium chloride or sucrose) and buffered into a pH ranging from 5.5 to 6.5. All formulations also contained Polysorbate 20.
Mixing Experiments
I. Small-Scale Mixing:
Five 500 mL Erlenmeyer flasks with flat inner bases were rinsed with purified water. Five identical magnetic stir bars (0.95 cm in diameter and 5.1 cm in length) were each coupled with a plastic ring (0.05 cm in depth and 0.2 cm in width) that was adjusted to the center of the stir bar (see Table I).
Mixing Type and Mixer Design
Each mAb formulation (200 mL that had been pre-filtered using a 0.22 μm bottle-top filter; Corning Vacuum Filter, Corning Inc., Lowell, MA) was added to each flask along with a plastic-ring coupled stir bar. The five flasks were labeled and placed on a POLY 15 magnetic multipoint stirrer (Thermo Scientific, Waltham, MA) and stirred for 2 h at 180 rpm. Samples were taken prior to mixing and after mixing for 30, 60, and 120 min. The experiment was repeated using fresh mAb formulations and stir bars without rings.
II. Mixing Experiments in Mixers:
The characteristics of the mixers used in these experiments are shown in Table I, and brief descriptions of each (information provided by the manufacturer) are provided as follows:
Mavag mixer (Mavag AG, Germany); supplied with a 10 L glass container and equipped with a MDB 50 impeller shown in Figure 1. The minimum operating volume is 2.5 L.
LevMixer® (9) (Sartorius Stedim Biotech, Aubagne, France); 50 L disposable bag (30–50 L operating volume) equipped with a levitating impeller, a Palletank® carrier, and a drive unit. The drive unit (outside the bag) applies superconducting technology to levitate the impeller (inside the bag) and lock the impeller at 5 mm above the drive unit (3 mm excluding bag thickness). The system requires charging for 35 min prior to use.
Magnetic Mixer (10) (Sartorius Stedim Biotech, Aubagne, France); 50 L disposable bag (30–50 L operating volume) equipped with a mechanical, magnetically coupled impeller, a Palletank carrier, and a drive unit. The impeller rotates on a low-friction, inert bearing assembly designed to allow high mixing efficiency from 50–3000 L while ensuring low particle shedding.
Mobius Mixer (11) (Millipore Corporation, Billerica, MA); can be configured to hold either a 10 L (1–15 L working volume) or 50 L disposable bag (2–55 L working volume). Both bags are equipped with an off-center impeller, a cylindrical plastic carrier, and an electric drive unit. Levitation and rotation of the impeller are achieved via electronically controlled magnetic fields generated by static coils in the drive unit. This results in a bearingless coupling of the rare-earth magnets encased in the impeller and the magnetic field generated by the motor in the drive unit. The impeller is held in a cup that is welded to the bottom of the bag, and the cup sits on the drive unit. When in use, the impeller is stabilized in a position away from the sides and bottom of cup (about 5 mm above the cup with a gap of about 0.6 mm from the cup wall) via magnetic coupling with the rotor magnet.
III. Mixing Time Experiment:
In each case, a pre-determined volume of the sucrose solution was filled in the bag/container of the mixer. The respective mixing speed was set, and the dye was poured into the solution from a 5 mL glass vial. Mixing was started immediately after adding the dye, and at pre-determined timepoints, samples were taken from the top, the middle, or the bottom part of the mixer using a pipette. Samples were analyzed using a UV spectrophotometer (model 8453 UV-Vis Diode Array System, Agilent Technologies, Santa Clara, CA) to determine the homogeneity of the solution. In addition, the color dye in the mixer was visually assessed to ensure that the dye was fully homogenized.
Formulation Characterizations
I. Viscosity Measurement:
Sample viscosity was measured using a Physica MCR501 controlled stress rheometer (Anton Paar, Ashland, VA) equipped with Rheoplus software. A 75 cm ID cone plate was used for all analyses. The sample (70 μL) was transferred onto the cone plate and subjected to constant shear of 1000/s at 25 °C for 10 s. Ten readings were taken, and an average viscosity was determined.
II. SEC-HPLC:
The quantitation of size variants was determined by size exclusion chromatography (SEC). The analysis utilized a G3000SWXL column, 7.8 mm ID × 30 cm, 5 μm (TOSOH BioScience, King of Prussia, PA) run on a high-performance liquid chromatography (HPLC) system (model 1200, Agilent Technologies). The mobile phase was 0.2 M potassium phosphate and 0.25 M potassium chloride at pH 7.0. The chromatography was run isocratically at a flow rate of 0.5 mL/min for 30 min. The column temperature was maintained at ambient temperature, and the eluent absorbance was monitored at 280 nm. The mAb sample (20 μL) was injected directly without dilution.
III. Turbidity:
Opalescence of each mAb solution (25 mg/mL) was measured in a 1 cm path-length cuvette using a UV spectrophotometer (model 8453, Agilent Technologies). The test samples were blanked against purified water. Absorbance was recorded at 340, 345, 350, 355, and 360 nm, and the average of the absorbance readings was reported as the turbidity of the samples.
IV. Particle Analysis by Light Obscuration:
Light obscuration measurements were performed on a HIAC Royco Liquid Particle Counting System (model 9703, Hach Company, Loveland, CO). The performance of the instrument (model HRLD-150 sensor and model 3000A sampler) was verified using 2 μm size standards (Thermo Scientific, Fremont, CA). For each material, four 0.4 mL samples were sampled at a speed of 10 mL/min; the first aliquot was discarded and the results of the three following aliquots were averaged. All light obscuration measurements (total counts >1.4 μm uncorrected for the dilution factor) were well below the upper count limit of 18,000 particles/mL.
V. Particle Analysis by Coulter Counter:
Coulter counter measurements were performed on a Multisizer 4 instrument (Beckman Coulter, Inc., Fullerton, MA) equipped with a 50 μm aperture. The inside of the aperture tube was filled with formulation buffer (25 mM sodium citrate, 0.9% sodium chloride, pH 6.5). Standards as well as samples were analyzed in Accuvette ST containers. The aperture tube calibration was checked daily with 2 μm latex size standards diluted in filtered buffer. Each protein solution was transferred into a clean Accuvette ST container before measurement, and four 0.3 mL aliquots were analyzed; the first aliquot was discarded and the results of the three following aliquots were averaged.
VI. Filtration:
The experimental setup for filtration is shown in Figure 2. The testing solution was stored in a stainless steel holding vessel and pressured by nitrogen via a regulator (Compact Multi Stage Precision Pressure Regulator model 80, Fairchild Industrial Products Co., Winston-Salem, NC). Nitrogen gas was filtered before entering the vessel. Nitrogen pressure was controlled at 15 psi and kept constant during filtration. All testing solutions were equilibrated to room temperature (19–23 °C) and filtered through a single Millex-GV® filter (0.22 μm, surface area 0.65 cm2; Low Protein Binding Durapore® PVDF Membrane # SLGV013SL, EMD Millipore Corporation, Billerica, MA). The filtrate was directed to a container on a weighing balance, where the readings were collected and recorded at least every minute via computer software. Each filtration experiment lasted a minimum of 20 min.

The setup of small-scale filtration experiment.
Results
Small-Scale Mixing Model
A small-scale mixing model capable of mimicking the mixing mechanism of at-scale mixers was first developed to assess the sensitivity of mAb formulation to particle formation during mixing. This model featured simple mixing of 200 mL mAb formulation in a 500 mL flat bottom glass flask using a magnetic stir bar with and without a ring in the middle (Table I). During stirring, the bar without a ring was in close contact with the bottom of the flask, which imitated the impeller design with close contacts between the impeller and the drive unit. With a ring in the middle of the bar, the entire length of the bar (5.1 cm) was raised above the bottom of the flask by the depth of the ring (0.05 cm), except for the point of contact by the width of the ring (0.2 cm) with the flask. These two types of stir bars should be able to differentiate the impact on particle formation during mixing.
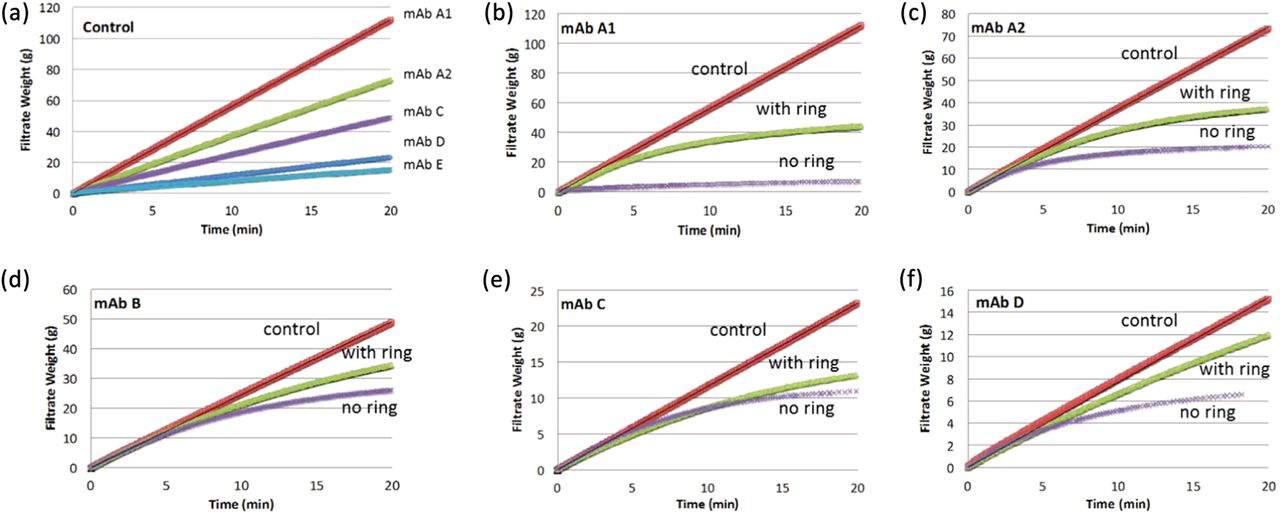
Each of the five mAb formulations was mixed (180 rpm for 2 h) using each type of stir bar and then immediately filtered. The filtration rate of each formulation was compared with that of the control sample, which was not mixed. Figure 3 summarizes all filtration data, including the filtration rate for all controls (Figure 3a) and the filtration profiles of the control and each of the five mAb formulations that were mixed with each of the stir bars (Figures 3b–f). All controls showed no sign of membrane fouling (i.e., constant filtration rates). The filtration rate decreased with increasing mAb concentration. After mixing, obvious filter fouling was observed (i.e., decreasing filtration rate) for all formulations regardless of the type of stir bar used, with or without a ring. However, the impact on fouling was much more prominent when the stir bar without the ring was used, suggesting that the close contact of the bar with the glass surface indeed played a critical role in particle formation of the mixed mAb formulation. Furthermore, based on the extent of fouling, mAb A showed faster (or steeper) filtration rate decrease than the other mAbs. Compared with mAb A2, the low concentration formulation mAb A1 (25 mg/mL) was more sensitive to mixing; thus, mAb A1 was selected for use in large-scale mixing experiments using the different mixers.

Filtration profiles of five mAb formulations (a) before mixing; and after mixing with a stir bar (with and without ring) at 180 rpm for 2 h for (b) mAb A1, (c) mAb A2, (d) mAb B, (e) mAb C, and (f) mAb D.
At-Scale Mixing Studies in Four BMMs
I. Experimental Design—Critical Mixing Parameters and Operating Ranges:
The desired outcome of mixing is to achieve solution homogeneity with minimal impact on the quality attributes and process performance of the mixed product. The parameters critical to mixing are mixing speed, volume, solution viscosity, and mixing time. The high and low operating ranges of these parameters and rationales are listed in Table II. The four BMMs have different impeller designs/dimensions and bag/carrier configurations (Table I); thus, making a direct comparison in mixing efficiency is an extremely challenging task. Because the purpose of the study was not to assess mixing efficiency and performance of each mixer, tip speed was the only parameter used in the study to simplify the comparison. The tip speed of the impeller was calculated by πDN, where N is rotation per minute and D is impeller length in centimeters. Table III summarizes the calculated rotational speed (rpm) of each mixer at low and high tip speeds (0.84 and 1.37 m/s, respectively). The high tip speed was capped by the LevMixer which has a maximum allowable speed at 210 rpm, while the low tip speed was determined by the worst-case mixing condition in the absence of vortexing. The Magnetic Mixer has the largest impeller, 16 cm (Table III), and can exert the most torque, so it is most likely to cause vortexing. Under the worst-case mixing condition for the Magnetic Mixer, that is, high volume of a high-viscosity solution (45 L of 55% w/w sucrose solution), no vortexing was observed when the mixing speed was 100 rpm (i.e., 0.84 m/s).
Experimental Design: Operating Parameters and Ranges
Mixing Speeds of Bottom-Mounted Mixers
The tested mixers have a volume capacity of either 10 L or 50 L. The Magnetic Mixer and the LevMixer were supplied with 50 L bags, which have a minimum operating volume of 30 L. The maximum operating volume tested was 45 L, which was set below bag capacity but still with ample headspace. To be consistent, the same volume range was applied to the 50 L Mobius Mixer although its minimum operating volume was approximately 2 L. The Mobius Mixer was also supplied with 10 L bags, which is consistent with the Mavag Mixer in a 10 L custom-made glass container. Both were operated at a minimum volume of 2.8 L.
Solution viscosity is an important property affecting mixing; increasing viscosity of the solution limits turbulent flow. The mAb formulations tested in this study represent a wide range of concentration/viscosity with mAb A1 (25 mg/mL/2 cP at 20 °C) and mAb D (200 mg/mL/10 cP at 20 °C). Current purification technology applies process ultrafiltration (UF) for protein concentration. UF may encounter significant challenges with high-viscosity bulk (in the range of 20–30 cP), such as prolonged processing time, decreased recovery, and possible adverse changes in product quality attributes. Thus, in this study, the high limit of viscosity was set at 25 cP using a 55% w/w aqueous sucrose solution.
II. Mixing Time Determination:
The worst-case strategy was applied to determine the mixing time in each of the 50 L mixers: low speed (100 rpm for the Magnetic Mixer; 128 rpm for the LevMixer; 240 rpm for the Mobius Mixer), high volume (45 L), and high viscosity (25 cP for 55% w/w sucrose solution). Green dye was added to the top of the solution at the beginning of mixing, and its concentration was monitored by UV spectrophotometry. Mixing time was determined when UV readings reached a constant absorbance and dye homogeneity was confirmed by visual observation. As shown in Table IV, the dye was homogeneously mixed in the sucrose solution very quickly (<1 min) in the Magnetic Mixer and the LevMixer while the mixing time was much longer (85 min) in the Mobius Mixer. Understanding the mixing performance/efficiency of these three single-use mixers is not within the scope of this study and may significantly vary during scaling up. However, the difference in bag/carrier design may be an important factor. The cubical shape of the bags and the carriers of the Magnetic Mixer and the LevMixer might improve mixing efficiency, with the square corners serving as baffles in contrast to the circular shaped bag/carrier of the Mobius Mixer. Because the Mobius Mixer is less powerful, its mixing time at high speed (400 rpm) was also tested and determined to be 22 min.
Experimental Conditions for Determining Worst-Case Mixing Time and Assessing Worst-Case Mixing Impact on Drug Product Quality
III. Assessing Mixing Impact on Drug Product Quality:
The worst-case strategy was again applied to evaluate the impact of mixing on drug product quality. At each mixing speed, the worst-case conditions were low volume (30 L), low viscosity (the most sensitive mAb A1 formulation at 2 cP), and extended mixing time (Table IV). The mixing time for testing drug product quality was arbitrarily chosen by extending the previously determined mixing times by at least 3 fold as the worst case (i.e., 480 min at high tip speed and 60 min at low tip speed).
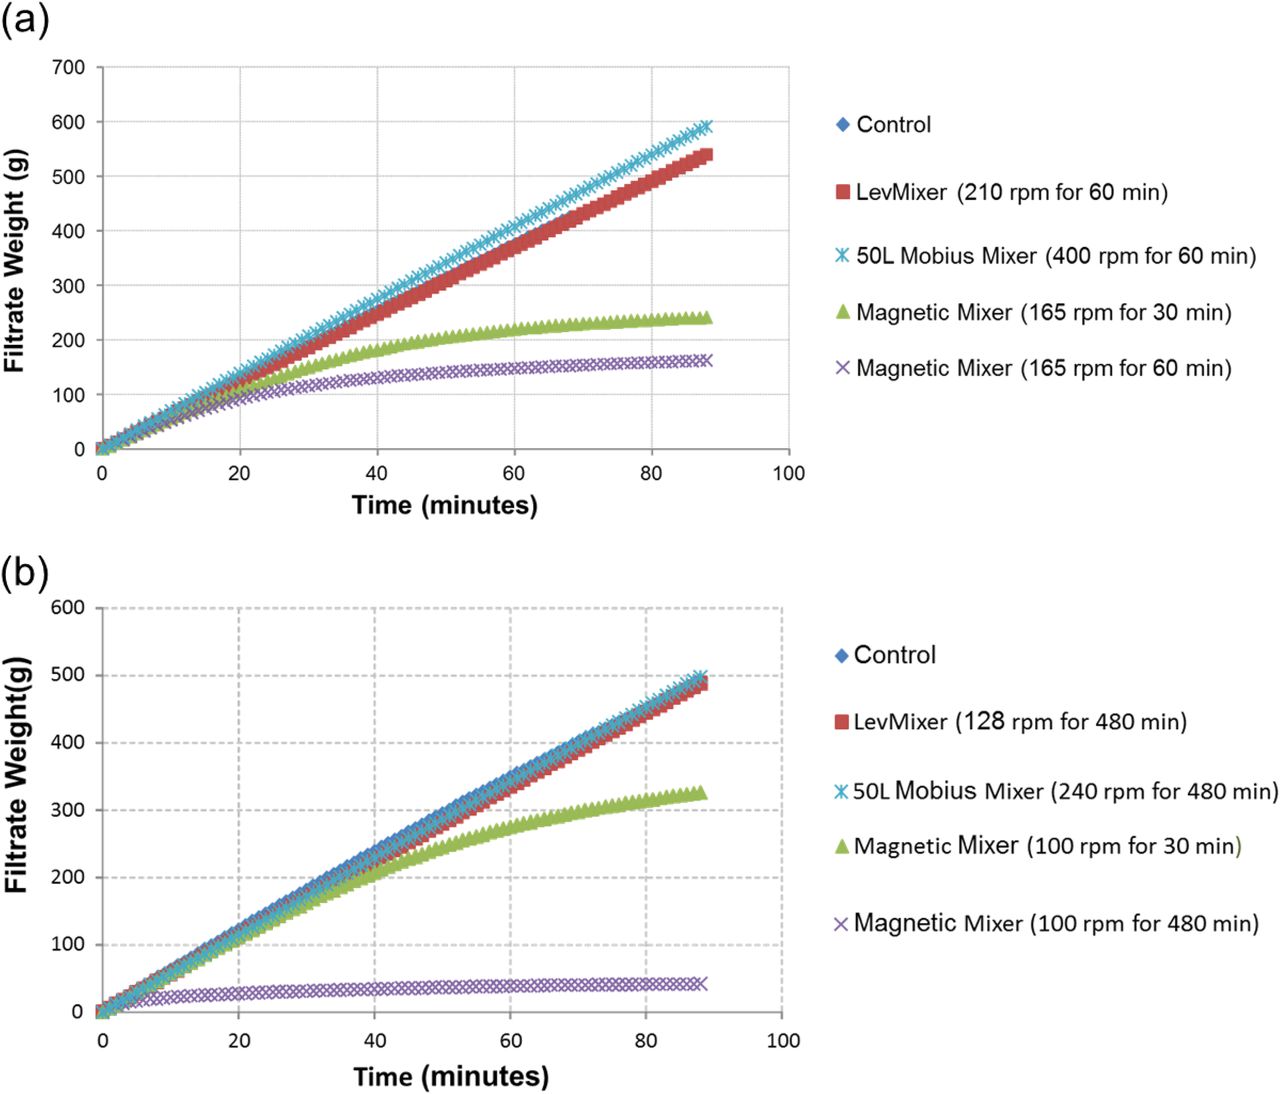
The tests on drug product quality attributes included size variant analysis by SEC-HPLC, turbidity, and particle analysis. Testing samples were taken at T = 0, 30, and 60 min for the high tip speed experiments and T = 0, 60, 120, 240, and 480 min for the low tip speed studies. Control samples (i.e., without mixing) were also tested at the beginning and the end of the mixing experiments. The test results are summarized in Tables V and VI for high tip speed and low tip speed, respectively. For all mixers, there were no apparent changes in size variants by SEC (monomer, high molecular weight species, or low molecular weight species) or in the turbidity of the solution during and after mixing. The only change observed was increased particle count in mAb A1 formulation after mixing in the Magnetic Mixer. At the end of mixing, mAb A1 solution was filtered using a 0.22 μm sterile filter at the pressure of 15 psi. The filtration profile (filtrate weight vs time) for each mixer is shown in Figure 4a (high tip speed) and Figure 4b (low tip speed). Solutions mixed in the LevMixer and the Mobius Mixer displayed filtration profiles that overlapped with that of the control and showed no sign of filter fouling. However, solutions mixed in the Magnetic Mixer fouled the filters with a significant decrease in filtration rate. Furthermore, the longer the mixing time, the faster the filter fouled (i.e., 30 min vs 60 min at high speed and 30 min vs 480 min at low speed).
Drug Product Quality Analysis for mAb A1 Mixed Using LevMixer, Magnetic Mixer, and Mobius Mixer at High Tip Speed (1.37 m/s)
Drug Product Quality Analysis for mAb A1 Mixed Using LevMixer, Magnetic Mixer, and Mobius Mixer at Low Tip Speed (0.84 m/s)

Filtration profiles of 30 L mAb A1 formulation after worst-case mixing in LevMixer, Magnetic Mixer, and 50 L Mobius Mixer (a) at high tip speed and (b) at low tip speed.
To compare with the 10 L mixers (Mobius Mixer and Mavag Mixer), the mAb A1 active and buffer formulations were also mixed under the worst-case condition, 2.8 L at low tip speed (i.e., 240 rpm in the Mobius Mixer and/or 200 rpm in the Mavag Mixer) for 1 h (instead of 8 h because of low volume). Based on the filtration profiles shown in Figure 5, slight filter fouling was observed for mAb A1 active formulation after 1 h in the 10 L Mobius Mixer, while significant fouling was noted after mixing in the Mavag Mixer. Interestingly, after mixing in the Mavag Mixer, the buffer formulation also somewhat fouled the filter.

Filtration profiles of 2.8 L mAb A1 formulation and its buffer before and after worst-case mixing in Mavag Mixer (200 rpm for 1 h) and 10 L Mobius Mixer (240 rpm for 1 h).
IV. Particle Count Analysis of Mixed Solutions:
To evaluate the root cause of filter fouling, mAb A1 formulation and buffer samples taken from the mixing experiment depicted in Figure 5 were analyzed using two particle counters, HIAC Royco and Coulter Counter (Table VII). The analyses were performed twice at different time (Test 1 and Test 2). The particle size range for the Coulter Counter was 1.18–30 μm, and for HIAC Royco it was >1.4 μm. For mAb A1 buffer, the particle count was low (<500 counts/mL) before mixing but increased dramatically after mixing in the Mavag Mixer (>30,000 counts/mL). A more significant trend was observed for the active formulation before mixing (<10,000 counts/mL) and after mixing in the Mavag Mixer (∼1.3 million counts/mL). Mixing of the active formulation in the 10 L Mobius Mixer resulted in only a slight particle count increase, from 10,000 to <20,000 counts/mL. The majority of the particles in the active formulation after mixing in the Mavag Mixer were small—99% in the range of 1.18–2.0 μm, and all of these particles could be removed by 0.22 μm filtration (<100 counts/mL).
Particle Count Analysis by HIAC Royco and Coulter Counter on mAb A1 Active Formulation and Its Buffer before and after Mixing in Mavag Mixer (2.8 L at 200 rpm for 1 h) and 10 L Mobius Mixer (2.8 L at 240 rpm for 1 h)
Discussion
Based on the filtration performance of mAb formulations after mixing using different mixers (Figures 3 and 4), the LevMixer and the Mobius Mixer had little obvious impact on mAbs, whereas mixing in the Magnetic Mixer and the Mavag Mixer caused significant fouling of the 0.22 μm filters. In terms of impeller design, the impeller in the LevMixer is driven by superconductivity to levitate above the drive unit without contact. The impeller of the Mobius Mixer is levitated by magnetic force in a cup-shaped drive unit to lock in its position. However, periodical contacts of the impeller with the side of the cup indeed occurred. In contrast, the Mavag Mixer has a very narrow clearance (gap) (Figure 1b) between the impeller female bearing and the drive unit male bearing, which may grind each other during rotation. In the Magnetic Mixer, the impeller and the drive unit is in contact via ceramic bead bearings. Thus, it can be concluded that BMMs with designs that allow contact between the impeller and the drive unit are highly likely to adversely affect the protein during mixing, resulting in particle formation. The small-scale mixing study employing stir bars with or without a ring (Figure 3) could simulate mixing in at-scale mixers. The stir bar with a ring in the center raised the bar to limit contact with the bottom surface of the flask, whereas the bar without a ring was in direct contact with the flask's surface. This setup could serve as an effective tool in differentiating or ranking the sensitivity of different protein formulations to BMMs, particularly in designs with the impeller and the drive unit in close contact.
The test methods used to detect the impact of mixing on drug product quality attributes should be carefully chosen. Size variant analysis by SEC-HPLC and solution turbidity were not sufficiently sensitive to differentiate the impact of mixing (Tables V and VI). Particle count analysis was able to distinguish the effect of mixing (Table VII). However, the type of particle counter used for analysis should also be carefully evaluated. The Coulter Counter was more sensitive than the HIAC Royco in detecting particle sizes <2 μm, and it suggested that 99% of the particles generated after mixing in the Mavag Mixer fell within that particle size range (Table VII). The Coulter Counter was also able to analyze proteinaceous particles that the HIAC Royco could not detect. Testing the filtration rate could be an equally sensitive method that does not involve expensive equipment and could render more practical information relevant to at-scale manufacturing data.
When considering the mostly likely mechanism responsible for particle formation, the outcome of this study may be attributed more to the effect of shear, cavitation, or their combination than to the heterogeneous nucleation hypothesis. Mixers like the Mavag Mixer indeed shed non-proteinaceous particles based on mixing of the mAb A1 formulation buffer (Table VII), but these particles represent a small fraction (<3%) of the particulates compared with the substantially higher particle count resulting from mixing the mAb A1 formulation (34,000 vs 1,300,000). Furthermore, all filtration experiments were performed immediately after mixing, and there was no incubation time for the non-proteinaceous nuclei to grow.
Conclusions
Mixing biopharmaceutical formulations such as mAbs in BMMs needs to be carefully assessed. This study clearly demonstrated that the impeller designs of the BMMs played a critical role in particle formation, which could subsequently foul the filtration membrane to cause major manufacturing disturbances, delays, or even loss of a formulation batch. Mixer designs with the impeller and the drive unit in direct contact should be avoided. The root cause of particle formation may be more likely due to shear/cavitation effects than heterogeneous nucleation. Overall, the phenomenon observed in this study may be similar to that reported in rotary piston pump operation and is likely to be caused by the same mechanism.
Conflict of Interest Declaration
The authors declare that they have no competing interests.
Acknowledgments
The authors are indebted to Mr. Frank Devera and his colleagues at Genentech's DP MSAT Department for their project support.
- © PDA, Inc. 2015


