
Abstract
Approximately 97% of filter validation tests result in the demonstration of absolute retention of the test bacteria, and thus sterile filter validation failure is rare. However, while Brevundimonas diminuta (B. diminuta) penetration of sterilizing-grade filters is rarely detected, the observation that some fluids (such as vaccines and liposomal fluids) may lead to an increased incidence of bacterial penetration of sterilizing-grade filters by B. diminuta has been reported. The goal of the following analysis was to identify important drivers of filter validation failure in these rare cases. The identification of these drivers will hopefully serve the purpose of assisting in the design of commercial sterile filtration processes with a low risk of filter validation failure for vaccine, liposomal, and related fluids.
Filter validation data for low-surface-tension fluids was collected and evaluated with regard to the effect of bacterial load (CFU/cm2), bacterial load rate (CFU/min/cm2), volume throughput (mL/cm2), and maximum filter flux (mL/min/cm2) on bacterial penetration. The data set (∼1162 individual filtrations) included all instances of process-specific filter validation failures performed at Pall Corporation, including those using other filter media, but did not include all successful retentive filter validation bacterial challenges. It was neither practical nor necessary to include all filter validation successes worldwide (Pall Corporation) to achieve the goals of this analysis. The percentage of failed filtration events for the selected total master data set was 27% (310/1162). Because it is heavily weighted with penetration events, this percentage is considerably higher than the actual rate of failed filter validations, but, as such, facilitated a close examination of the conditions that lead to filter validation failure.
In agreement with our previous reports, two of the significant drivers of bacterial penetration identified were the total bacterial load and the bacterial load rate. In addition to these parameters, another three possible drivers of failure were also identified: volume throughput, maximum filter flux, and pressure. Of the data for which volume throughput information was available, 24% (249/1038) of the filtrations resulted in penetration. However, for the volume throughput range of 680–2260 mL/cm2, only 9 out of 205 bacterial challenges (∼4%) resulted in penetration. Of the data for which flux information was available, 22% (212/946) resulted in bacterial penetration. However, in the maximum filter flux range from 7 to 18 mL/min/cm2, only one out of 121 filtrations (0.6%) resulted in penetration. A slight increase in filter failure was observed in filter bacterial challenges with a differential pressure greater than 30 psid.
When designing a commercial process for the sterile filtration of a low-surface-tension fluid (or any other potentially high-risk fluid), targeting the volume throughput range of 680–2260 mL/cm2 or flux range of 7–18 mL/min/cm2, and maintaining the differential pressure below 30 psid, could significantly decrease the risk of validation filter failure. However, it is important to keep in mind that these are general trends described in this study and some test fluids may not conform to the general trends described here. Ultimately, it is important to evaluate both filterability and bacterial retention of the test fluid under proposed process conditions prior to finalizing the manufacturing process to ensure successful process-specific filter validation of low-surface-tension fluids.
LAY ABSTRACT: An overwhelming majority of process-specific filter validation (qualification) tests result in the demonstration of absolute retention of test bacteria by sterilizing-grade membrane filters. As such, process-specific filter validation failure is rare. However, while bacterial penetration of sterilizing-grade filters during process-specific filter validation is rarely detected, some fluids (such as vaccines and liposomal fluids) have been associated with an increased incidence of bacterial penetration. The goal of the following analysis was to identify important drivers of process-specific filter validation failure. The identification of these drivers will possibly serve to assist in the design of commercial sterile filtration processes with a low risk of filter validation failure. Filter validation data for low-surface-tension fluids was collected and evaluated with regard to bacterial concentration and rates, as well as filtered fluid volume and rate (Pall Corporation). The master data set (∼1160 individual filtrations) included all recorded instances of process-specific filter validation failures but did not include all successful filter validation bacterial challenge tests. This allowed for a close examination of the conditions that lead to process-specific filter validation failure. As previously reported, two significant drivers of bacterial penetration were identified: the total bacterial load (the total number of bacteria per filter) and the bacterial load rate (the rate at which bacteria were applied to the filter). In addition to these parameters, another three possible drivers of failure were also identified: volumetric throughput, filter flux, and pressure. When designing a commercial process for the sterile filtration of a low-surface-tension fluid (or any other penetrative-risk fluid), targeting the identified bacterial challenge loads, volume throughput, and corresponding flux rates could decrease, and possibly eliminate, the risk of validation filter failure. However, it is important to keep in mind that these are general trends described in this study and some test fluids may not conform to the general trends described here. Ultimately, it is important to evaluate both filterability and bacterial retention of the test fluid under proposed process conditions prior to finalizing the manufacturing process to ensure successful filter validation of low-surface-tension fluids.
Background
Prior to using a sterilizing-grade filter in a pharmaceutical sterilizing filtration, it is necessary to demonstrate the effectiveness of the filter under the end-user's process-specific conditions through filter validation (1⇓–3). One aspect of this validation typically includes a bacterial challenge with B. diminuta under process-specific conditions with actual pharmaceutical product (or surrogate, if necessary). This bacterial challenge must demonstrate complete retention of B. diminuta by the test filter when challenged with a minimum of 1 × 10⁷ CFU/cm2 effective filter area (EFA). The entire effluent volume is analyzed for the presence of the test bacteria. Penetration of the test filter by even just a single B. diminuta cell results in filter validation failure, a necessarily stringent test.
While B. diminuta penetration of sterilizing-grade filters is rarely detected, the observation that some fluids may lead to an increased incidence of bacterial penetration by B. diminuta of sterilizing-grade filters has been reported previously (4). These observations have been made during the filter validation process. In addition, organisms smaller than B. diminuta have also been shown to penetrate sterilizing-grade filters under some conditions (5).
At Pall Corporation, approximately 97% of end-user filter validation tests result in the demonstration of absolute retention of B. diminuta under process-specific conditions; however, in approximately 3% of the tests, absolute retention is not demonstrated. Process-specific filter validation data that was recorded in the past 7 years was analyzed with the goal of better understanding the 3% of tests that do not demonstrate complete retention under the end-user's process-specific conditions.
The most obvious initial observation was that approximately 92% of the failed test fluids (within the 3%), were low-surface-tension fluids (1). To be clear, not all low-surface-tension fluids led to penetration, but of those fluids that did lead to filter validation failure, 92% (285/310) had a low surface tension. The goal of the following analysis was to further identify important drivers of filter validation failure, for the purpose of assisting in the design of sterilizing filtration processes offering the highest possible chance for success.
Methods
The data set included bacterial challenge filtration trials conducted using a broad range of commercially-produced pharmaceutical products and based on a broad range of commercial processes (none of which are identified here). All available historical data using polyethersulfone (PES) filter media from Pall Corporation's Scientific and Laboratory Services Validation laboratories in China, Germany, India, Italy, Japan, Puerto Rico, the United Kingdom, and the United States was collected. The data set from the U.S. included results from the testing of solutions considered both high-risk and low-risk solutions; both successful and failed bacterial challenges were included. Data from countries other than the U.S. consisted primarily of data collected in filter validation failures and did not include all the successes. The data also included all filter validation failures using any filter media other than PES media. All successes were not included in the data analysis because it was neither practical nor necessary to include all filter validation successes worldwide to achieve the goals of this analysis.
As such, the data included all available filter validation failures (from the past 7 years). The result of this is a data set heavily weighted with conditions that led to failure. This allowed for the close examination of process-specific filtration products and processes that could possibly lead to failure, to identify general trends. Just to be clear, this does not indicate that the conditions identified here always lead to failure (in the majority of cases, they did not). But the failed conditions identified here potentially pose a significantly higher risk of unsuccessful filter validation bacterial challenge testing.
The total data set included 1162 individual filtrations; however, not all the same data was available for all the filtrations. For each variable evaluated (differential pressure, load, volume throughput, flow rate, etc.), only the data that included that variable was used. Thus, the total number of data points for each variable is not the same and may not include all 1162 filtrations.
Low-surface-tension categorization was based on actual surface tension data when available and an educated guess (lower or equivalent to water) based on the chemical composition of the test fluid solution when surface tension data was not available (for example, when the presence of a surfactant or lipid suggested the likelihood of reduced surface tension in the test fluid). Thus, for the purposes of this paper, high surface tension refers to a surface tension approximately equal to that of water, and low surface tension refers to any fluid likely to have a surface tension lower than that of water.
Bacterial load was calculated based on the total number of colony forming units (CFU) of bacteria applied to the filter over the entire course of the challenge divided by the area of the test filter, giving CFU per centimeter squared of EFA (CFU/cm2). Bacterial load rate was calculated based on the total number of CFU applied over the course of the challenge, divided by the total time of the challenge, and then divided by the area of the test filter EFA, giving the CFU per minute per centimeter squared of EFA (CFU/min/cm2).
The volume throughput was calculated based on the total volume of challenge fluid applied during the challenge divided by the area of the filter, giving milliliters of challenge fluid per centimeter squared EFA (mL/cm2). The flux was calculated based on the maximum recorded flow rate of the challenge divided by the area of the filter, giving milliliters of challenge fluid per minute per centimeter squared of EFA (mL/min/cm2). In some cases where only the average flow rate was available, the average flow rate was used to calculate the flux.
All t-tests were performed using EXCEL, two-sample, unpaired, and assuming unequal variances. A t-test is a statistical method for comparing two data sets to each other, to determine if they are different. Where the throughput and flux data was divided into groups, they were divided into groups of similar throughput or flux ranges where possible. Where the data was divided by bacterial concentration, only a few sample points were available in some cases, and the sample number is given.
Bacterial penetration risk was defined as the percentage of process-specific bacterial challenge tests resulting in bacterial penetration relative to the total number of challenge tests in that data set. Bacterial penetration was defined as any test where 1 or more test bacteria were detected in the filter effluent.
Results and Discussion
The data from process-specific filter validation projects was roughly divided into low-surface-tension (<68 dynes/cm2) products and high-surface-tension (∼70 dynes/cm2, which is approximately that of water) products. Of 562 tests performed on products identified as low-surface-tension products, 213 tests failed process-specific filter validation, a failure rate of 38%. In contrast, those solutions not likely to have a reduced surface tension resulted in a failure rate of only 14% (in this selected data set). However, as mentioned previously, not all successes were included in the data set, so the actual failure rate for any given filter validation is much lower. When considering all filter validations worldwide, the actual failure rate overall is approximately 3%, but it is clear that for some fluids, the rate is higher than for others.
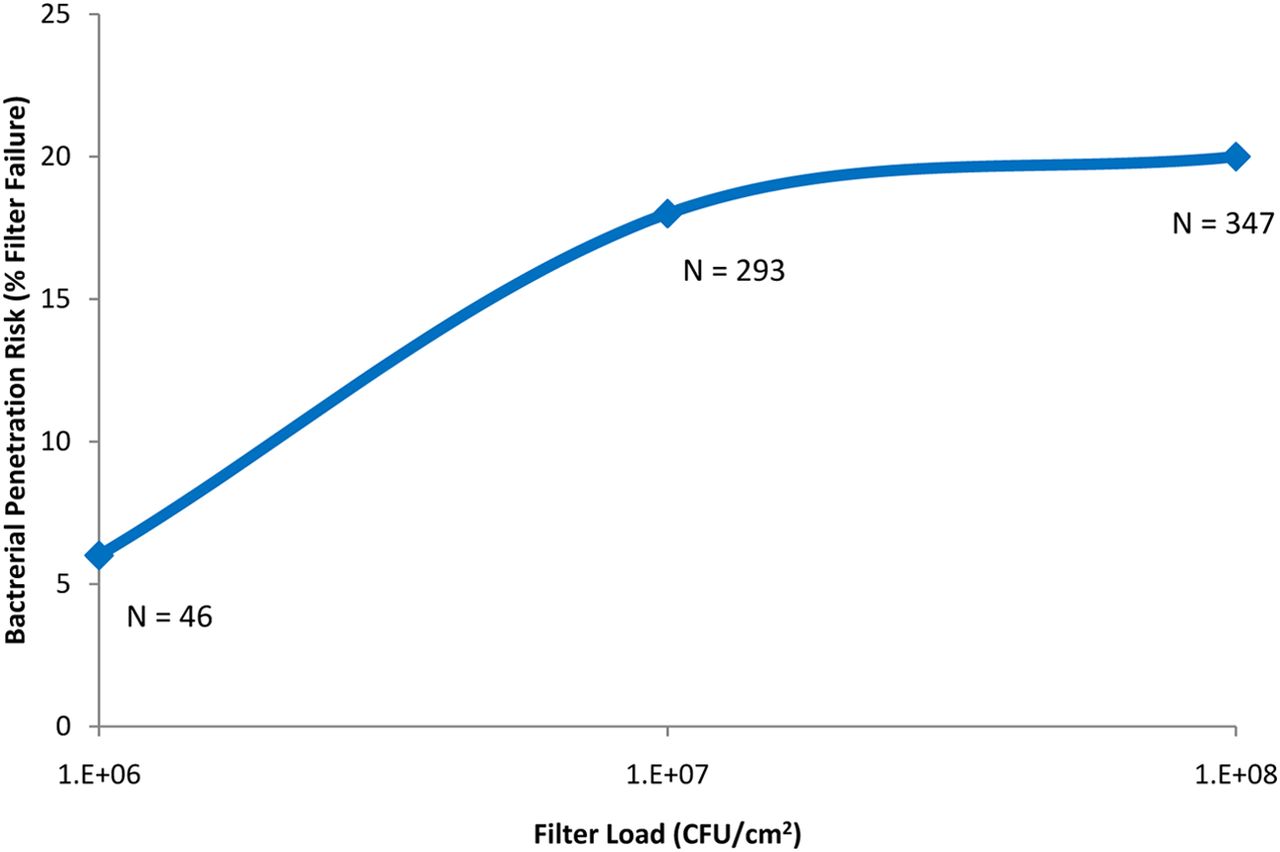
As previously identified (4), two significant drivers of bacterial penetration were the total bacterial load on the filter (CFU/cm2) and the bacterial load rate (CFU/min/cm2). While most filters were tested with a minimum bacterial load of 107 CFU/cm2 to meet the minimum industry standard (1, 2), some data were available where a lower challenge level (<107 CFU/cm2) was applied. Of those, only three out of 46 filters (6%) tested with 106 CFU/cm2 resulted in penetration. Fifty-two out of 293 filters (18%) tested with 107 CFU/cm2 resulted in penetration, and 70 of 347 filters (20%) tested with 108 CFU/cm2 resulted in penetration. This supports a conclusion that as more bacteria are applied to the filter surface, the greater the possibility that some will successfully penetrate the filter, and the data supports that conclusion (Figure 1).

The effect of total bacterial load (CFU/cm2), when filtering predominantly low-surface-tension fluids (including liposomal and similar fluids), on bacterial penetration of sterilizing-grade filters.
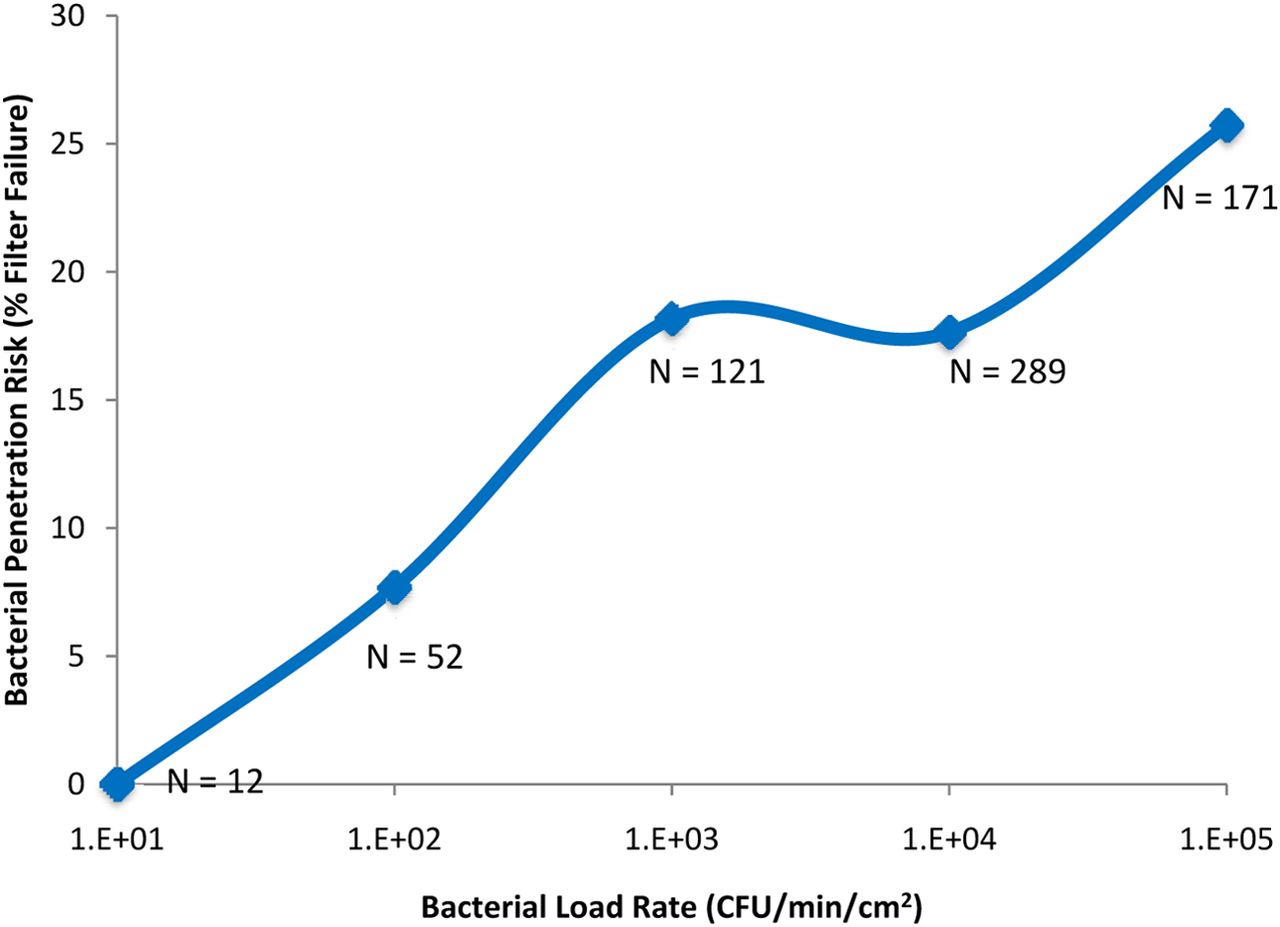
The second previously identified driver of filter validation failure was the bacterial load rate. Although it is intuitive that increasing the total bacterial load will increase risk, it is less intuitive that the rate at which bacteria are applied to the filter would also increase the risk of bacterial penetration, as suggested by the data in Figure 2. Only 12 samples were identified with a bacterial load rate of 10 CFU/min/cm2; none resulted in penetration. Four out of 52 samples (8%) with a load rate of 102 CFU/min/cm2 resulted in penetration. Twenty-two out of 121 samples (18%) with a load rate of 103 CFU/min/cm2 resulted in penetration. Fifty-one out of 289 samples (also 18%) with a load rate of 104 CFU/min/cm2 resulted in penetration, and 44 out of 171 samples (26%) with a load rate of 105 CFU/min/cm2 resulted in penetration. This data suggests that increasing the bacterial load rate increases the risk of bacterial penetration. Although the reason for this is not yet clear, this effect may be related to volume throughput; a high bacterial load rate might result from the use of a smaller volume throughput (as discussed below).

The effect of bacterial load rate (CFU/min/cm2), when filtering low-surface-tension fluids (including liposomal and similar fluids), on bacterial penetration of sterilizing-grade filters.
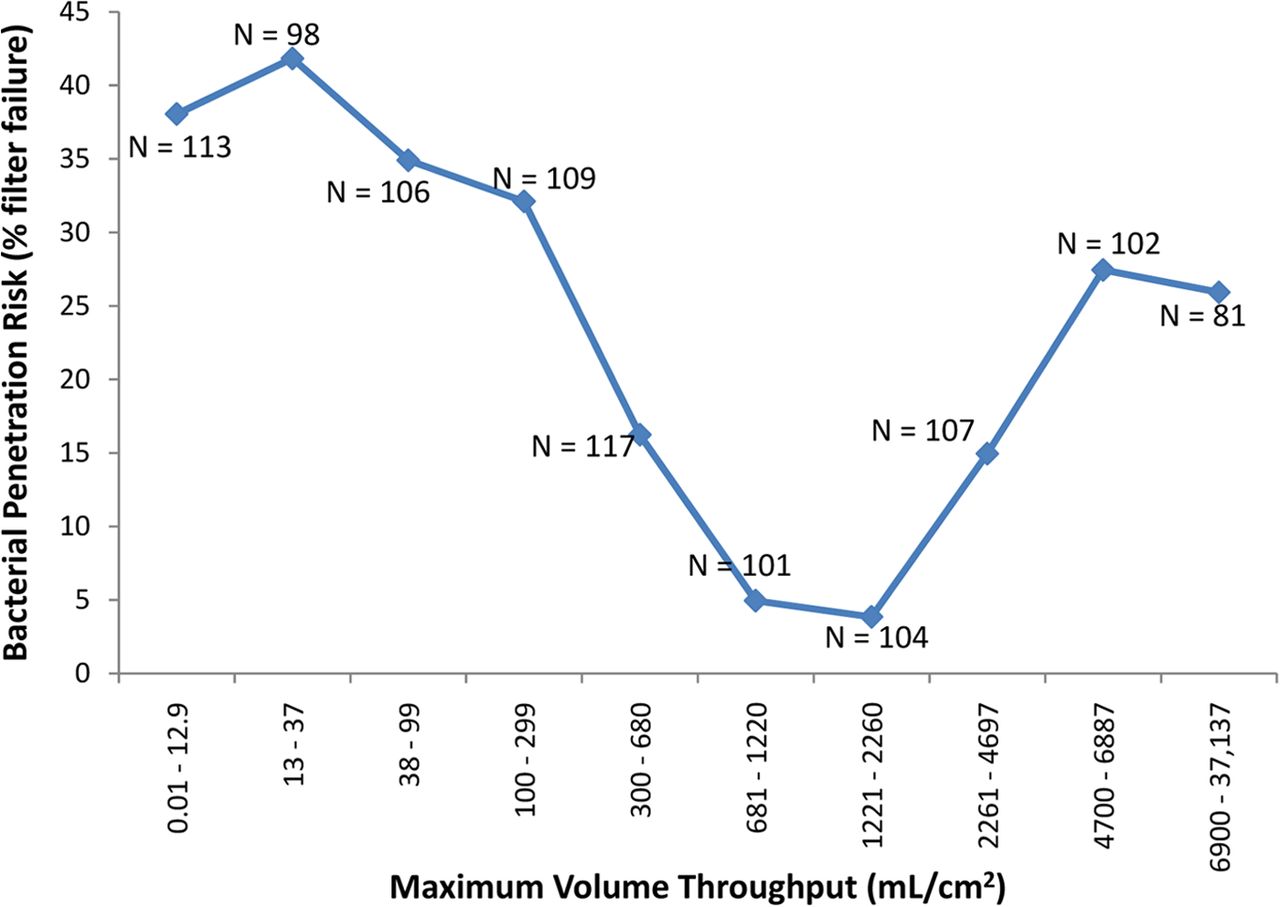
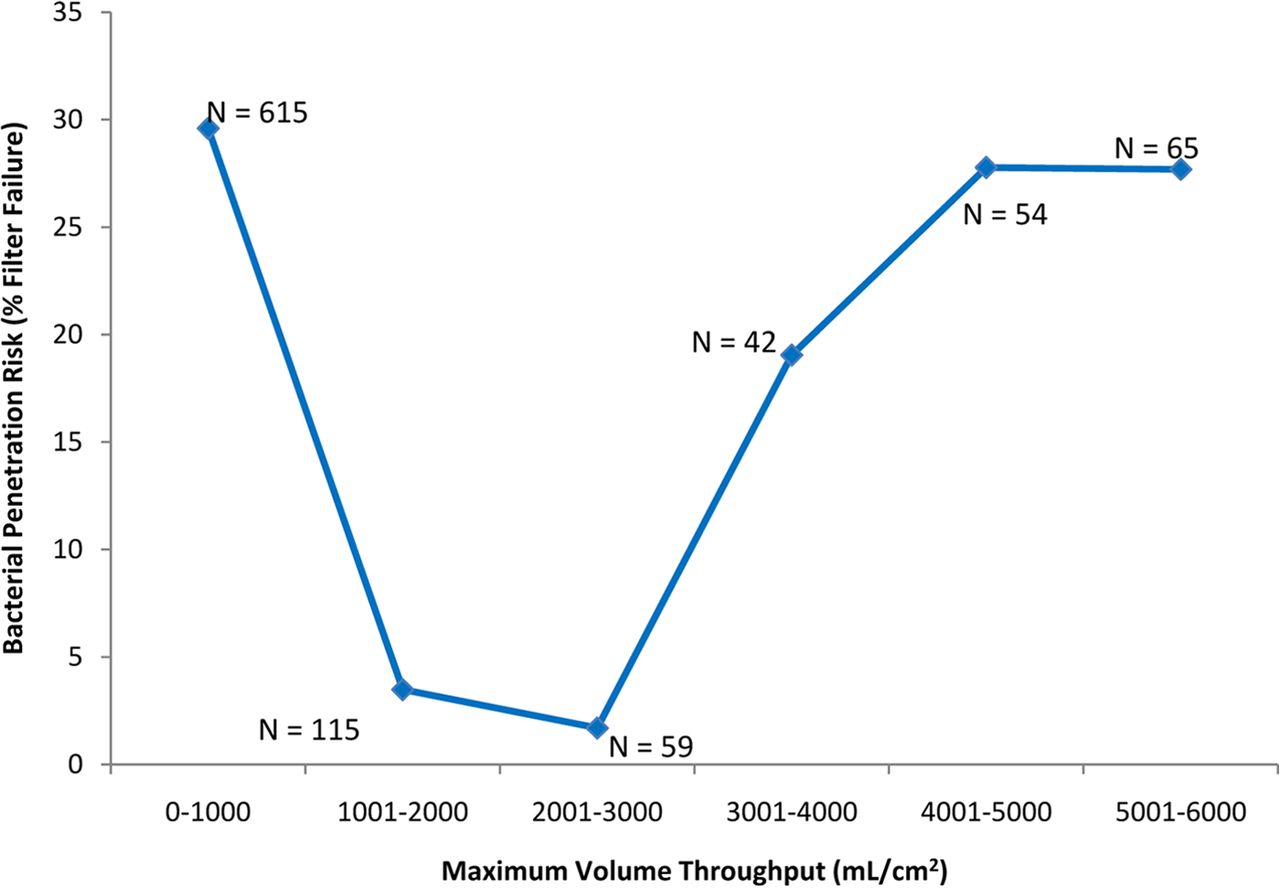
In the current analysis, two additional drivers of filter validation failure were identified: volume throughput (mL/cm2) and maximum filter flux (mL/min/cm2). In the initial evaluation of volume throughput, the data was divided into two sets, (1) the volume throughput (mL/cm2) achieved where no penetration was detected (N = 789) and (2) the volume throughput achieved where penetration was detected (N = 249). These two data sets were compared with a simple t-test, and although no difference was detected (P > 0.05), grouping the data into similar volumetric throughput ranges suggested otherwise. The data are presented in two graphs, in one, the data has been grouped into similar sample sizes (unequal volume throughput grouping), and in the other the volume throughput was divided evenly (unequal sample sizes) (Figures 3a and 3b, respectively). Either way, the end result is the same, for the volume throughput range of 681–2260 mL/cm2, only nine out of 205 challenge tests (∼4%) resulted in penetration, compared to 240 out of 833 challenge tests (∼30%) that resulted in penetration using a volume throughput either greater or less than that range. This appears to indicate that there may be a “low-risk range” of volume throughput for bacterial challenge testing.

The effect of the volume throughput (mL/cm2) of low-surface-tension fluids (including liposomal and similar fluids) on bacterial penetration of sterilizing-grade filters. For this graph, the data was roughly divided into groups with similar sample numbers. This resulted in maximum volume throughput ranges which roughly doubled for each group. For the volume throughput range of 681–2260 mL/cm2, only nine out of 205 filtrations (∼4%) resulted in penetration, compared to 240 out of 833 filtrations (∼30%) that resulted in penetration using a volume throughput either greater or less than that range.

The effect of the volume throughput (mL/cm2) of low-surface-tension fluids (including liposomal and similar fluids) on bacterial penetration of sterilizing-grade filters. In this graph, the maximum volume throughput was evenly divided, resulting in unequal sample numbers for each group (sample number is shown on the graph). As in Figure 3a, for the volume throughput range of 681–2260 mL/cm2, only nine out of 205 filtrations (∼4%) resulted in penetration, compared to 240 out of 833 filtrations (∼30%) that resulted in penetration using a volume throughput either greater or less than that range.
In a process-specific filter challenge, volume throughput less than 680 mL/cm2 may have a higher bacterial load rate (CFU/min/cm2) than greater volume throughputs (so as to meet the total required bacterial load), and that may drive an increased penetration risk under those circumstances (as shown in Figure 2) along with other, as yet unidentified, factors. With a volume throughput greater than 2260 mL/cm2, the bacterial load rate most likely would be reduced (which should reduce risk), but possibly the maximum filter flux (mL/min/cm2) would have to be increased to accommodate a high volume of fluid (discussed below), and that may contribute to an increase in risk (along with other risk factors, such as challenge fluid composition).
Within the data set analyzed, 221 challenge tests were identified as vaccine or liposome process-specific filtrations. Of those, 50% of the vaccine or liposome filtrations resulted in penetration of the test filter. Eighty-one percent of the vaccine and liposome filtrations were completed with a volume throughput less than 681 mL/cm2 with 52% of those challenge results failing to show complete retention; 15% of the vaccine and liposome filtrations utilized a throughput greater than 2260 mL/cm2 with 44% failing to show complete retention. This indicates that 96% of vaccine and liposome carrier fluid challenge tests were performed outside of the observed lower risk range, and 97% of the failures occurred in challenge tests performed outside the observed low risk range. Only nine tests were performed within the low risk range, and three of those failed (33%) to show complete retention.
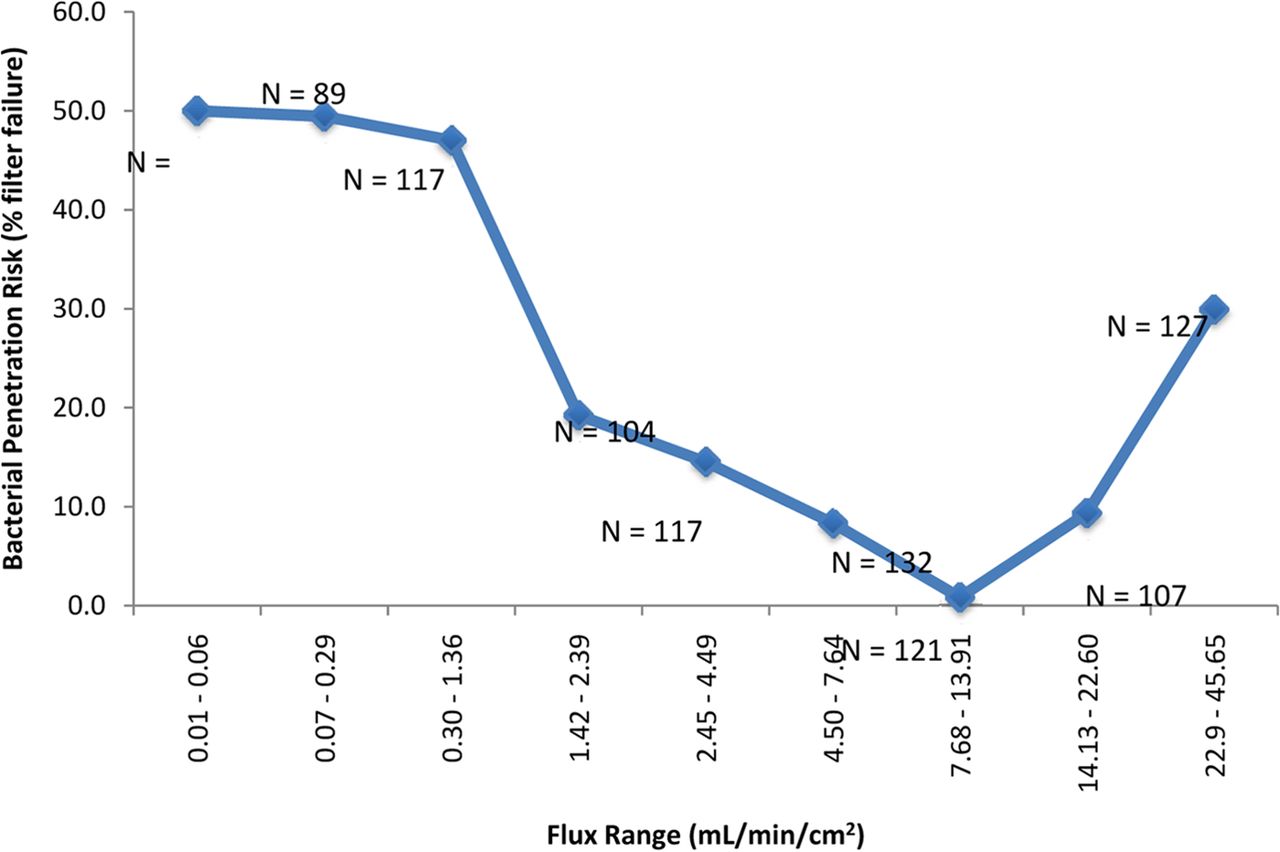
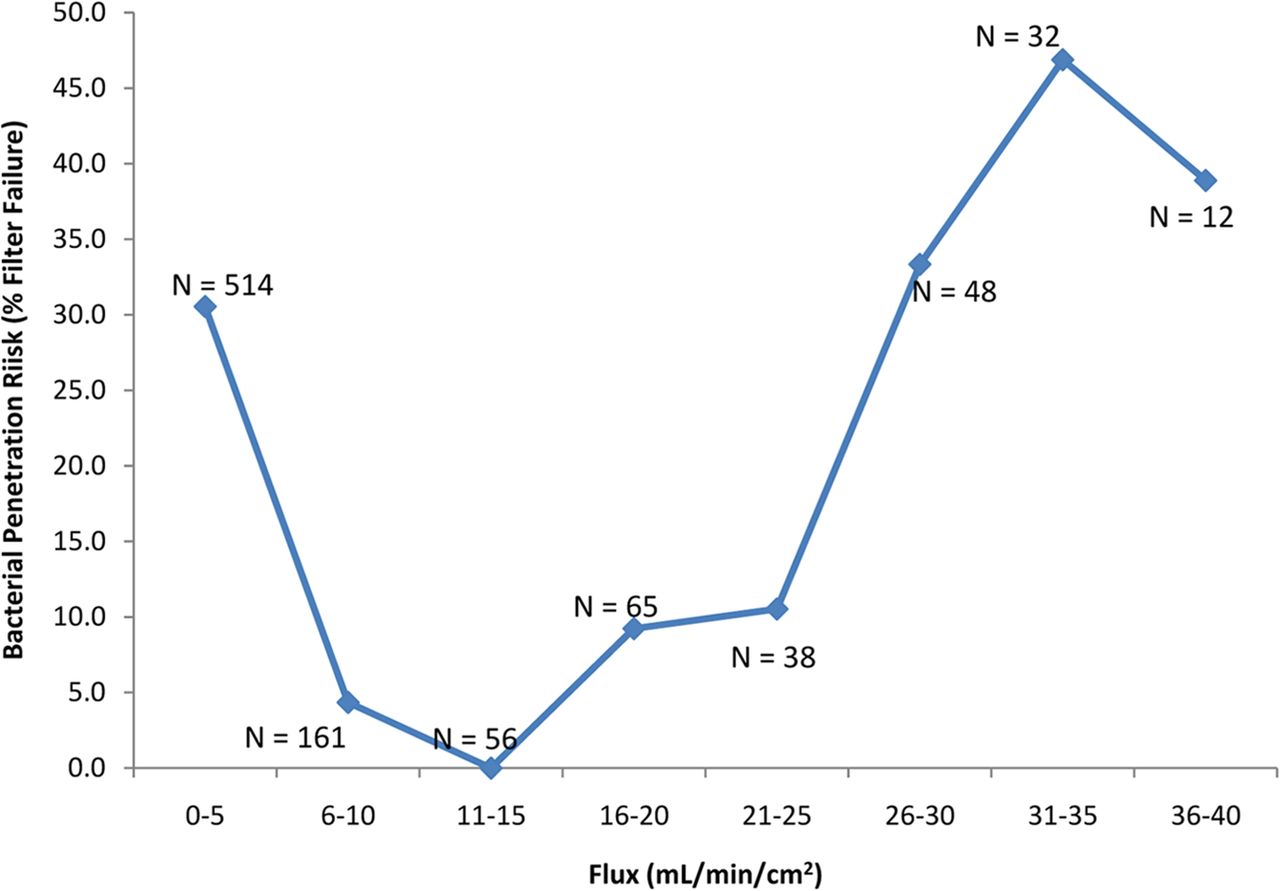
Maximum filter flux (mL/min/cm2) was examined in a manner similar to volume throughput. The data was divided into two sets, (1) the maximum filter flux achieved where no penetration was detected (N = 734) and (2) the maximum filter flux achieved where penetration was detected (N = 212). These two data sets were also compared with a simple t-test (assuming unequal variances) and a difference was detected (P < 0.05); grouping the data into similar flux ranges revealed a flux range of apparent lower risk. As for volume throughput, the data are presented in two graphs; in one, the data has been grouped into similar sample sizes (unequal flux grouping) and in the other the flux was divided evenly (unequal sample sizes) (Figures 4a and 4b, respectively). Either way, the end result is the same: In the maximum filter flux range of 7.5–13.9 mL/min/cm2, only one out of 121 challenge tests (0.8%) resulted in penetration of the test filter. In fact, expanding the range further, from 7 to 18 mL/min/cm2, only one out of 170 (0.6%) filtrations resulted in penetration. The one sample with penetration had a maximum flux of 10.4 mL/min/cm2.

The effect of the fluid flux (mL/min/cm2) of low-surface-tension fluids (including liposomal and similar fluids) on bacterial penetration of sterilizing-grade filters. In this graph the data has been divided into groups of approximately equal sample size, which results in unequal flux groupings (roughly tripled). In the maximum filter flux range of 7.5–13.9 mL/min/cm2, only one out of 121 filtrations resulted in penetration of the test filter. In fact, expanding the range further, from 7 to 18 mL/min/cm2, only one out of 170 filtrations (∼0.6%) resulted in penetration. In contrast, 211 out of 776 filtrations (∼30%) resulted in penetration using a flux either greater or less than that range.

The effect of the fluid flux (mL/min/cm2) of low-surface-tension fluids (including liposomal and similar fluids) on bacterial penetration of sterilizing-grade filters. In this graph the sample sizes are unequal, but the filter flux range of each point is the same (sample number is shown on the graph). As in Figure 4a, in the maximum filter flux range of 7.5–13.9 mL/min/cm2, only one out of 121 filtrations resulted in penetration of the test filter. In fact, expanding the range further, from 7 to 18 mL/min/cm2, only one out of 170 filtrations (∼0.6%) resulted in penetration. In contrast, 211 out of 776 filtrations (∼30%) resulted in penetration using a flux either greater or less than that range.
As with volume throughput, the relationship of the maximum flux of vaccine and liposome solutions with respect to bacterial penetration was also examined. Flux data was available for 176 of those filter challenge tests identified as vaccine or liposome filtrations. Of those, 54% resulted in penetration of the test filter. Ninety-four percent of the vaccine and liposome tests were completed with a flux less than 7.5 mL/min/cm2, with 56% of those filtrations failing to show complete retention; four percent of the vaccine and liposome filtrations utilized a flux greater than 18.0 mL/min/cm2, with 43% failing to show complete retention. This meant that 99% of vaccine and liposome filtrations were performed using a flux outside of the observed lower risk range and that 100% of the failures were outside the observed low-risk range. Four filter challenge tests were performed within the low-risk range, and none of those failed to show complete retention.
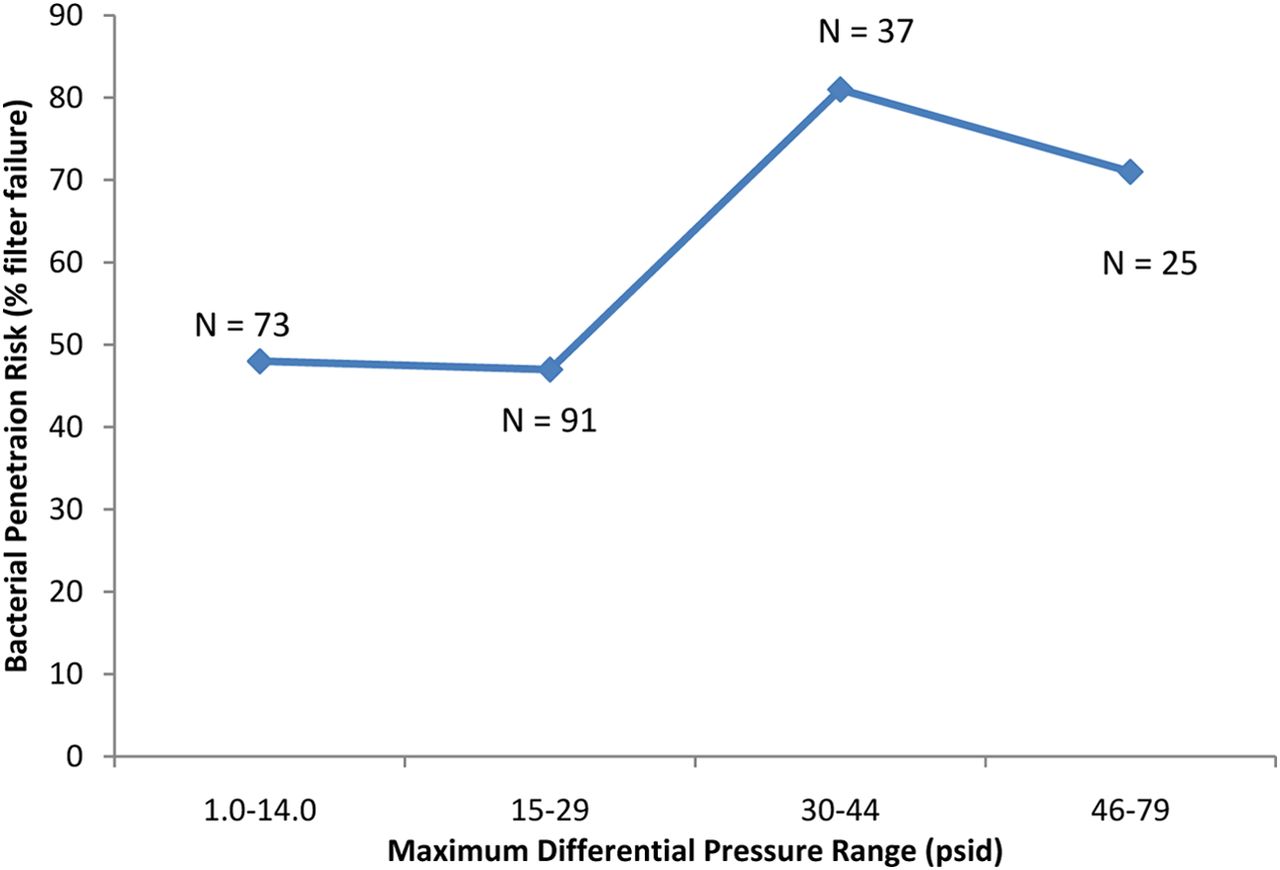
Differential pressure as a driver of filter validation failure was also examined. Where differential pressure information was available, the data was divided into two sets as previously: the differential pressures utilized in cases where bacterial penetration was detected and the differential pressure utilized in cases where no bacterial penetration was detected. No significant difference was detected using a t-test (P > 0.05). Up to a differential pressure of 36 psid, the percentage of challenge tests where bacterial penetration was detected was relatively constant (Figure 5). An apparent slight increase in bacterial penetration risk can be seen in the range of 37–43 psid (Figure 5). Further, within the data, a total of 225 challenges were identified as vaccine or liposomal in nature and which included differential pressure data. A possible increase bacterial penetration risk can also be observed at differential pressures greater than 29 psid when filtering vaccine and liposomal fluids (Figure 6).

The effect of the differential pressure (psid) used in the filtration of predominantly low-surface-tension fluids (including liposomal and similar fluids) on bacterial penetration of sterilizing-grade filters.

The effect of the differential pressure (psid) used in the filtration of vaccines and liposomal fluids on bacterial penetration of sterilizing-grade filters (only vaccines and liposomal fluids included here).
It is worth repeating the fact that the data included all available filter validation failures (from the past 7 years)—but not all successes—and was heavily weighted with conditions that led to failure, for the purpose of closely examining the drivers of filter validation failure. This means that where one failure in 170 filtrations was noted, the actual number of successes is much higher because the vast majority of successes were not included here. Thus, the failure rate overall for that range is even lower than that reported here.
Conclusions
As previously indicated, two significant drivers of bacterial penetration were the total bacterial load (CFU/cm2) and the bacterial load rate (CFU/min/cm2). As the bacterial load on the filter is increased, the possibility that some bacteria will successfully penetrate the filter is increased. Increasing the bacterial load rate also increased the risk of bacterial penetration.
In the current analysis another two possible drivers of failure were also identified: volume throughput (mL/cm2) and maximum filter flux (mL/min/cm2). For the volume throughput range of 681–2260 mL/cm2, only nine out of 205 challenge tests (∼4%) resulted in penetration, compared to 240 out of 833 challenge tests (∼30%) that resulted in penetration using a volume throughput either greater or less than that range. In the maximum filter flux range from 7 to 18 mL/min/cm2, only one out of 170 filtrations (0.6%) resulted in penetration.
It is important to keep in mind that this data analysis does not address why these trends exist in process-specific validation data. We are simply reporting on the observation of these apparent drivers, and any given pharmaceutical fluid may not follow the trends described here. Ultimately, it is important to evaluate both filterability and bacterial retention prior to finalizing the manufacturing process. When designing a commercial process for the sterile filtration of a low-surface-tension fluid (or any other penetrative-risk fluid), targeting this volume throughput range or flux range may decrease the risk of later process-specific validation filter failure. Utilizing a differential pressure of 30 psid or less may also decrease the risk of filter validation failure. These identified lower risk ranges may allow for an improved efficiency and expediency in validating a manufacturing process.
- © PDA, Inc. 2015


