
Abstract
Container closure integrity (CCI) testing is required by different regulatory authorities in order to provide assurance of tightness of the container closure system against possible contamination, for example, by microorganisms. Microbial ingress CCI testing is performed by incubation of the container closure system with microorganisms under specified testing conditions. Physical CCI uses surrogate endpoints, such as coloration by dye solution ingress or gas flow (helium leakage testing). In order to correlate microbial CCI and physical CCI test methods and to evaluate the methods' capability to detect a given leak, artificial leaks are being introduced into the container closure system in a variety of different ways. In our study, artificial leaks were generated using inserted copper wires between the glass vial opening and rubber stopper. However, the insertion of copper wires introduces leaks of unknown size and shape. With nonlinear finite element simulations, the aperture size between the rubber stopper and the glass vial was calculated, depending on wire diameter and capping force. The dependency of the aperture size on the copper wire diameter was quadratic. With the data obtained, we were able to calculate the leak size and model leak shape. Our results suggest that the size as well as the shape of the artificial leaks should be taken into account when evaluating critical leak sizes, as flow rate does not, independently, correlate to hole size. Capping force also affected leak size. An increase in the capping force from 30 to 70 N resulted in a reduction of the aperture (leak size) by approximately 50% for all wire diameters. From 30 to 50 N, the reduction was approximately 33%.
LAY ABSTRACT: Container closure integrity (CCI) testing is required by different regulatory authorities in order to provide assurance of tightness of the container closure system against contamination, for example, by microorganisms. Microbial ingress CCI testing is performed by incubation of the container closure system with microorganisms under specified testing conditions. Physical CCI uses surrogate endpoints, such as coloration by dye solution ingress or gas flow. In order to correlate microbial ingress CCI and physical CCI test methods and to evaluate the methods' capability to detect a given leak, artificially created defects (artificial leaks) are being introduced into the container closure system in a variety of different ways. In our study, artificial leaks were generated using inserted copper wires between the glass vial opening and rubber stopper. Up to date, the insertion of copper wires introduced leaks of unknown size and shape. With nonlinear finite element simulations, the effective aperture size between the rubber stopper and the glass vial was calculated, depending on wire diameter and capping force, and the leak shape was modelled. Our results suggest that the size as well as the shape of the artificial leaks should be taken into account when evaluating critical leak sizes, as flow rate does not, independently, correlate to the hole size.
- Container closure integrity
- Artificial leaks
- Helium leak test
- Sterility
- Microbiological quality
- Finite element simulations
- Capping
Introduction
Container closure integrity (CCI) testing is required by different health authorities in order to provide assurance of tightness of the container closure system (CCS), for example, against possible microbiological contamination (1⇓–3). The sterility test is performed for batch release and as a part of the registration stability studies for sterile products. However, given its probabilistic nature, lack of standardized microbiologic challenge organisms, and other considerations, sterility testing alone cannot replace a CCI test for the drug product unit container. Sterility testing has, due to its limitations, been suggested to even be replaced by CCI, according to the U.S. Food and Drug Administration (FDA), although other authorities have not accepted that concept (4). Microbial ingress CCI (mCCI) testing is performed by incubation of the CCS with microorganisms under specified testing conditions, and physical CCI (pCCI) uses surrogate endpoints, such as coloration by dye solution ingress or gas flow (helium leakage testing) (5).
The microbial ingress test is suitable for any CCS that can withstand immersion and pressure changes. The test article is immersed in a broth containing the test organism. Brevundimonas diminuta, Serratia marescens, Escherichia coli, and other organisms have been used for this test. This test may be static, in which no pressure or vacuum is applied, or dynamic, in which pressure and vacuum are applied, to simulate air transport. Key test factors include bacterial size and motility, differential pressure, challenge media, exposure time, and viable count in the challenge media (6).
Physical CCI testing can include testing for ingress of dye solution, changes in headspace pressure, or a more sensitive technique providing deterministic results, the helium leak test method (7).
In order to correlate mCCI and pCCI tests and to evaluate the methods' capability to detect a given leak, artificially created leaks are being introduced into the CCS in a variety of ways. In other words, positive control test samples with leaks of appropriate size and type are required to come up with adequate acceptance criteria for pCCI testing.
In this study, artificial leaks were generated using copper wires inserted between the glass vial opening and the rubber stopper. This is a standard method that has been previously used to introduce leaks in vials (7). However, to date the available information on the artificial leak nominal size was only indirectly related to the Cu wire diameter.
A critical leak is a void, gap, crack, hole, porosity, or breach in a CCS allowing the passage of microorganisms (8). Methods of leak introduction currently include (i) laser-drilled holes (9, 10); (ii) micron wires (11); (iv) micropipettes (glass pipettes) (12); (iv) micro-tubes and fused silica capillaries. Each of these preparations has its own challenges, and in order to define a critical leak, suitable methods and appropriate acceptance criteria are required.
Some research has been performed to characterize the minimum defect size allowing microbial ingress. Values ranging from 0.3, 5, and 10 μm (pinholes) up to 50 μm (channel leaks) have been observed (5, 8, 11⇓⇓–14). Hence, controversy exists concerning the critical leak size at which product sterility is potentially compromised. The differences may be attributed to many factors, such as different microorganisms, different challenge medium, different CCI defects (i.e. different challenge path), as well as vacuum and time challenge conditions used in the studies (15).
In a highly cited study, Kirsch et al. used micropipettes inserted into the vial body, creating leaks reported down to a size of 0.1 μm. Using this type of leak, they determined that microbial ingress could occur down to a leak size of 0.3 μm. This corresponded well to the size of the smallest bacterium used in their test. However, it would normally be difficult for bacteria to penetrate such small leaks or holes, and consequently these results were discussed intensively. Kirsch et al. reported that microbial ingress failure rates increased with increasing defect nominal leak diameter (12). Although microbial ingress was observed in some defects as small as 0.3 μm, it only became near 100% probability at a diameter of approximately 8 μm (15). It should be noted that these studies were performed under very artificial conditions (i.e., high microorganism population density and vacuum/pressure conditions) and likely do not reflect microbial ingress behaviors under actual product storage conditions. Additionally, two inferential problems existed: firstly, the true pore diameters are not known and cannot be easily determined; the reported diameters were those assigned by the pipette supplier based on a modified bubble test used to assign pore diameters. Secondly, pore length and geometry were unknown, and efforts to visualize the pore lumen by electron microscopy were not successful.
In a different study, Morrical et al. correlated helium leak rate with a microbial challenge test evaluating two different micro-leak types: a laser-drilled micro-hole in a metal plate that is mounted on the top of the rubber closure system (hole diameters 0.5 to 15 μm), and a Cu wire between the stopper and vial (wire diameters 10 to 120 μm). In the micro-hole experiment, helium flow matched theoretical predictions for the orifice (a 4 μm size defect showed microbial ingress corresponding to a helium flow of 6.1 × 10⁻³ mbar × L/s). However, in the Cu wire experiment, helium flow followed less predictable, more complex dynamics. The leaks originated by a 20 μm Cu wire size defect showed microbial ingress with a probability of 35%. This corresponded to a helium flow of 2.2 × 10⁻⁵ mbar × L/s. On the other hand, a leak rate of 1.3 × 10⁻⁵ mbar × L/s and no microbial ingress was determined in the case of leaks originated by a 15 μm Cu wire. The limit of ingress (cut-off) was thus set at 15 μm (wire diameter) for this particular type of leak. And the helium critical leak rate limit was then set based on this value, plus a safety margin, to be 5.0 × 10⁻⁶ mbar × L/s. The path that microbes must follow when Cu wires are used to introduce artificial leaks is a tortuous one, as also indicated by the much lower leak rate observed for this leak type compared to the micro-hole experiment. Leaks generated by Cu wires of different sizes are not comparable to simple round-shaped tube models. This is likely to be due to several factors such as the shape of the tunnels being non-circular and the fact that the dimensions of the tunnels have the potential to vary due to local compressive differences and bends in the pathways. The flow rate between “chambers” in the tunnel will be affected by constrictions and expansions, resulting in pressure differentials established along the path length, thus restricting the overall flow of helium and liquid through the passage (7).
The helium leak test is a pCCI method that has been used to control the pCCI of a CCS (7, 16), both for primary packaging qualification and quality control (QC) purposes. The measured amount of helium (i.e., leak rate) provides information about the tightness of the CCS. The critical leak rate for which the penetration of microorganisms is not detected anymore has been identified based on several correlation experiments performed with leaks of different sizes generated by Cu wires of different diameters. A limit of helium flow rate not more than 1.0 × 10⁻⁷ mbar × L/s has been defined by the authors to determine integrity, based upon scientific data and extensive cross-correlations between mCCI and pCCI helium leakage testing (17, 18). The helium critical leak rate was set below the lowest individual helium leak rate at which microbial ingress was observed. No microbial ingress was detected when the helium leak rate was lower than 2.7 × 10⁻⁷ mbar × L/s, although microbial ingress occurred for most samples for leak rates >10–5 mbar × L/s (comparable to Kirsch et al.). This is in good accordance to existing literature, as the limit of helium leak in correlation to microbial ingress lies between 10–5 and 10–7 mbar × L/s (19). To date, microbial ingress has been observed for Cu wires with a diameter of at least 15 μm.
In our laboratory, uncoated Cu wires were preferentially used to generate artificial leaks for the evaluation of the CCI studies for the following reasons:
Better simulated particles or fibers that could possibly occur in the sealing area and not an artificial hole in the rubber or glass.
Proven ability to work, even although there can be higher variability.
Testing per se: high cost for drilled holes versus wires as well as the fact that drilled holes cannot be used anymore after final mCCI testing.
As illustrated above, the probability of microbial ingress can be significantly different depending on the shape of the defect and the testing method employed. Given that, to date, there was no information on the effective hole size created by this type of artificial leak (area), and on its translation into a hole-type cylindrical orifice for comparative purposes, we have investigated, in this study, the aperture size originated by a Cu wire sandwiched between the stopper and the glass vial using nonlinear finite element (FE) simulations.
Objective
The objective of this study was to calculate the aperture size between rubber stopper and glass vial, depending on Cu wire diameter and capping force, with nonlinear FE simulations. The study included the following Cu wire diameters: 10, 15, 20, 28, 40, 60, and 80 μm. The following container closing forces were used: 30, 50, and 70 N. Simulation results were independent of vial neck size.
Materials and Methods
Finite Element (FE) Simulation Model
The aperture size between Cu wire, glass vial, and stopper was qualified with 2D simulation models using a plane strain approach (20, 21). The model concept assumed no strain perpendicular to the reviewed cross-sectional plane. With consideration of the small Cu wire diameter, this assumption was acceptable and numerically reasonable. Due to the small diameter Cu wire diameter, a fine mesh density was chosen. As consequence of not using this could result in the rubber material not adapting correctly to the adjacent bodies, and the simulation results would be meaningless.
The simulation model included three components:
Glass vial (rigid body)
Cu wire (rigid body)
Radial section of the stopper
The capping force was given by a pressure load on the stopper. The estimation of the reference surface was based on existing technical drawings and experience with existing simulation models of the 13 mm vial neck size. Calculations were based upon the 13 mm vial neck, but results are valid for all neck sizes.
The rubber mechanical properties of the butyl rubber stopper were used for the simulation.
The applied simulation technologies included consideration of geometric nonlinearities: large deflection, buckling effects, nonlinear material properties (rubber material, data acquired by measurements not shown, proprietary information), and nonlinear boundary conditions (frictional contact). Within a single simulation run, the capping force load was increased in multiple steps up to 30, 50, and 70 N.
Mesh density 0.0002 mm was chosen for all models to ensure a precise contact simulation between rubber stopper, Cu wire, and vial.
The software Marc (MSC Software Corporation, Santa Ana, CA) was used in the simulations.
Contact Concept
Each part within the model was represented as a single contact body. The friction coefficient (μ) was generally set to 0.15. The Cu wire and vial were modelled as rigid bodies. The boundaries on the side of the model acted as symmetry conditions, as this was useful to limit the model size.
Figure 1 depicts a schematic diagram of a Cu wire sandwiched between the rubber stopper and glass vial. Figure 2 shows pictures of Cu wire placement during the preparation of samples for the microbial challenge container closure integrity test.
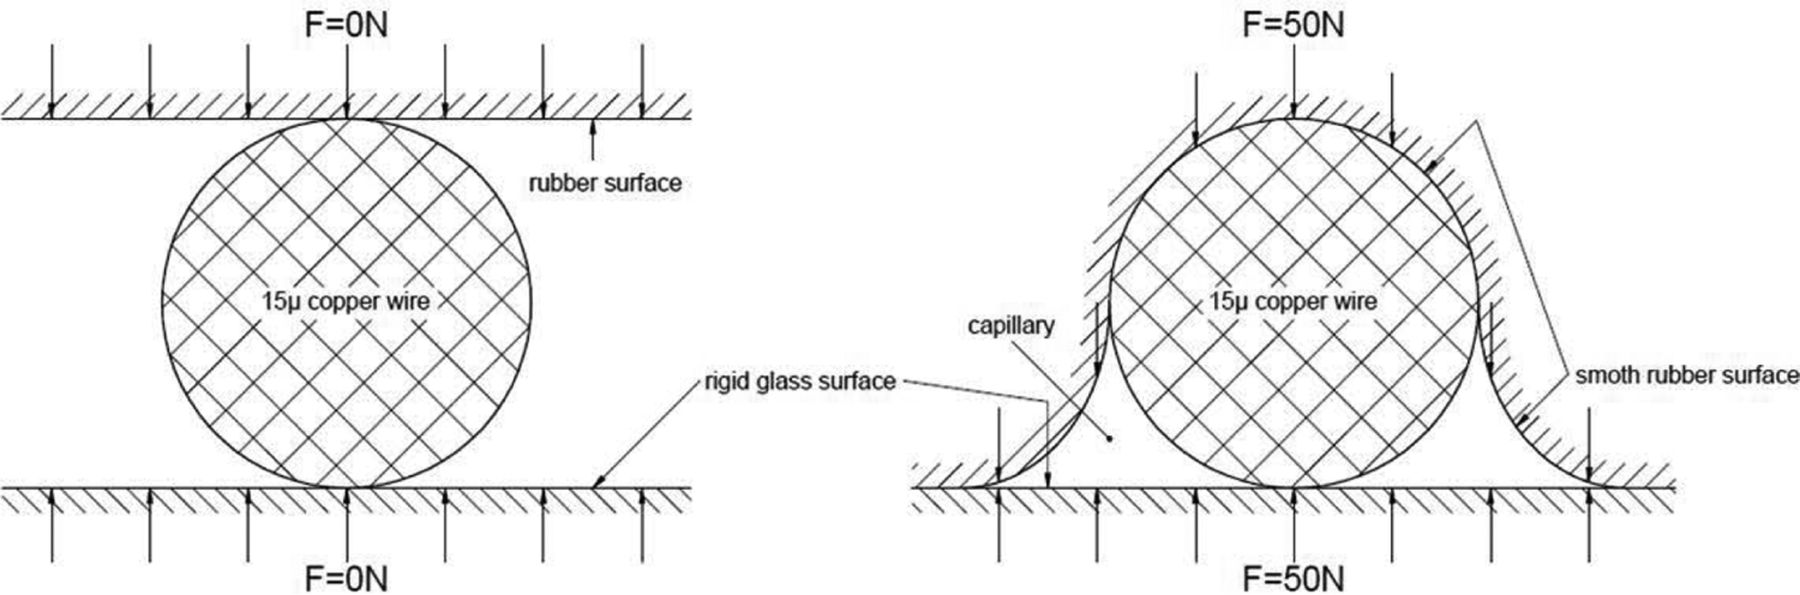
Schematic of a 15 μm Cu wire sandwiched between rubber stopper and glass vial: without applied capping force (left), with 50 N applied capping force (right). The “capillary” in the image on the right is equivalent to the “aperture size”.
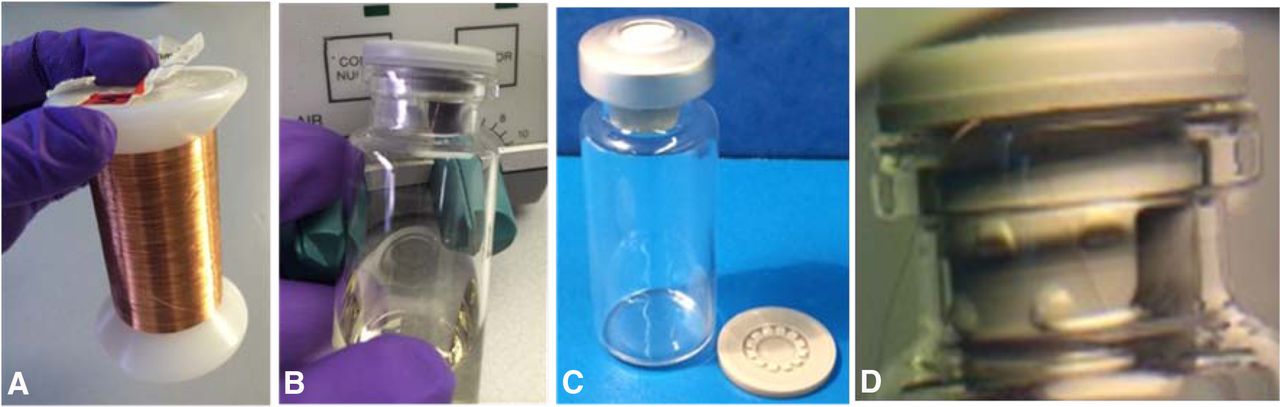
Sample preparation photos: Cu wires, raw material (A); Cu wire sandwiched between glass vial and lyophilized stopper, before capping (B); capped vial (negative control, no wire): the flip-off cap was detached on purpose after capping (C); magnification image of an inserted Cu wire between glass vial neck and rubber stopper (D).
Simulated Versions
The simulations were run for seven wire diameters: 10, 15, 20, 28, 40, 60, and 80 μm. Three different capping forces were applied: 30, 50, and 70 N. In total, 21 evaluation points for the aperture size were reviewed.
Equipment
The following equipment was used to image the geometry of the defects.
An X-ray CT (computed tomography, Skyskan 1172, Bruker, Belgium) system was equipped with a Hamamatsu 100/250 X-ray source operating at 59 kV, a 11 megapixel X-ray camera, and a pixel resolution of about 5 μm, rotation step of 0.28 degrees over 180 degrees. An integration time of 640 ms, with the X-ray source tuned to 100 kV, 86 μA, with a 0.5 mm Al filter, was used. The reconstruction (creation of virtual cuts) was performed with the help of the NRecon software handling four servers. The displays of the images were done under DataViewer 1.4 software for the 2D images, and CTVox 2.4 for the 3D displays.
The scanning electron microscopy (SEM) images were acquired on a ∑igma VP (Zeiss, Oberkochen, Germany) system. The secondary electron detector for variable pressure, under low vacuum, was used for the image acquisition with an acceleration tension of 12 kV. A line averaging of 17 scans per frame was applied to reduce the noise in the images, resulting in a full acquisition time of 44.6 s per image.
In 3D laser scanning microscopy, a laser scanning microscope scans the surface of a sample with a punctiform laser beam and combines it with a picture from a light source. A 3D laser scanning confocal microscope (VK-X200K, Keyence Corporation, Osaka, Japan) was used.
Results and Discussion
Simulation Results
Table I provides a summary of simulation results. Aperture size (leak size) (one-half) (in μm2) is a function of Cu wire diameter and applied load (capping force). The model was limited to one symmetry half for the sake of simplifying FE calculations, therefore the calculated aperture size corresponded to one-half of the total aperture. The leak originated by the Cu wire behaves as two independent apertures on either side of the wire.
Aperture Size Calculated for Different Cu Wire Diameters and Capping Forces (Middle Column); Calculated Equivalent Diameter and Aperture Size Depending on Capping Force and Cu Wire Diameter (Right Column)
The calculation results presented here are useful for qualitative statements. To achieve quantitative statements, a validation of the friction values has to be performed by comparing the simulation results with existing measurement data. In this study, the friction coefficient (μ) was assumed to be 0.15, based on earlier calculations where gliding forces of rubber plungers in syringes were studied, with good correlation to experimental values. The value is likely too high for this study, in which there is no gliding movement. Hence, the influence of the friction coefficient can almost be neglected. To prove this hypothesis, two additional simulation runs were made, both for 10 μm Cu wire and with 30 N capping force with friction μ = 0.05 and μ = 0.45. The aperture size per half (in μm2) were 46.07 μm2 (μ = 0.05, –1.5%), 46.76 μm2 (μ = 0.15, see Table I), and 48.22 μm2 (μ = 0.45, +3%); the friction coefficient and deviation percentage with respect to μ = 0.15 are shown in parentheses. Compared with the general uncertainties in such complex, nonlinear structural simulations, the influence of the friction coefficient for this application is small, especially when we take the large span (0.05–0.45) into account. An increase of the opening with increasing friction forces is plausible, because the rubber part sticks more on the Cu wire.
The material modelling did not include viscoelastic effects (relaxation and creep), because the existing measurements on the chlorobutyl rubber stopper (not shown) focused on short-term static stiffness in the context of container closure.
The results showed, for all wire diameters, an aperture size reduction of approximately 50% when the container closing force was increased from 30 to 70 N. From 30 to 50 N, the reduction was around 33%. From 50 to 70 N, the reduction was around 25%.
The impact of capping force on the leak size was also investigated. The estimated aperture size was in general approximately 60% of the Cu wire cross-section area for 30 N, 40% for 50 N, and 30% for 70 N closing force. The dependency of the aperture size on the Cu wire diameter was quadratic.
Figure 3 shows the aperture size depending on Cu wire diameter and on container closure force. Figure 4 shows the deformed geometry originated by a Cu wire of diameter 60 μm with a 50 N capping force, as an example.
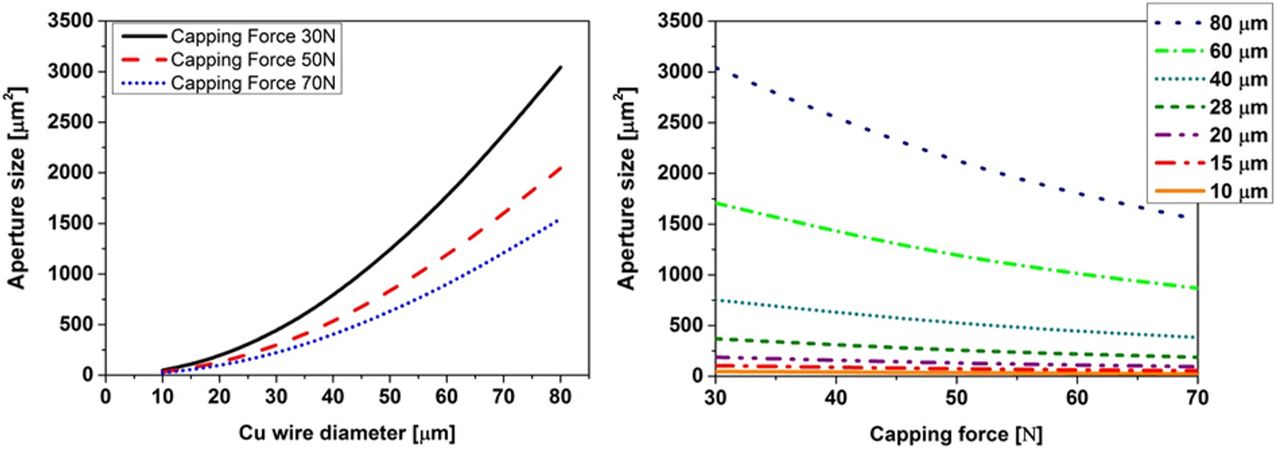
Aperture size (one-half) as a function of Cu wire diameter (left panel) and capping force (right panel).

Schematic of cross-sectional deformed geometry (one-half) with a 60 μm Cu wire diameter and 50 N closing force. The Cu wire is shown in solid line; the rubber stopper is shown in solid color.
Holes versus Wires
Table I also provides the calculated equivalent diameter of a circular-shaped hole of the same area as the calculated aperture size (one-half) (undefined shape), applying the formula:

The aperture size (area) calculated by FE simulations can be regarded as equivalent to a hole of irregular shape. We decided to correlate these results to the equivalent size of a circular-shaped hole of the same area as the calculated aperture size (one-half). When creating artificial leaks with Cu wires, the hole(s) is actually two irregularly shaped tunnels on each side of the wire, having a long path length, and the opening size is variable depending on pressure of the sealing force (22). The terms aperture, leak, and hole are related to each other and they are individually used to emphasis geometrical considerations, the relationship to container closure integrity, or the relationship to an equivalent circular-shaped aperture, respectively. The results show that applied capping forces of 30 N generated equivalent aperture sizes (one-half) that were approximately 30% smaller than the diameter of the cylindrical Cu wire used to create the artificial leak. Forces of 50 and 70 N generated equivalent circular holes (one-half) that were approximately 60% and 80% smaller than the diameter of the Cu wire used to create the artificial leak (calculation not shown), respectively. Capping forces can be measured using residual seal force (RSF), and capping ranges between 20 and 110 N in laboratory-scale testing were shown to still maintain the required CCI (17, 18).
Therefore we believe that flow rate does not, independently, correlate to hole size, as for most artificial leaks and especially leaks in real life scenarios:
Leaks (defects) are irregular in shape (diameter and length are poorly reproducible). The common perception of a leak is a hole of a certain diameter or a channel of certain diameter and length. However, leaks that occur naturally are rarely dimensionally uniform. Real leak paths are not holes, tubes, or pipettes. They are complex, multi-cavity tortuous paths. Natural defects are long, complex, irregular channels. Air pockets, debris, and even product may block the flow. Hence, the critical leak specifications remain undefined for “real leaks”.
Variability is high (techniques for creating leaks are not consistent), with a high sample-to-sample variation.
There is rarely only one hole present but a series of holes/defects that can be cumulative.
The main factor that affects critical leak size is whether or not the micro-leak is filled with liquid, as microorganisms penetrate a liquid-filled defect by motility or pressure differential.
Leakage dynamics are different for different defect types and materials of construction.
The hole size is an indirect way of assessing critical leak size; it is the physical measurement (and its correlation to microbial ingress) that provides the relevant value. It is highly recommended that each pCCI method together with its corresponding measuring unit (i.e., volumetric gas flow in the He leakage test method) is correlated with a specific relative reference (i.e., microbial ingress), because relying on the absolute hole size can be misleading.
Additionally, referring to leak size in microns may suggest an absolute unit that can be compared to the size of bacteria, and this assumption could also be misleading. As mentioned earlier, it has been suggested that a leak size of 0.3 to 10 μm will consistently allow microbial ingress to occur (12). However, the literature has not reliably proven this because the leak size alone will not determine whether bacteria may ingress. This also depends on further aspects, such as the potential leakage pattern, as discussed earlier.
Visualization of Cu Wires by Imaging Techniques
Several imaging techniques were used in an attempt to visualize the artificial defects: X-ray computed tomography (X-ray CT), SEM, and 3D laser scanning microscopy.
X-ray CT was selected as an imaging technique because the compressed Cu wire could be ideally visualized under the crimp cap of a vial crimped with a predefined force, as cross-sections of the interfaces can be imaged. However, the X-ray CT scans revealed too many artifacts created by the shiny Cu wires, mainly in the soft cap area, hence making it impossible to measure rubber deformation (Figure 5). As described in the literature, previous attempts to visualize Cu wires by X-ray CT inserted between the plunger and the barrel in a glass syringe could not identify channels created by a 80 μm wire either, although the metal coating generated a sparkling image in X-ray and helped to distinguish the wire from the plunger (10). The authors confirmed the findings by Yoon et al.

Cross-sectional X-ray CT images of a 60 μm Cu wire sandwiched between the rubber stopper and the glass vial (A: side, B: top, C: cut); and 3D X-ray CT image reconstruction (D, E) of Cu wires of 15, 20, and 60 μm sandwiched between the rubber stopper and the glass vial.
Additionally, SEM images were taken without the flip-off cap, hence the effect of varying crimping force could not be addressed with this technique. However, SEM did not provide sufficient quality images either, likely due to the curvature of the cap and the glass. The emitted and backscattered electrons were very difficult to collect to generate an image (Figure 6). Additionally the ultra-high vacuum needed for the experiment may lead to a displacement of the stopper from the glass surface, which also makes it very unlikely to be successful in imaging the induced gap.

Scanning electron microscope image of a 60 μm Cu wire sandwiched between the rubber stopper (top) and the glass vial (bottom).
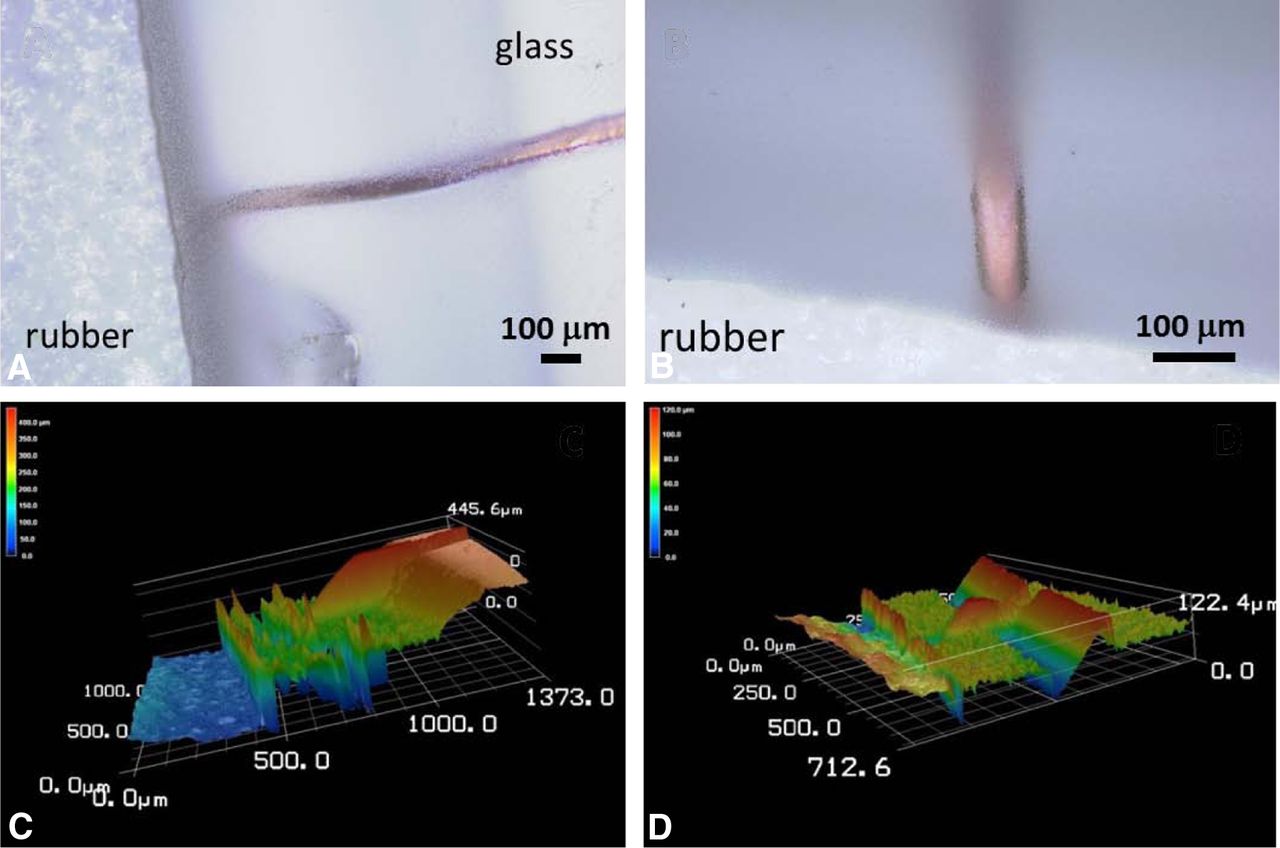
3D laser scanning microscopy could not aid in visualization of the deformation of the rubber stopper created by the Cu wire either. Visualizing the voids at the interface of Cu wire, aluminum flip off cap, and rubber stopper was extremely challenging. When visualizing a stoppered vial with a Cu wire, a groove could be observed at the sealing area. This prevented visualization of the rubber deformation created by the Cu wire. The 3D surface profile shows the mentioned groove (Figure 7). Hence the resolution that could be achieved was not sufficient to distinguish the shape of the deformation or “void”, and definitely not enough to account for differences in dimensions/area of the voids when modifying capping forces and Cu wire diameters (as calculated computationally).

3D laser scanning microscope images (top) and derived 3D surface roughness images (bottom) of a 60 μm Cu wire sandwiched between the rubber stopper and the glass vial.
In light of the results, the authors conclude that the visualization of the deformations was not successful neither by X-ray CT scans, SEM, nor by 3D laser scanning microscope. Only X-ray CT would allow visualization of a crimped vial; the other techniques can only observe the vial and stopper (without crimp cap). Due to the existing limitations of visualization techniques through magnified pictures, it can be concluded that the simulations presented in this work are, to date, the most appropriate tool to determine the effective aperture size created by using Cu wires as artificial micro-leaks.
Additionally, the authors have performed a leak test with different Cu wire sizes (Table II). The results are in good agreement with the work of Morrical et al. (7), who reported microorganism can ingress through channels created from 20 and 60 μm outer diameter wire in the seal with a detection probability of 35% and 100%, respectively. The results presented here, although not intended to correlate to microbial ingress challenge test, show the same trend concerning leak rate order of magnitude. Table II also shows the equivalent diameter of a circular-shaped aperture (in microns) when capping forces of 30 or 50 N are applied, as reported in Table I, for comparison purposes.
Leak Testing by He-Leakage Test Method (HLT-560, Pfeiffer Vacuum AG, Zürich, Switzerland) on Empty 2 mL Vials Crimped at 40 N (n = 10)
Conclusions
The FE calculation results show for all wire diameters an aperture size reduction of approximately 50% when the container closing force was increased from 30 to 70 N. From 30 to 50 N, the reduction was around 33%.
The estimated aperture size was approximately 60% of the Cu wire cross-section area for 30 N, 40% for 50 N, and 30% for 70 N capping force. The dependency of the aperture size on the Cu wire diameter was quadratic.
Correlation of the results to the equivalent diameter of a circular-shaped hole of the same area as the calculated aperture size showed holes of sizes 30%, 60%, and 80% smaller as compared to the Cu wire diameter used to create the artificial leak, when applying 30, 50, and 70 N, respectively.
Often, the detected leakage flow is converted and expressed in terms of hole size for easy conceptualization of the degree of defect. By calculating the effective aperture size created by using Cu wires as artificial micro-leaks, we have experimentally demonstrated that flow rate does not, independently, correlate to hole size and suggest that hole size independently is not an adequate descriptor for artificial leak correlations for CCI tests. Nominal diameter hole sizes assume a leak path of negligible length. Because potential leakage patterns (i.e., tortuous paths of varying diameter) should also be considered, and the effective leak size alone will not determine if a bacterium may ingress, it is recommended that each pCCI method and measuring unit is correlated with a specific relative reference. Merely making use of the absolute hole size or the flow rate corresponding to a particular hole size to evaluate probability of microbial ingress can be misleading.
Finally, the FE calculations presented here are a sound approach to calculate the aperture size originated by Cu wires, where other visualization techniques have failed.
Conflict of Interest Declaration
The authors declare that they have no competing interests.
Acknowledgements
The authors would like to acknowledge Dipl. Ing. Martin Zueger (pinPlus AG, Bern, Switzerland) for his work on the structural simulations.
Footnotes
At the author's request, this version of the article contains a correction added on August 3, 2016: Page 319, equation 1 originally posted as:
 has now been corrected to:


- © PDA, Inc. 2016


