
Abstract
Virus removal by filtration has been an important improvement for the safety margins of plasma-derived medicinal products and has become a standard manufacturing process step for recombinant proteins. While the mechanism of action was initially considered to be strictly size-based, it has recently been recognized that a more complex interaction of the specific filter membrane and its pore architecture with filtrate flow rates may potentially influence the level of virus removal. Based on this improved understanding, parameters beyond the traditional state-of-the-art may need to be included into the design and control of these processes, and the validity of virus removal data generated in small-scale models for the manufacturing scale processes may need to be reevaluated. This article presents a tool for the analysis of flow rate during manufacturing or virus-spiked small-scale runs with a focus on the effects of low or no flow (stop) situations on the robustness of virus removal.
LAY ABSTRACT: Virus removal by filtration has improved safety margins of plasma-derived medicinal products and recombinant proteins. However, low or no flow (stop) situations during virus filtration may potentially affect virus removal. Transforming filtrate flow versus time data into histograms generates intuitively understandable visuals that provide a powerful tool to investigate the equivalence of manufacturing scale processes and down-scaled virus-spiked study runs, and thus to understand the robustness of virus removal for this parameter. With this tool at hand, lower mean flow rates during small-scale experiments are an elegant approach to support the robustness of virus filtration with respect to this parameter at manufacturing scale.
Introduction
When virus filtration membranes became available in the 1990s, the proposed mechanism for virus removal was considered to be purely size-based, that is, much like a sieve with pores of a defined size. Consequently, maximum pressure and maximum volumetric throughput were typically defined as the most challenging parameters for validation studies to determine the virus removal capacity of the respective filter membranes (1). Already in 2005 though, a collaborative study between Millipore, Eli Lilly, and the U.S. Food and Drug Administration (FDA) (2) had made the—at the time isolated—observation that the virus reduction capacity of one specific virus filter membrane was gradually lost under conditions of extreme filtrate flow decay. During the 2011 PDA Virus and TSE Safety Forum, however, three independent research groups reported similar findings, that is, situations of low pressure and consequently lower filtrate flow rate being associated with some loss in virus removal or rapid pressure release (filtration stop) associated with significant increase of virus titer in the subsequent filtrates (3). Similarly, during the 2014 PDA Virus and TSE Safety Forum the results from an FDA and Pfizer collaborative study were presented (4), in essence confirming the earlier findings, again in a clearly membrane-specific fashion.
To address the concern that a lower filtrate flow rate during the virus filtration process might potentially be associated with a reduced virus removal capacity, the current work sought to develop an algorithm for analyzing filtrate flow rates across an entire virus filtration step, to allow for detailed comparison of filtrate flow rates in virus reduction studies and the corresponding large-scale manufacturing processes. The algorithm was then used for a retrospective analysis of the manufacturing process for a plasma-derived monoclonal antibody-purified Factor VIII (FVIII) product and the corresponding down-scaled virus removal studies.
Materials and Methods
Plasma-Derived Monoclonal Antibody-Purified Factor VIII, Hemofil M
For small-scale virus removal studies, that is, validation studies according to guidance (5), the pre-nanofiltration production intermediate was used as described by (6). Briefly, cryoprecipitate was subjected to solvent/detergent (S/D) treatment followed by FVIII immuno-affinity chromatography to remove S/D chemicals and other plasma proteins. Bound FVIII was eluted by a solution containing 40% ethylene glycol, 50 mM imidazole, 40 mM calcium chloride, and 0.1% human serum albumin (HSA) at pH 6.4 (mAb elution buffer). For an extended series of investigational studies on the effects of filtrate flow interruptions on virus retention, the above described elution buffer including HSA but without FVIII was used, that is, a >99% identical solution with respect to protein concentration.
Virus Filter and Equipment
The virus filtration equipment consisted of a proportional-integral-derivative (PID) controller, an electronic recorder, a PID-controlled pump, a PID-controlled valve (post-filter), two pairs of redundant pressure sensors (pre- and post-filter), a flow meter, temperature sensors, and a fill-level sensor for the feed, and this has been described in detail elsewhere (7).
Planova 20N filters (Asahi Kasei Pharma Co., Tokyo, Japan; mean nominal pore size 19 ± 2 nm) were used in combination with 0.1 μm prefilters (Merck Millipore Corp., Darmstadt, Germany) as described by (6), in a dead-end filtration configuration at constant transmembrane pressure (TMP, i.e., the pressure difference between feed and filtrate). Before use, all filters were flushed with the mAb elution buffer. To verify the membrane integrity of each filter, air leakage tests were performed before and after filtration, as well as a gold particle removal test after filtration (for validation runs with FVIII only), according to the manufacturer's instructions.
Viruses and Virus Assays
A variety of enveloped and non-enveloped viruses of different sizes were used: human immunodeficiency virus (HIV, strain HTLV-IIIB) was propagated on H9 cells and titrated on AA2 cells, hepatitis A virus (HAV, strain HM175/18f) was propagated on BSC-1 cells and titrated on FRhK-4 cells, bovine viral diarrhea virus (BVDV, strain NADL) was propagated and titrated on BT cells, pseudorabies virus (PRV, strain Kaplan) was propagated and titrated on Vero cells, and minute virus of mice (MMV, strain Prototype) was propagated and titrated on A9 cells. Human parvovirus B19 (B19V) was obtained as a single plasma donation from a highly viremic donor and the B19V titer (DNA copies/mL) was determined by quantitative polymerase chain reaction (PCR) (8).
Titers from the end-point dilution assays were expressed as log10 50% tissue culture infectious dose/mL (TCID50/mL) and any influences of the process material upon the virus infectivity assay characteristics, cell toxicity, and interference were considered.
Analysis of the virus removal capacity of the process was carried out according to regulatory guidance (5). The volumes and the titers of each spiked sample before and after treatment were used to calculate the virus reduction factor. Whenever virus was undetectable, the limit of detection was taken as the virus titer for calculation.
General Procedure
The laboratory-scale experiments were designed at a scale of 1:800 of the production scale during validation runs and at a scale of 1:8000 during further investigational runs. Virus was added to the eluent from the mAb column or to the mAb elution buffer. The volume of the virus spike was less than 10%. Virus-spiked solutions were passed over 0.01 m2 or 0.001 m2 Planova 20N virus filters. The TMP was set to 1.1 bar during the initial validation study, that is, high TMP as the traditional worst-case parameter. For the additional validation study the TMP was not controlled, instead the filtrate flow rate was kept constant by fixing the pump speed. The TMP, however, did not exceed 1.1 bar and generally was in the range of 0 to 0.6 bar). For runs with mAb elution buffer the TMP was set to 0.9 bar (i.e., manufacturing conditions). The validation studies both included a wash step—this was done with mAb elution buffer. For the runs performed with mAb elution buffer the wash step was omitted. Filtration was performed under ambient temperature (about 25 °C) for all runs.
Theoretical Aspects
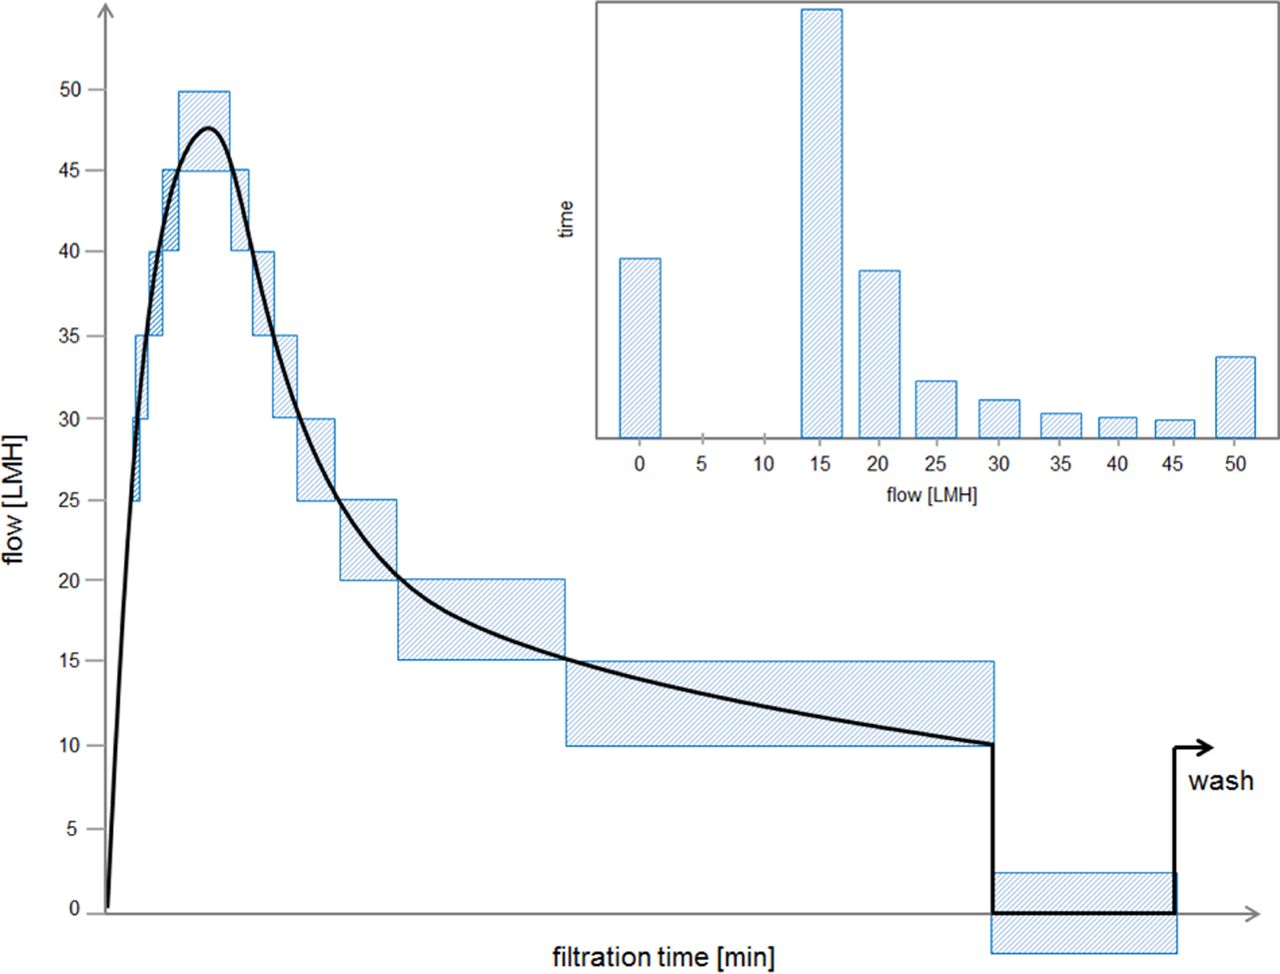
To analyze the filtrate flow rates that occur during a virus filtration process as well as the cumulative duration the process remains in a certain filtrate flow rate segment, the following procedure is applied: the filtrate flow rate in liter per square meter of filter membrane and hour (LMH) is plotted against filtration time, and the filtrate flow rates are then divided into arbitrary LMH segments, in this case increments of five (Figure 1). The cumulative length of time that the process performed in any filtrate flow rate segment is then plotted against the respective filtrate flow rate pocket (Figure 1, insert). Through this transformation of the filtrate-flow-rate-versus-time curve into a filtrate flow rate histogram, the total amount of time that a virus filtration process remained within certain limits of filtrate flow rate becomes intuitively visible. If indeed, as demonstrated for certain virus filter membranes (2), lower filtrate flow is associated with lower virus retention, then the target of a virus validation study is to cover filtrate flow rates below those achieved during the manufacturing scale process, that is, for the filtrate flow rate histogram of the virus validation study to be to the left of the same representation of the manufacturing process. To facilitate the comparison of results for individual virus removal experiments to the manufacturing process, an average LMH for each of the respective processes can be calculated using the equation:
 again with the target of lower average LMH values for virus removal studies versus manufacturing process conditions. Finally, one may consider investigating “no flow”—that is, no filtrate flow rate measured—situations of longer duration than may occur in the manufacturing setting in virus removal studies, which would be reflected by longer bars in the first LMH pocket for virus studies versus the manufacturing-scale process.

The black line represents a schematic of the change of filtrate flow rate over time during a typical virus filtration run/process. The blue boxes mark the parts of the black line that are within a specific filtrate flow rate interval on the y axis. The 0 LMH box (i.e., when no filtrate flow takes place at all) is shifted slightly down so that it is not confused with a 0 LMH to 5 LMH phase. The cumulative time the process remains in any given filtrate flow rate interval is calculated by summing up the x length of all boxes of the respective y interval. This value is then transferred to the histogram (insert). The x axis of the inserted histogram represents the filtrate flow rate bins, with the values of the x axis representing the upper limit of the respective interval (e.g., in the example shown the value “40” on the x axis represents all process minutes during which filtrate flow rates larger than 35 LMH but smaller than or equal to 40 LMH were measured).
Discussion and Conclusions
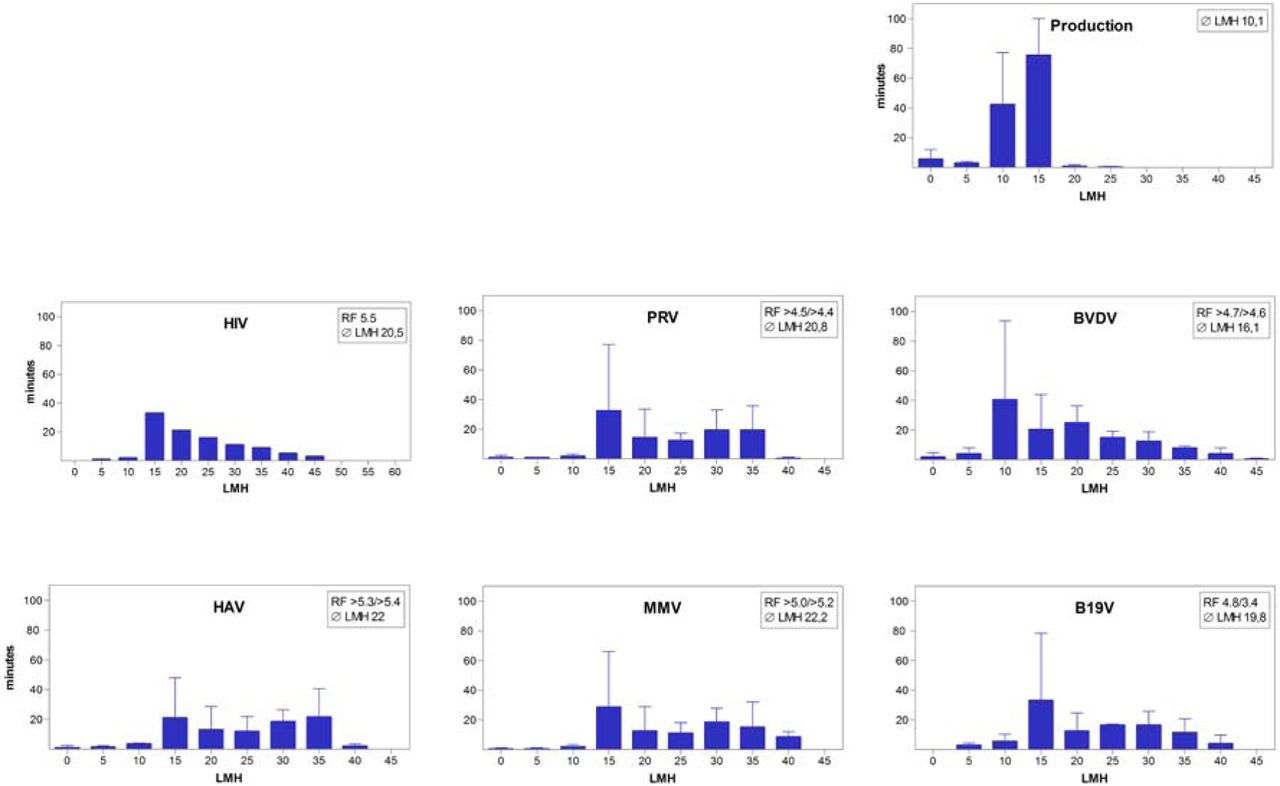
The virus removal capacity of filtration using a 20 nm nominal pore size filter for a monoclonal antibody-purified plasma-derived Factor VIII intermediate (6) has been validated as required per applicable guidance (5). In duplicate runs, the reduction achieved for HIV, PRV, BVDV, HAV, and even the small parvovirus MMV was complete, that is, to below the limit of detection of the infectivity assay. For B19V, which was investigated using a PCR assay (8), reduction factors of 4.8 log10 and 3.4 log10 were achieved. At the time, however, the parameters considered worst case and thus tested for any potential impact on virus removal and were limited to the maximum volumetric load per filter area and the maximum pressure (1). Use of an advanced small-scale model of virus filtration with continuous and fully quality-assured data acquisition (7) did, however, allow reanalysis of the filtrate flow rate data collected years ago. For comparison, the data from 30 routine manufacturing runs were analyzed, which showed that the manufacturing process (Figure 2, upper right panel) had an average filtrate flow rate of 10.1 LMH, whereas all virus-spiked small-scale runs did—as a consequence of the maximum pressure applied in this traditional approach of maximum TMP as worst-case scenario for virus removal—have higher average filtrate flow rates, that is, between 16.1 and 22.2 LMH (Figure 2). In addition, periods of around 10 min of “no flow” did occur during the manufacturing process (caused, e.g., by the switch from product filtration to the wash procedure), whereas in the virus-spiked study runs such periods (caused by process interruptions for sampling and the switch over to the wash procedure) were shorter.

Filtrate flow rate histogram of the virus filtration step of the plasmatic FVIII manufacturing process compared to filtrate flow rate histograms of the small-scale virus filtration runs spiked with HIV, PRV, BVDV, HAV, MMV, and B19V (validation runs). Description of axis and bars see Figure 1. Whiskers represent standard deviation for each bin, based on the data of 30 routine manufacturing runs for the panel “production” and on duplicate runs for the other panels (except for panel “HIV”, as only one of the valid duplicate runs provided flow rate data). RF, reduction factor (log10); LMH, filtrate flow rate in liter per square meter of filter membrane and hour.
To investigate whether periods of lower filtrate flow rates would indeed negatively affect virus removal, additional virus-spiked studies were performed using B19V as the smallest virus of potential concern for the safety margins of plasma-derived medicinal products. Also, where B19V had been the only virus signal that was detected in the filtrates of the first study, use of this virus was more likely to show whether parameter shifts would have an impact on virus removal.
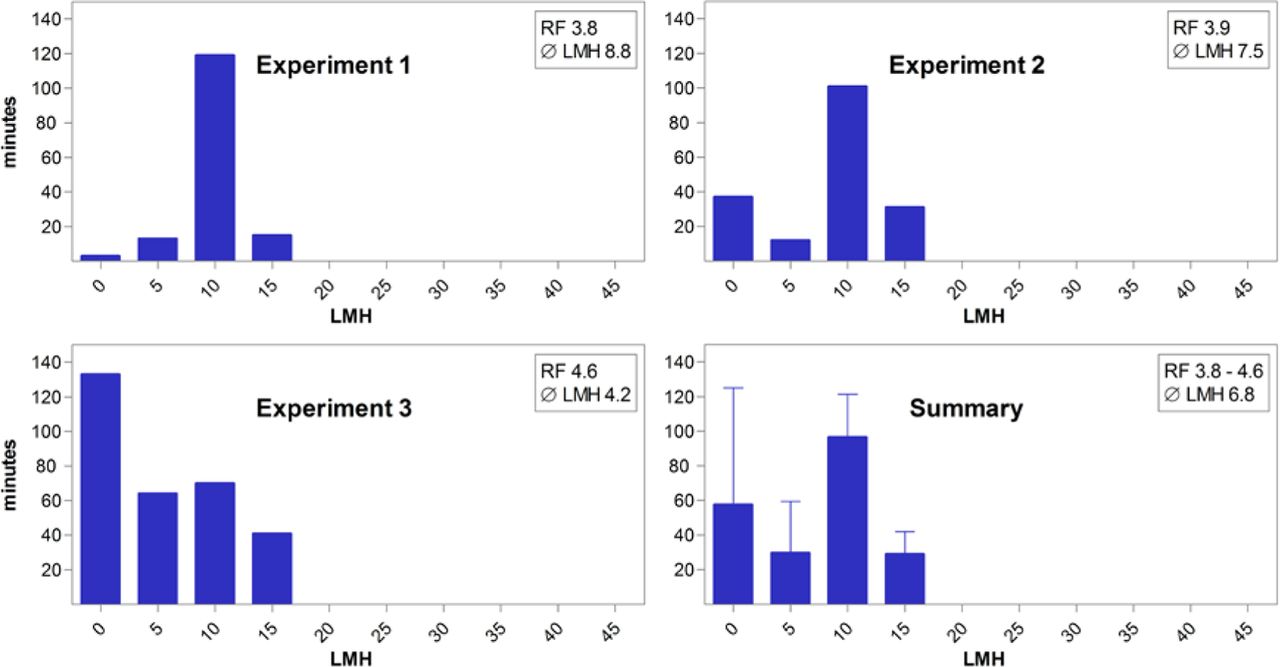
For experiment 1 (Figure 3, top left panel), a filtrate flow rate at or below 10 LMH was targeted, that is, on a par with the large-scale manufacturing process. At a resulting average filtrate flow rate of 8.8 LMH, the virus reduction factor obtained was 3.8 log10. In experiment 2 (Figure 3, top right panel), the filtrate flow rate target at or below 10 LMH was combined with an interruption of filtrate flow for approximately 40 min, between the end of the virus filtration and the beginning of the post-wash, which resulted in an even lower average filtrate flow rate of 7.5 LMH, yet an equivalent virus reduction factor of 3.9 log10. Experiment 3 (Figure 3, bottom left panel) finally combined the low flow rate target with an extended interruption of approximately 120 min, 60 min early during the filtration (i.e., when approximately 6% of the material had been filtered), and another 60 min between the end of the virus filtration and the beginning of the post-wash. While this design resulted in the lowest average filtrate flow rate of 4.2 LMH, the virus reduction factor of 4.6 log10 was still fully consistent with those earlier observed. In summary, at filtrate flow rates at or well below those achieved during the manufacturing-scale process, and with filtrate flow interruptions of up to 2 h, the B19V reduction capacity afforded by the 20 nm membrane was fully consistent with the initial study.

Filtrate flow rate histograms of the small-scale virus filtration step spiked with B19V performed during the follow-up study with mAb elution buffer. General description is identical to the description for Figure 2.
To reconfirm the data generated earlier with the model virus MMV, that is, a parvovirus that while not pathogenic for humans allows for direct investigation of infectivity rather than PCR signal, an additional set of experiments was conducted in which filtrate flow interruptions of increasing duration were introduced into the filtration process, and these interruptions were introduced either early, that is, after filtration of only 10 mL (=10 L/m2), or toward the end of the process, that is, before filtration of the last 10 mL. For the impact of filtrate flow interruption on virus reduction, two diametrically different scenarios could represent worst case: filtrate flow interruptions early in the process, at a stage when the membrane may be considered minimally polarized and thus potentially more prone to virus breakthrough, or alternatively late in the process when a maximum amount of virus might be trapped by filtrate flow in the small pores of the membrane, that—through Brownian motion now unrestricted during filtrate flow pauses—might regain access to pores of sufficiently large size to allow virus breakthrough upon restart of filtrate flow (9). To allow for this rather extensive number of experiments without irresponsibly drawing on clinically valuable material, a matrix that is >99% identical to the product intermediate was used, that is, the HSA-containing mAb elution buffer without FVIII itself.
Filtration without pressure interruption resulted in complete virus removal and a virus reduction factor of >5.3 log10, which is again consistent with the earlier study. The experiments with short, or up to 2 h (i.e., 1, 5, 10, 30, or 120 min—data not shown) of filtrate flow interruptions (average flow rates ranged from 7 to 9 LMH), either early or late in the process, all resulted in complete removal of MMV. As the combination of pH 4 and high ionic strength as established by use of 100 mM NaCl has been described as a potentially challenging condition for the virus removal capacity of the Asahi 20N filter (10), two additional experiments were conducted with early or late filtrate flow pauses of 120 min (average flow rates 8 LMH), in a matrix at pH 6, that is, a low pH, which truly represents worst case as it is already outside of the respective manufacturing specification of pH 6.4–6.7 and 100 mM chloride. Again, complete virus removal with reduction factors of >5.1 log10 (early pause) and >4.6 log10 (late pause) were obtained.
Cumulatively, our results demonstrate that the 20 nm virus filtration results in very robust removal of even the very small parvoviruses, with no impact on filter performance by filtrate flow variations or even prolonged filtrate flow interruptions either early or late in the process, at least for the specific product matrix tested.
The tool presented in this article proved very valuable for the analysis and comparison of flow rates during manufacturing and small-scale processes. Furthermore, it allows for the investigation of the parameter “low flow rate” and thus enhances the robustness of the virus removal data generated during virus clearance studies performed with virus filters.
Disclosure of Conflict of Interest
All authors are employed by Baxalta (now a part of Shire), formerly Baxter. Thomas R. Kreil, Gerhard Pölsler, and Andreas Berting have Baxter/Baxalta stock interests.
Acknowledgments
The contributions of the entire Baxalta Global Pathogen Safety team, most notably Michaela Benkovszky and Brigitte Kainz (down-scaled virus filtration), Sabrina Brandtner and Veronika Sulzer (cell culture), Eva Ha and Sonja Kurzmann (virus propagation), and Maria Farcet for proofreading the manuscript are acknowledged. Furthermore, Franz Gruber and the Baxalta (now a part of Shire) Molecularbiological Control team are acknowledged for the PCR analysis of B19V.
- © PDA, Inc. 2016


