
Abstract
Geobacillus stearothermophilus spores on stainless steel discs are routinely used as biological indicators for the validation of hydrogen peroxide bio-decontamination processes. Given ongoing concerns about the reliability and response time of biological indicators, we explored the potential for an enzyme-based approach to decontamination process evaluation. Thermostable adenylate kinase enzyme was coated onto a solid support and exposed to hydrogen peroxide vapour, in parallel with standard commercial 6-log biological indicators, during a series of vapour-phase hydrogen peroxide cycles in a flexible film isolator. The exposed biological indicators were enumerated to define the degree of kill at different time intervals and the results compared to the thermostable adenylate kinase values, as determined by measuring adenosine triphosphate produced by residual active enzyme. Both biological indicators and the thermostable adenylate kinase indicators exhibited a biphasic inactivation profile during the process. There was significant variance between individual cycles, with some cycles showing complete inactivation of the biological indicators to the limit of detection of the assay, within 6 min, whereas biological indicators in some cycles were inactivated at a time greater than 12 min. The log-kill of the biological indicators at intermediate time points were plotted and compared to the fully quantifiable measurements derived from the thermostable adenylate kinase indicators at the same time points. The results demonstrated very similar inactivation profiles for the enzyme and for the biological indicators, thus it was possible to define a relationship between relative light units measurement and biological indicator kill. This indicates that it is possible to use thermostable adenylate kinase measurement as a direct measure of vapour-phase hydrogen peroxide bio-decontamination performance, expressed in terms of log reduction. Because thermostable adenylate kinase measurement can be achieved within a few minutes of vapour-phase hydrogen peroxide cycle completion, compared with a minimum of 7 days for the evaluation of biological indicator growth, this offers a potentially valuable tool for rapid vapour-phase hydrogen peroxide bio-decontamination cycle development and subsequent re-qualification.
LAY ABSTRACT: Pharmaceutical product manufacture is performed in controlled cleanroom and closed chamber environments (isolators) to reduce the risk of contamination. These environments undergo regular decontamination to control microbial contamination levels, using a range of methods, one of which is to vaporize hydrogen peroxide (a chemical disinfectant) into a gas or an aerosol and disperse it throughout the environment, killing any microorganisms present. Biological indicators, which consist of a small steel coupon carrying a population of bacterial spores that are more resistant to hydrogen peroxide than are most microorganisms, are placed within the environment, and then tested for growth following treatment to ensure the process was effective. Confirmation of growth/no growth (and therefore hydrogen peroxide cycle efficacy) can take up to 7 days, which significantly increases time and cost of developing and confirming cycle efficacy. This study tests whether a new technology which uses a robust enzyme, thermostable adenylate kinase, could be used to predict biological indicator growth. The study shows this method can be used to confirm hydrogen peroxide cycle efficacy, by predicting whether the BI is killed at a specific time point or not and results are obtained in a few minutes rather than 7 days. This potentially offers significant time and cost benefits.
- Hydrogen peroxide
- Isolator validation
- Decontamination monitoring
- Biological indicator (BI)
- Geobacillus stearothermophilus
- Thermostable adenylate kinase (tAK)
Introduction
Vaporized hydrogen peroxide decontamination is widely used in pharmaceutical production and healthcare facilities to reduce the levels of microbial contamination and control the risk of microbial transfer to products and patients (1⇓–3). Within the pharmaceutical industry it is often used to bio-decontaminate drug-processing isolators and cleanroom environments. Hydrogen peroxide is a well-characterized disinfectant; it works as an oxidising agent affecting many cellular targets (proteins, lipids, DNA) and is effective at killing a wide variety of microorganisms including spore-forming bacteria (4⇓–6). Despite differing mechanisms and process characteristics between systems (i.e., wet or dry, gaseous or condensing), as discussed by Coles (7), all hydrogen peroxide decontamination systems work on the principle of turning aqueous hydrogen peroxide into a vapour which then deposits on the facility to be decontaminated to form a uniform surface concentration of hydrogen peroxide sufficient to kill any pathogens present (8). For clarity, this study has used a wet/condensing system to generate and deliver hydrogen peroxide and we have termed this vapour-phase hydrogen peroxide (VPHP) cycles.
VPHP cycle parameters for each individual room or isolator need to be established on an individual basis to take into account volume, surface area, material, and equipment present. Validation of efficacy of the VPHP process is currently performed using biological indicators (BIs) consisting of Geobacillus stearothermophilus spores on small steel discs in Tyvek pouches (9). Commercially available spore discs are provided at different population sizes (typically 106 spores per disc) and with defined characteristics in terms of their decimal reduction value (D-value: time or dose required to achieve inactivation of 90% of a population of the test microorganism under stated dose conditions) (10).
Analysis of BI growth/no-growth requires a microbiology facility equipped with an incubator that operates at 55–60 °C and staff trained in interpreting the results, and can take up to 7 days to confirm a negative result. Elegant study design using large numbers of BIs are used to validate decontamination processes using an analysis of survival of BIs under different conditions, so-called fractional kill studies (11). It is also possible to enumerate the BIs, as carried out in this study, but this is labour-intensive process requiring skilled operators and is not practical to perform on a routine basis. BIs also have a reputation of being highly variable both within and between batches (11, 12).
Given these factors, BIs play a greater role in cycle development, validation, and revalidation than they do during routine monitoring of decontamination processes. Instead, routine monitoring often relies on using parametric release based on the accurate measurement of hydrogen peroxide concentration, temperature, and relative humidity, which can all affect the bactericidal activity of hydrogen peroxide deposited on surfaces.
In this study we evaluated the potential of a novel enzyme-based indicator system, thermostable adenylate kinase (tAK), to monitor the efficacy of the VPHP process. The tAK indicators have been previously used to monitor the efficacy of surgical instrument cleaning in automated washer disinfectors and detergent preparations (13⇓–15). The enzyme was originally isolated from a thermophilic bacteria, Sulfolobus acidocaldarius, growing in volcanic springs, meaning it has much greater resistance to heat and other physical processes, including oxidation, than conventional enzymes (16). In this context, the technology works by measuring the residual activity of the tAK remaining active after exposure to the VPHP decontamination process, the activity being measured as a function of ATP produced by the tAK enzyme using luciferin/luciferase-based bioluminescence assays.
Here we exposed both the BI and tAK indicator test pieces to multiple VPHP decontamination cycles in a laboratory isolator. Test pieces were removed at defined time points and both test pieces were enumerated to define remaining active populations. The inactivation of both the test pieces was then compared and correlated.
Materials and Methods
Test Indicators
Stainless steel discs (9 mm diameter) loaded with >1 × 10⁶ G. stearothermophilus spore suspension within Tyvek pouches were used as biological indicators (Mesa Laboratories, Chassieu, France). The manufacturer's quoted D-value was 1.0 min with a population of 2.3 x 10⁶.
Recombinant SAC (Sulfolobus acidocaldarius) tAK was expressed and purified from Escherichia coli as previously described (13). SAC tAK (0.8 mg/mL in 0.1% hog mucin carrier, 20% ethanol, 0.1% Tween 20) was applied as thin film spray 4-5 mm from the edge of continuous reeled polyester which was cut into 5 x 50 mm indicator strips and mounted in polypropylene holders (Protak Scientific Ltd., Surrey, UK). The consistency of the enzyme loading onto each indicator was tested using a quality control protocol, established at Public Health England, and sampled indicators had a coefficient of variance (%CV) of 7%.
Vapor Phase Hydrogen Peroxide (VPHP) Decontamination System
Decontamination was performed using a commercial VPHP system that pumps hydrogen peroxide through a nebuliser at 20 mL/min to generate a visible aerosolised hydrogen peroxide (fog) into a flexible film isolator (PFI Systems, Kiln Farm, UK). After a few minutes the aerosol evaporates and hydrogen peroxide condenses onto the isolator surfaces. The isolator contains glove ports for two operators and has the following dimensions: 0.98 m × 1.03 m × 1.0 m and total volume 1.01 m3.
Test indicators (three BIs and four tAK indicators for each time point tested) were placed next to each other at the base in the middle of isolator, which was then sealed. Thirty-three percent w/v hydrogen peroxide (Sigma Aldrich, Gillingham, UK) was added to the generator, which pumped and vaporized through a nozzle into the isolator chamber during a 3 min gassing phase. Following gassing, test pieces were removed from the isolator chamber at the following time points (0, 2, 4, 6, 8, 10, 12, and 14 min). Hydrogen peroxide concentration, percent relative humidity, and temperature were measured and recorded at each time point. After the final time point, indicators were removed from the isolator via the pass box. This experiment was repeated on six independent occasions. Following each cycle, the flexible film isolator was fully vented until the level of hydrogen peroxide reached less than 1 ppm. In order to remove test pieces from the cycle without opening the isolator, test pieces were dropped into liquid within the isolator at each time point, therefore quenching further inactivation. For BI coupons this was 5 mL of tryptic soya broth (TSB, Sigma Aldrich, Gillingham, UK) media in sterile glass universal with four sterile 3 mm glass beads. For tAK indicators this was a sample tube containing 450 μL ATP-SL assay reagent (Biothema, Handen, Sweden).
Measurement
All glass universal bottles containing BI coupons were placed in a universal rack with lids tightly closed and sonicated for 5 min within a water bath (Branson series 5510; 42 KHz, Bransonic, Danbury, CT, USA) to aid removal of spores from coupons. In addition to the exposed test piece samples, positive controls (BI coupons that were not subjected to the VPHP cycle) and negative controls (glass universals containing TSB and glass beads but without BI coupons) were also processed. Universal bottles were then removed from the water bath, placed into another tube rack and vortexed at 1500 rpm for 5 min (IKA Vibrax VWR, Lutterworth, UK). Samples were then transferred to a microbiological safety cabinet (Class II) and each sample was serially diluted in sterile TSB (1 in 10) to 10–4. Five hundred microlitres of the appropriate dilution for each sample was plated on trypticase soy agar (TSA; BioMérieux, Marcy-l'Étoile France]) in duplicate. TSA plates were then incubated aerobically for 48 h at between 55.4 °C and 56.3 °C, after which colonies were enumerated to calculate the recovered colony forming units per millilitre (cfu/mL).
tAK indicator tubes were loaded on a benchtop luminometer (Berthold, Bad Wildbad, Germany) and ADP reagent (Biothema) was injected into each tube already containing ATP-SL (Biothema), and the relative light units (RLU) were measured using a benchtop luminometer. Tubes containing no tAK indicator were also measured to define the background luminescence, and tubes with tAK indicators that were not exposed to H2O2 (untreated) were measured as positive controls.
Statistical Analysis
The colony-forming units (cfu) for each BI coupon was calculated by averaging the number colonies on both TSA plates. The cfu at each time point is the mean average of cfu from each of the three replicate coupons. For tAK indicators the RLU mean average of each of the four indicators at each time point was calculated. The total mean tAK and BI remaining and standard deviation (SD) for each time point are based on all values over the six cycles. A line of best fit and R2 value were also calculated based on the total mean for each indicator.
Variance was evaluated by calculating the %CV as 100 × SD/mean and 95% confidence interval is based on the standard error of the mean (SEM) × 1.96 *(based on all values over the six cycles). BI log kill was calculated as Log10 (value x) – Log10 (value y); where x is the value at 0 min (after gassing) and y is the value for any specified time point. The log kill values are based on the total mean BI cfu remaining values.
To correlate the relationship between BI and tAK indicator inactivation values the total mean tAK RLU values were plotted on the x-axis with the BI log kill values plotted on the y-axis and fitted against a four-parameter logistic line using statistical software (Sigma Plot 12, Systat Software Inc., US). Eight arbitrary tAK values spanning the assay range were entered into the calibration curve equation and the resulting BI cfu inactivation read from the y-axis (predict y from x). The calibration curve equation were replotted with total mean BI log kill values on the y-axis and upper and lower 95% confidence intervals (95% CI) tAK enzyme indicator (EI) values on the x-axis.
The calibration curve equation was also replotted with hypothetical BI log kill values on the y-axis and total mean tAK on the x-axis. The hypothetical BI values used to plot the curves assume a log-linear kill from 1.0E+06 to 0 cfu with BIs that have differing levels of resistance to hydrogen peroxide inactivation than those used in the current study.
Results
We have demonstrated previously that it is possible to use a luciferin-luciferase based assay for the quantification of purified tAK enzymes exposed to decontamination processes (13⇓–15), see standard curve in Figure 1. To evaluate whether the same is true for VPHP, six replicate decontamination cycles were performed on separate days using a commercial VPHP system, set up and operated within a laboratory flexible film isolator according to manufacturer's instructions. The tAK indicators were removed from a fixed position within the isolator and enzyme activity measured at time intervals as shown; each data point is the mean value for 4 replicate indicators with the error bars showing the standard deviation (Figure 2). The residual tAK enzyme activity measured at all time points is significantly above the lower limit of detection of the assay; defined as the value for the reagent only plus 3 standard deviations from the mean (data not shown) meaning the tAK indicator is capable of measuring a delivery of a dose of hydrogen peroxide well beyond the 6 log limit of the BI s used here.
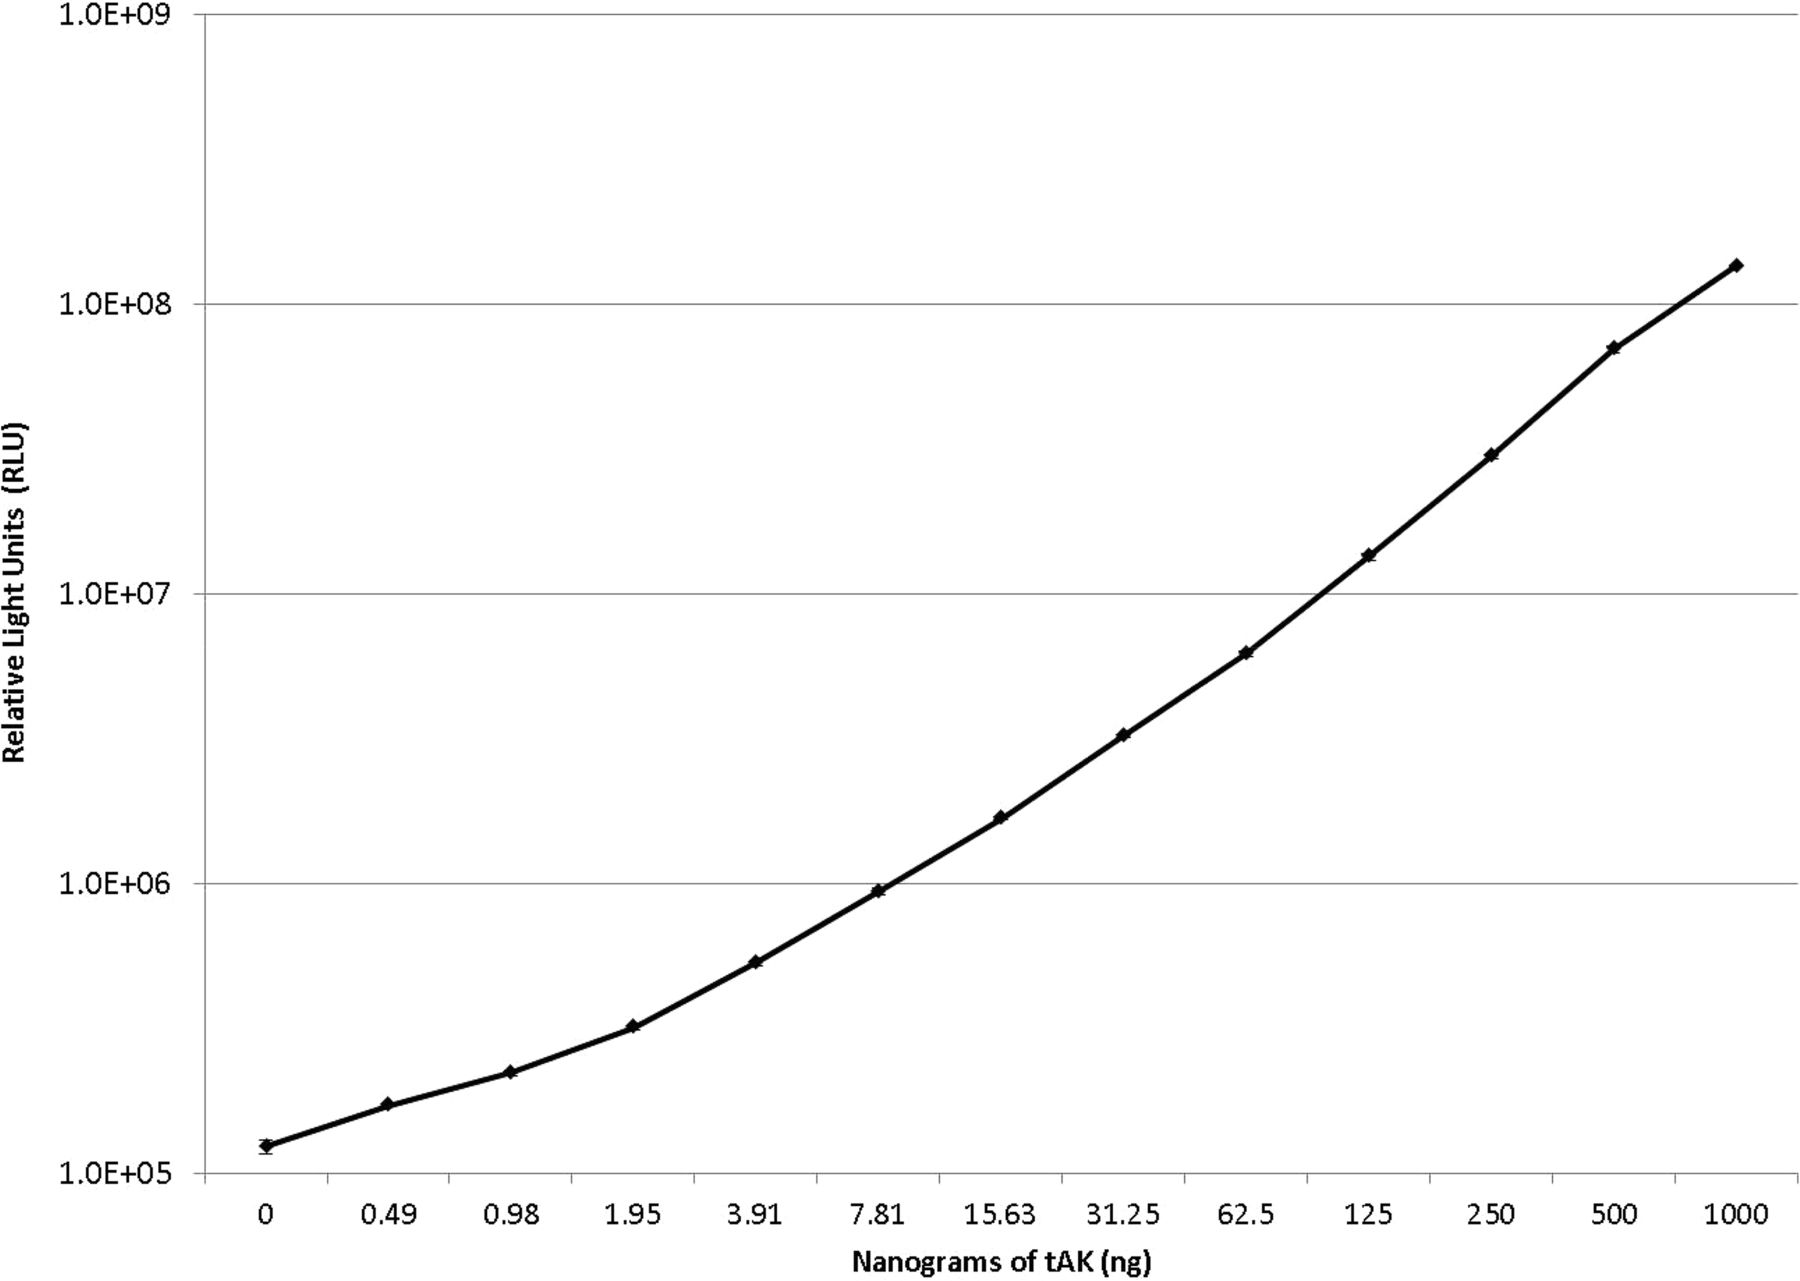
tAK Standard Curve. Liquid tAK was diluted to give concentration of 1000 ng/10μL and then serially two-fold diluted down to 0.488 ng/10 μL. Ten microlitre aliquots of each sample were added to three tubes per dilution and the luminescence (relative light units) read using the Lumat 3 luminometer (300 μL ATP-SL and ADP per tube—3 s read). Each data point represents the mean average of the three readings. Error bars represent standard deviation. The background signal (reagent only) was 1.24E + 05.

Residual tAK activity expressed as relative light units (RLU) following hydrogen peroxide exposure in a flexible film isolator. Residual tAK activity was measured at fixed time points throughout six replicate decontamination cycles. The data from each run were averaged (coloured bars) and a mean across all six runs was also determined (black bars). All data are shown plus or minus standard deviation. The power trend line is fitted on the basis of the total mean tAK value and has an R2 of 0.97. Where no bar is shown, tAK measurements were not taken.
Commercially sourced 6-log BIs were processed in the same hydrogen peroxide decontamination cycles as the tAK indicators (Figure 3). To provide greater understanding of the inactivation kinetics of the decontamination cycle, G. stearothermophilus spores were removed from the BIs after the decontamination process and the viable counts estimated based on the protocol outlined by Pottage et al (17). The method, which involves sonication of BI coupons in growth medium to remove spores, is likely to show some under-recovery of spores that are weakened by the decontamination cycle but would otherwise be viable. The BIs showed significant variation across the 6 decontamination cycles. The viable counts from the extracted spore discs were below the limit of detection of the BI enumeration assay (<5 cfu) within 6 min for some cycles, but were not completely killed within 12 min for other cycles. The average time taken to achieve a nominal 6-log spore kill was 10 min with a SD of 2.5 min (range 6–>12 min).

Time course of inactivation of Geobacillus stearothermophilus spore discs during replicate hydrogen peroxide decontamination processes. The survival of spores was estimated for 6-log BIs removed at the same time points as for the tAK indicators (Figure 2). Each data point represents the mean viable count for three individual BIs in each cycle with standard deviation shown. The average survival across all the replicate hydrogen peroxide processes was also plotted (black line) plus or minus standard deviation. The exponential trend line is based on the plot of the total mean cfu and has an R2 of 0.96.
The inactivation profile of the decontamination cycle was compared for both tAK and the BIs. The inactivation of both tAK and spores showed a biphasic response, with an initial linear phase of inactivation followed by a logarithmic reduction at later time points (Figure 4). The regression values for the curves are shown for either a single linear inactivation profile or the biphasic relationship. The biphasic fit shows a higher r2 value than the linear fit, suggesting that this is a more accurate representation of the actual BI inactivation process observed in the current study.
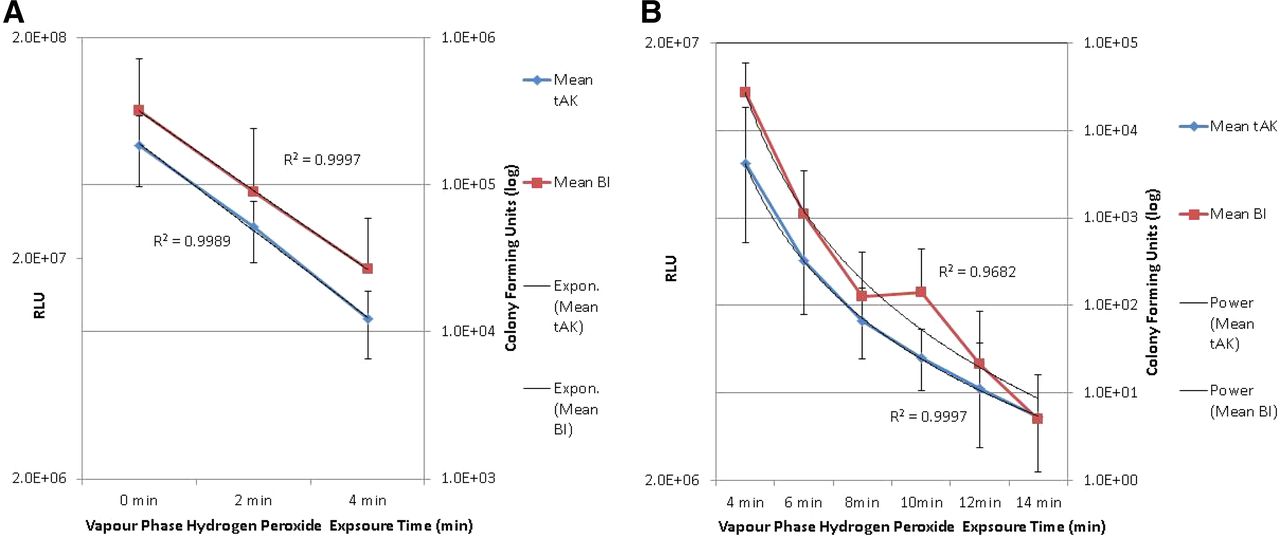
Comparing BI and EI inactivation profiles. Examination of the mean data across all the process runs suggested that there is a biphasic inactivation curve. Data were separated into two time periods, the first based on an initial phase of 0–4 min (A) and a second from 4 to 14 min (B). The initial phase shows a linear inactivation profile with very high regression values (R2 = 0.9989 and 0.9997 for tAK indicators and BIs, respectively). The second phase suggests an exponential relationship between time and inactivation, with R2 = 0.9997 and 0.9682 for tAK and BIs, respectively. These values were higher than those obtained for linear fits (BI for all samples R2 = 0.9598, BI 4–14 min R2 = 0.9308, tAK 4–14 min R2 = 0.9359).
To explore the ability to use the tAK enzyme activity as a surrogate measure of spore kill, we plotted the average values for the tAK activity and the mean bacterial kill across all six decontamination processes (Figure 5). For raw data see Supplemental Figure 1. Data were fitted against a four-parameter logistic line (predict y from x). To model the use of the correlation, eight arbitrary tAK values within the assay range were entered into the calibration curve equation, and log-reduction in BI viable count was read from the y-axis (see supplemental data). The data from these values were used to analyse how well the tAK value would predict the log kill from the BIs and to determine the confidence limits for any specific tAK value. The calibration curves were then replotted with the average tAK activity values ±95% CI; these are shown as dashed lines on Figure 5. These show the confidence limits of each predicted mean value widen as the predicted log reduction increases and the tAK RLU value decreases.

Establishing a correlation between tAK values and log kill of BIs. The average log kill values for all the BIs in the six decontamination processes were calculated as shown in Table S2. The tAK activity, again averaged across all indicator values for the six cycles as shown in Table S1, were expressed as RLUs and plotted on the x-axis, with the log kill data for the BIs plotted on the y-axis using Sigma Plot 12 analytical software. Data were fitted against a four parameter logistic line (predict y from x). To model the use of the correlation, eight arbitrary tAK values shown in Figure 5 (white dots with vertical dashed lines to the x-axis) within the range were entered into the calibration curve equation, and the BI cfu inactivation was read from the y-axis (horizontal solid black line).

Estimating the precision of predicting BI cfu inactivation for a given value of tAK. Eight arbitrary tAK RLU values were used with the calibration curve (4.0E+07, 2.0E+07, 1.0E+07, 8.0E+06, 6.0E+06, 4.0E+06, 3.0E+06 and 2.0E+06) to estimate the BI log kill values for given tAK indicator results. The mean value read (tAK and BI activity averaged over all six replicates) from the calibration curved is shown (solid line). The patterned lines represent the BI log kill values when upper (dotted) and lower (dashed) 95% confidence limits (standard error × 1.96) are applied to the mean tAK value and the correlation is replotted.
Discussion
The study evaluated whether tAK-based enzyme indicators could be used to monitor a hydrogen peroxide decontamination process and provide information that could be correlated with BI inactivation. Under the conditions used in the current study, we have shown that there is a strong correlation between the results obtained with the tAK and enumerated BIs, suggesting that this approach may be useful for providing rapid process monitoring information.
The study showed that the inactivation of the BIs was biphasic in the system used, rather than the textbook linear inactivation curve. This biphasic response in which the inactivation rate is slower and non-linear for the lower remaining fraction (i.e., last 102 spores in a 106 preparation) is referred to as “tailing” (18). The biphasic response and lack of uniformity in BI kill during VPHP processes can be caused by several different factors. The process itself is complex and its efficacy affected by a number of different environmental factors (i.e., materials). It is also technically challenging to inoculate a small disc with an even monolayer of 106 cfu spores without some form of spore overlap or encapsulation. The VPHP process also has a shallower depth of penetration than some other sterilization techniques (i.e., dry heat), therefore any spore overlap can worsen non-linear BI response. This difficulty in manufacture also leads to a wide range of D-values among different commercial BI batches, and this is exacerbated at higher spore numbers, which will be intrinsically more resistant to hydrogen peroxide than lower numbers (12).
Both indicators also showed variability within and between each cycle. The tAK indicators showed an average %CV between readings for each time point of 19% (range 7–66%); whereas variance for BIs was 96% (range 11–173%). Between each cycle (mean at each time point) the variance for tAK indicators was 26% (range 16–35%) and for BI 179% (range 81–296%). This variance can be attributed to a combination of variation in the cycle itself, the enumeration method, and variability in the BIs. The variance in the tAK indicators also reflects some of these factors, such as differences in the hydrogen peroxide process, but arguably the manufacture of the tAK indicators and the assay performance is much less variable and can be readily defined. It is not routine practice to enumerate the BIs, which are routinely scored as growth or no-growth, and enumeration undoubtedly contributed to the variance seen in the current study. The alternative is to perform fractional kill studies, and this method is commonly used to define and validate cycle parameters. These were not appropriate in the current study because the aim was to understand the detailed relationship between the tAK and BI inactivation profiles, across a time-course, rather than assuming a linear kill profile for the BIs.
The BIs used in this study have a quoted D-value of 1 minute, based on their testing under standard conditions (10) using 2 mg/L gaseous H2O2 a in a Biological Indicator Evaluator Resistometer (BIER) (19). The inactivation process used in this study took more than twice as long to deliver the same amount of BI kill, with a 6-log kill achieved after 12 min. To understand how the tAK indicators might be used in different hydrogen peroxide systems and with different BIs, we modelled the relationship between the tAK and three hypothetical BIs which were inactivated in a linear fashion approximately twice as fast, a similar rate, or half as fast as the ones used in the current study (Figure 6). This enabled the results of the tAK indicators to be tuned to equate to BIs with different D-values. Similar modelling could be used to predict the rate of inactivation of the tAK indicators in hydrogen peroxide processes that deliver higher concentrations of hydrogen peroxide to surfaces and/or to evaluate the effects of modifying other aspects of the decontamination cycle.
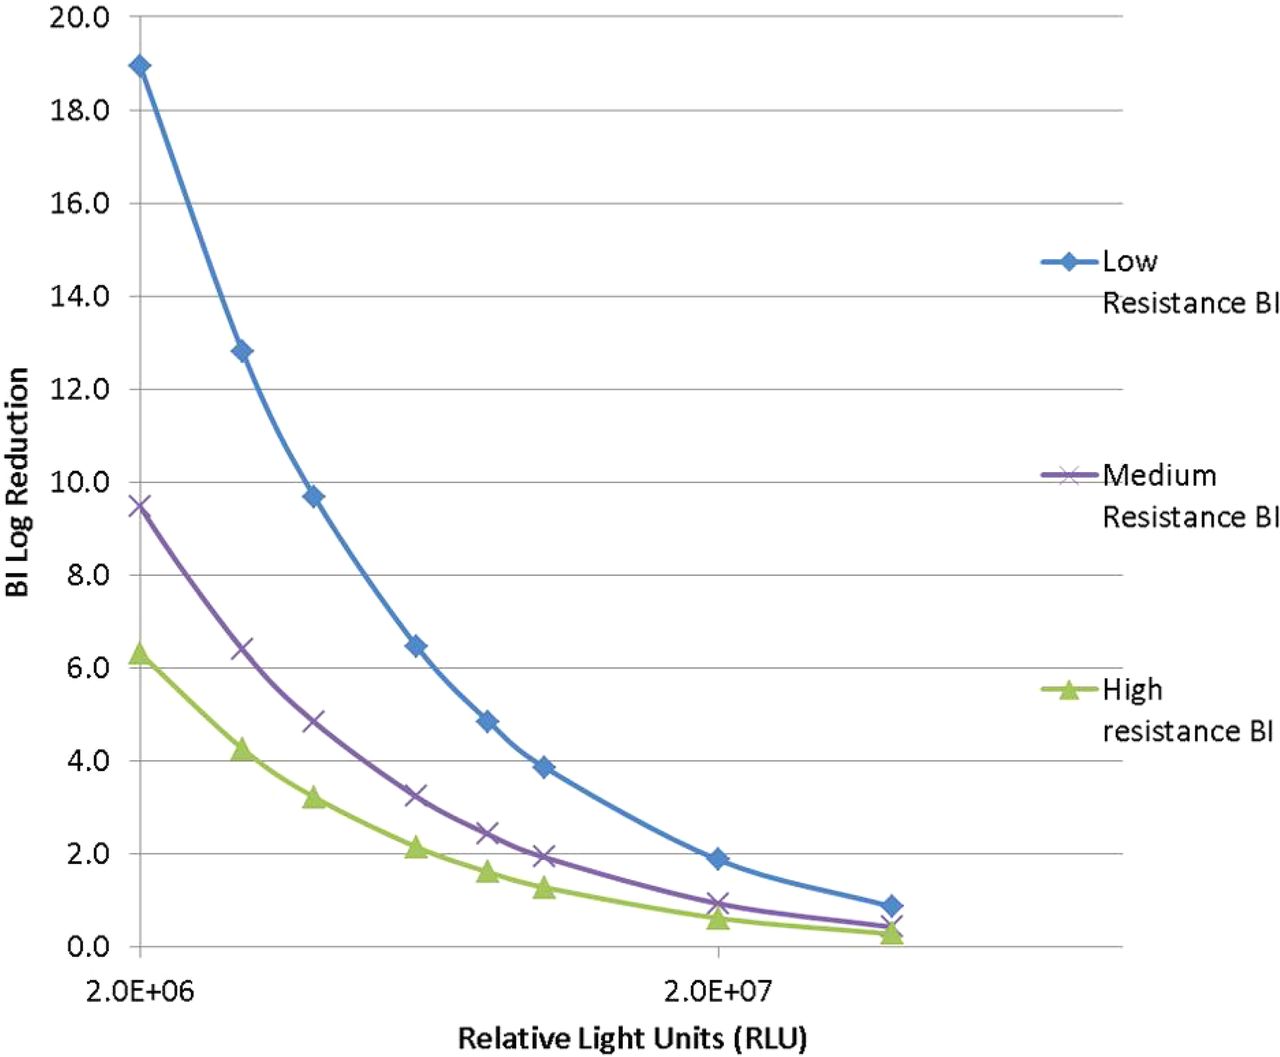
Estimating the hypothetical BI kill from a given value of tAK based on relative susceptibility to hydrogen peroxide. The log kill data for a hypothetical BI with different resistances [linear inactivation in 6 (low), 12 (medium), and 18 min (high)] to the same process were inputted into the 4-parameter logistic calibration curve shown used in Figure 5. This enabled us to compare the theoretical differences in predicted BI results, with different resistances, for the selected tAK values.
In conclusion, the data presented here demonstrate how tAK indicators could be used to provide near real-time information on process performance on completion of the decontamination cycle. As the read-out is fully quantifiable, this may allow more rapid development and validation of optimised decontamination cycles, significantly reducing the time required to set up robust systems. Further work will extend the evaluation to other commercial hydrogen peroxide decontamination systems, including those with different mechanisms for hydrogen peroxide delivery (e.g., dry systems), to confirm that the relationship between tAK indicators and BIs is robust and provides an accurate measure of performance in systems with different operating characteristics.
Conflict of Interest Statement
The tAK technology was invented at Public Health England (PHE). PHE will receive royalty and milestone payments on successful commercialisation of the technology. The sponsors played no part in the design of the study or in the interpretation of the data.
Table showing mean and statistical analysis values for tAK measurements. The mean tAK remaining, standard deviation (SD), and standard error of the mean (SEM) for each time point are based on all values over the six cycles. Percentage coefficient of variation (%CV) is calculated as 100 × standard deviation/mean. Ninety-five percent confidence interval is based SEM × 1.96.
Table showing mean and statistical analysis values for calculation of log kill for BIs. The mean number of bacteria remaining, standard deviation (SD), standard error of the mean (SEM), coefficient of variation (%CV) and 95% confidence interval are calculated as described in Table S1. Log kill was calculated as Log10 (value x) – Log10 (value y); where x is the value at 0 min (after gassing) and y is the value for any specified time point. The log kill values are based on the total mean BI cfu remaining values. Given hat there was no inactivation of BIs between no exposure and 0 min (after gassing), the starting value is taken as the 0 min value (3.22E+05).
Acknowledgments
This work was supported financially by Protak Scientific Ltd. The authors would also like to thank Dr. Tim Coles from Pharminox Isolation Ltd. for his input into the study analysis and for interpretation and guidance on the use of VPHP process monitoring and validation within the pharmaceutical industry.
- © PDA, Inc. 2017


