
Abstract
Subvisible particle formation in monoclonal antibody drug product resulting from mixing and filling operations represents a significant processing risk that can lead to filter fouling and thereby lead to process delays or failures. Several previous studies from our lab and others demonstrated the formation of subvisible particulates in mAb formulations resulting from mixing operations using some bottom-mounted mixers or stirrer bars. It was hypothesized that the stress (e.g., shear/cavitation) derived from tight clearance and/or close contact between the impeller and shaft was responsible for protein subvisible particulate generation. These studies, however, could not distinguish between the two surfaces without contact (tight clearance) or between two contacting surfaces (close contact). In the present study we expand on those findings and utilize small-scale mixing models that are able to, for the first time, distinguish between tight clearances and tight contact. In this study we evaluated different mixer types including a top-mounted mixer, several impeller-based bottom-mounted mixers, and a rotary piston pump. The impact of tight clearance/close contact on subvisible particle formation in at-scale mixing platforms was demonstrated in the gap between the impeller and drive unit as well as between the piston and the housing of the pump. Furthermore, small-scale mixing models based on different designs of magnetic stir bars that mimic the tight clearance/close contact of the manufacturing-scale mixers also induced subvisible particles in mAb formulations. Additional small-scale models that feature tight clearance but no close contact (grinding) suggested that it is the repeated grinding/contacting of the moving parts and not the presence of tight clearance in the processing equipment that is the root cause of protein subvisible particulate formation. When multiple mAbs, Fabs (fragment antigen binding), or non-antibody related proteins were mixed in the small-scale mixing model, for molecules investigated, it was observed that mAbs and Fabs appear to be more susceptible to particle formation than non-antibody-related proteins. In the grinding zone, mAb/Fab molecules aggregated into insoluble particles with neither detectable soluble aggregates nor fragmented species. This investigation represents a step closer to the understanding of the underlying stress mechanism leading to mAb subvisible particulate formation as the result of drug product processing.
LAY ABSTRACT: Mixing and fill finish are important unit operations in drug product manufacturing for compounding (dilution, pooling, homogenization, etc.) and filling into primary packaging containers (vials, pre-filled syringes, etc.), respectively. The current trend in adopting bottom-mounted mixers as well as low fill-volume filling systems has raised concerns about their impact on drug product quality and process performance. However, investigations into the effects of their use for biopharmaceutical products, particularly monoclonal antibody formulations, are rarely published. The purpose of this study is three-fold: (1) to revisit the impact of bottom-mounted mixer design on monoclonal antibody subvisible particle formation; (2) to identify the root cause for subvisible particle formation; and (3) to fully utilize available particle analysis tools to demonstrate the correlation between particle count in the solution and filter fouling during sterile filtration. The outcomes of this study will benefit scientists and engineers who develop biologic product manufacturing processes by providing a better understanding of drug product process challenges.
- Bottom-mounted mixers
- Monoclonal antibody
- LevMixer®
- Mobius® mixer
- JetMixer™
- Filter fouling
- Subvisible particles
- Rotary piston pump
1. Introduction
Mixing and aseptic filling are critical drug product manufacturing unit operations that likely involve unique equipment and operating systems. Bottom-mounted mixers (BMMs) are becoming a preferred mixing tool in aseptic drug product production because they offer advantages by way of low risk of contamination, ease of use, and ability to accommodate low minimum mixing volume (1, 2). In combination with single-use bags, bottom-mounted mixing systems are gaining increasing interest in the pharmaceutical/biopharmaceutical industry and are replacing their non-disposable counterparts in newer fill-finish manufacturing facilities (1, 3). Liquid filling can be achieved by a variety of filling mechanisms, such as peristaltic pump, piston pump, diaphragm pump, time-pressure filling system, etc. Each mechanism/system has its own pros and cons for filling protein formulations. In general, both mixing and filling processes may render different types of stress to protein molecules and pose potential risk to protein degradation.
We previously assessed the performance of several BMMs in mixing a variety of monoclonal antibody (mAb) formulations (4). Our findings revealed that despite overall good mixing performance, some BMMs resulted in protein subvisible particulates (SvPs), which could subsequently foul the filtration membrane during aseptic processing and cause major manufacturing disturbances, delays, or even loss of a formulation batch. The impeller designs of the BMMs were found to play a critical role in SvP formation. We concluded that impeller/drive unit coupling with tight clearance or close contact should be avoided, and we presented a hypothesis suggesting that in a tight clearance/close contact space, significant shear stress and cavitation might occur and lead to protein degradation (4).
Furthermore, a small-scale mixing model utilizing magnetic stir bars corroborated the finding in the BMMs as well as the “tight clearance/close contact” hypothesis (4). mAb aggregation (soluble and insoluble) caused by stirring using a magnetic stir bar was previously reported by Mahler et al. (5) and Kiese et al. (6). Stirring stress resulted in both visible particles and SvPs. Although a sufficient amount of Polysorbate 20 rendered a protective effect during stirring, SVPs of small sizes were particularly difficult to protect from forming even at high Polysorbate 20 concentrations (6). This observation is consistent with our report that 99% of the particles generated in BMMs with tight-clearance impeller/drive unit coupling are ≤2 μm in size even in the formulation with an optimized amount of surfactant (4).
The role of tight clearance and close contact, however, was not differentiated in the previous study because most of the mixing systems contained both features. The objective of this study was to further investigate the root cause and mechanism of SvP formation upon mixing by evaluating additional manufacturing-scale mixing systems as well as refined small-scale models. The breadth of mixer systems/designs assessed in this study is broad, so it may allow us to draw a more general conclusion to determine whether the tight clearance or close contact is a necessary condition for protein SvP formation.
The small-scale mixing model developed previously (4) was further refined in this study to closely mimic manufacturing-scale BMMs. The current work was aimed to (1) further investigate the relationship between the extent of tight clearance/close contact and SvP generation and (2) investigate the sensitivity of a broad range of protein and mAb molecules to SvP formation under grinding stress. The overall outcome could confirm if stress-derived solid/liquid interfacial action is the root cause of protein SvP formation and help us understand whether protein types play a role in this SvP generation mechanism.
The type of the stress responsible for SvP formation within the tight clearance or upon close contact is difficult to evaluate because several stress types may act on the protein simultaneously. Kiese et al. (6) hypothesized that stirring may generate different types of stress including shear, interfacial effects (between the Teflon® of the stir bar, the glass beaker/flask, and the antibody), cavitation, and local thermal effect due to friction between the stir bar and glass bottom of the vial. They attributed SvP formation during stirring to all of these stress types without direct experimental evidence. Although we previously attributed the root cause of mAb SvP formation in BMMs (4) to shear/cavitation effects (7) rather than heterogeneous nucleation (8), direct evidence is also lacking. Thomas and Geer (9) performed a comprehensive review on the effects of shear on proteins in solutions. Their analysis suggested that protein degradation/aggregation induced entirely by mechanical shear is unlikely, while mechanical shear coupling with other factors, such as stresses from air-liquid interfaces, liquid-solid interfaces, cavitation, etc., is the more likely root cause of protein aggregation. The study presented herein will lay a foundation for future investigation into this area, particularly for mAbs.
In this study, mixed protein solutions were characterized using particle count analysis, size-exclusion high-performance liquid chromatography (SEC-HPLC), and analytical ultracentrifugation sedimentation velocity (AUC-SV) for soluble aggregates and filtration rate (or filter fouling). Two types of particle analysis were used: light obscuration (HIAC Royco) and Coulter Counter. The filtration rate data were interpreted using the Vmax model to establish the correlation between the tendency of filter fouling (Vmax) and particle count.
2. Materials and Methods
Small-scale and large-scale experiments were performed to mix the following:
solutions of high-concentration sucrose (55% w/w) with green food dye (NEON! Food Color and Egg Dye, McCormick & Company, Inc., Hunt Valley, MD) to determine the mixing efficiency of each mixer; and
seven protein formulations (Table I) to determine the impact of mixing on product quality and process performance: five mAb formulations (mAb A, B, C, D, and E; Genentech, Inc., South San Francisco, CA); two fragment antigen binding (Fab) proteins (Genentech, Inc.); and two non-mAb-related proteins, bovine serum albumin (BSA; SeraCare Life Sciences, Milford, MA) and tissue plasminogen activator (tPA; Genentech, Inc.). These proteins except for BSA were tested in their optimized formulations containing different protein concentrations and buffering systems with different excipients such as sodium chloride, arginine salt, sucrose, or trehalose. These formulations also contained surfactant if it was determined to be needed in the final formulation. BSA was formulated with the same excipients and at the same concentration as mAb E.
Monoclonal Antibody and Protein Formulations Used in Mixing Experiments
2.1. Mixing Experiments
2.1.1. Mixing Experiments in At-Scale Mixers:
The characteristics of the mixers used in these experiments are shown in Table II, and brief descriptions of each are provided as follows:
JetMixer™ (Pall Corp., Port Washington, NY) with a 50 L disposable bag/biocontainer containing a magnetically impelled turbine secured to the bottom center. The turbine works like a centrifugal pump by drawing liquid in vertically and expelling it horizontally along the bottom, through specifically designed outlets, toward the corners of the biocontainer.
Custom Lightnin® Mixer, which has a top-mounted agitator and a bottom-mounted magnetically driven agitator assembled in the same 8 L stainless steel vessel, which has a diameter of 8 in. The top-mounted agitator is a Lightnin® axial-flow impeller (MINI-CIP A310, SPX Flow Technology Systems, Inc., Buffalo, NY) with a 2.5 in. diameter and a power number of 0.3. The Lightnin® bottom-mounted mixer (MagMixer Model MBI205, SPX Flow Technology Systems, Inc.) has a 3 in. diameter and a power number of 0.65. Rotation of the impeller is magnetically driven via a Hyper-Flo™ bearing (steel beads).
Three impeller-based mixers, Mavag Mavadrive™ Mixer (Mavag AG, Germany), LevMixer® (Sartorius Stedim Biotech, Aubagne, France), and Mobius® Mixer (Millipore Corporation, Billerica, MA), which were described previously (4).
Mixing Type and Mixer Design
2.1.2. Small-scale Mixing:
Four types of Teflon-coated magnetic stir bars were used (Table II): SB1 (a standard stir bar measuring 9.66 mm in diameter and 50.96 mm in length); SB2 (an SB1 stir bar with a plastic ring positioned at the center of the bar to increase its diameter to 10.43 mm and reduce the surface contact); SB3 (a stir bar measuring 7.97 mm in diameter and 38.11 mm in length riding in a tri-stand and held in place by a pin that was inserted into pin holes at the top and bottom plates of the stand and through the bar); and SB4 (an SB1 stir bar assembled as a top-entry configuration). The mixing containers were 500 mL glass Erlenmeyer flasks or beakers with flat inner bases. Each protein/mAb formulation (200 mL that had been prefiltered using a 0.22 μm bottle-top filter system; Corning Vacuum Filter; Corning, Inc., Lowell, MA) was added to each container along with a stir bar. Multiple mixing containers could be placed simultaneously on a POLY 15 magnetic multipoint stirrer (Thermo Scientific, Waltham, MA) and stirred for 2 h at 180 rpm. Samples were taken prior to and after mixing for 1 h and 2 h.
2.1.3. Mixing Time Experiment:
To determine the mixing time in any manufacturing-scale mixer, a predetermined volume of the sucrose solution was filled in the bag/container of the mixer. The respective mixing speed was set, and the dye was poured into the solution from a 5 mL glass vial. The procedure, thereafter, has been reported previously (4).
2.2. Shear Experiments
Three rheometer configurations serving as small-scale shearing models were used to evaluate the impact of different stress mechanisms potentially associated with mixing:
Double-Gap Rheometer: Anton Paar rheometer fitted with a double-gap cylinder stainless steel measuring system (DG26.7). Analysis was performed using Rheoplus software (Aanton Paar GmbH, Austria).
Cone-Plate Rheometer: AR-G2 magnetic bearing rheometer fitted with a 1° cone stainless steel geometry measuring system (cone-plate configuration). Analysis was performed using Rheology Advantage software (TA instruments, New Castle, DE).
Flat-Plate Rheometer: AR-G2 magnetic bearing rheometer fitted with a flat plate stainless steel geometry measuring system (plate-plate configuration). Analysis was performed using Rheology Advantage software (TA instruments, New Castle, DE).
In all cases, sample temperature was maintained at 25 °C during testing.
2.3. Product Quality and Process Performance Characterizations
2.3.1. Particle Analysis Was Performed Using Light Obscuration and Electrical Sensing Zone Principle:
Light obscuration measurements were performed using a HIAC Royco Liquid Particle Counting System (Hach Company, Loveland CO) following the same procedures reported previously (4).
Electrical sensing zone principle particle analysis by Coulter Counter® Multisizer 4 (Beckman Coulter, Inc., Fullerton, MA) following the same procedures reported previously (4).
2.3.2. The Quantitation of Size Variants for mAb A Was Determined by SEC-HPLC and AUC-SV. mAb E Was Also Assessed Using SEC-HPLC:
SEC-HPLC: The analysis utilized a G3000SWXL column, 7.8 mm ID × 30 cm, 5 μm (TOSOH BioScience, King of Prussia, PA) run on a HPLC system (Model 1200, Agilent Technologies, Santa Clara, CA). The mobile phase was 0.2 M potassium phosphate and 0.25 M potassium chloride at pH 7.0 for mAb A. The chromatography was run isocratically at a flow rate of 0.5 mL/min for 30 min. The column temperature was maintained at ambient temperature, and the eluent absorbance was monitored at 280 nm. The mAb A sample (20 μL) was injected directly without dilution. The same method was used for analysis of mAb E except that the samples were diluted to 10 mg/mL using formulation buffer, and 20 μL of sample (∼200 μg) was injected.
AUC-SV: Experiments were conducted using an Optima XL-I analytical ultracentrifuge (Beckman Coulter, Indianapolis, IN), equipped with absorbance optics. Samples at 0.7 mg/mL in formulation buffer were loaded into the sample sector of two-channel sedimentation velocity 60k 12 mm graphite-filled Epon centerpieces, with formulation buffer in the reference sector. Samples were equilibrated to 20 °C for at least 1.5 h prior to starting the run and were then centrifuged at 40,000 rpm, collecting scans at 280 nm in continuous mode with a 0.003 cm radial step size. Data were analyzed using the continuous c(s) model in SEDFIT v14.1 (10) with a confidence interval of 0.68. The measured buffer density and viscosity of the buffer and the protein partial specific volume calculated from the amino acid sequence using SEDNTERP (v1.09) were held constant in the fit.
2.3.2. Filtration: The Experimental Setup and Filtration Procedures Using a 0.22 μm Filter (Millipore Corp., Billerica, MA) Were Described Previously (4).
3. Results and Discussion
Four impeller-based BMMs (Mavag Mavadrive™ Mixer, Magnetic Mixer, LevMixer®, and Mobius® Mixer) were previously assessed (4). In that study, mixing mAb formulations in the Mavadrive™ Mixer and Magnetic Mixer yielded a large number of SvPs, while mixing in the LevMixer® and Mobius® Mixer did not cause significant SvP formation. The root cause was attributed to the design and function of the impeller/drive unit assembly. The Mavadrive™ Mixer has a tight clearance (gap) between the impeller and the drive unit. When coupled, the impeller and the drive unit are actually in contact via their respective ceramic bearing. The gap between the impeller and the drive unit bearing is estimated to be 0.035–0.040 mm. For the Magnetic Mixer, when the impeller and the drive unit are coupled, they are in contact with a number of ceramic beads, which serve as bearings when the impeller rotates. In both cases, a high shear zone created within this narrow gap was hypothesized to be the cause for SvP formation. In contrast, the LevMixer® and Mobius® Mixer featured a much wider gap (e.g., several millimeters) between the impeller and the drive unit, which did not come into contact during rotation. In both cases, the impeller was levitated away from the drive unit via superconductivity or magnetic repulsion. A few experiments below were aimed to further corroborate this finding through a series of small-scale and manufacturing-scale studies on multiple protein and mAb formulations.
3.1. Comparison of Top-Mounted versus Bottom-Mounted Mixing
A custom Lightnin mixer (Table II) equipped with both top-mounted and bottom-mounted impeller-based mixing units was used to mix 3 L of mAb C formulation. The bottom-mounted impeller is coupled to the stationary drive unit. Rotation of the impeller is magnetically driven via the Hyper-Flo™ bearing (steel beads), which is similar to the Magnetic Mixer as described above (4). The top-mounted impeller is fixed to, and rotates together with, the shaft (i.e., no tight clearance or contacts between the impeller and the shaft). Two separate experiments were performed using either the top-mounted impeller or the bottom-mounted impeller under the identical mixing conditions: 150 rpm for 1 h. Samples at 0, 0.5, and 1 h were evaluated for filtration and SvP analysis. The results are summarized in Figure 1. Significant filter fouling was observed for the mAb solution mixed by the bottom-mounted impeller, while there was no indication of fouling for the same mAb solution mixed by the top-mounted impeller. This observation is consistent with SvP count data. After 1 h mixing, a high particle count (>1.00 × 10⁵ particles/mL) was detected by the Coulter Counter® in the mAb C solution mixed by the bottom-mounted impeller, while the solution mixed by the top-mounted impeller contained particles (∼3.00 × 10² particles/mL) only slightly higher than the unmixed control solution (7.00 × 101 count/mL). Differences in the particle count between the control and the material mixed with a top-mounted mixer is within assay variability.

Filtration profiles and particle count analysis for mAb C formulation mixed in a custom mixer with both top-mounted and bottom-mounted capability (150 rpm for 1 h).
This side-by-side comparison excluded the possibility that the bulk mixing itself (mechanical stress by tips of the blades + air-liquid interfaces) generated SvPs from this particular mAb formulation and could clearly relate the mixing mechanism of the bottom-mounted mixer to SvP formation. As the steel beads (Hyper-Flo™ bearing) were magnetically activated and rotated against the drive unit, the impeller rotated. This impeller/drive unit features close contact/tight clearance between the rotating beads and the stationary drive unit. The function of the steel-bead bearing is identical to the ceramic-bead bearing associated with the Magnetic Mixer, which was determined to be one of the worst mixers as it relates to protein particle formation (4).
3.2. Mavag MavadriveTM Mixer
The Mavag Mavadrive™ mixer is another BMM studied previously (4), which also generated a substantial amount of SvPs upon mixing mAbs. The impeller design of this mixer features magnetic coupling of an impeller and the drive unit (Figure 2a). The impeller rotates against the ceramic bearing of the stationary drive unit with a very tight gap of 0.035–0.040 mm in between. In this study, we performed a series of experiments using the same mixer but with modified impeller designs to understand the impact of this tight gap on SvP formation. A bladeless impeller design, shown in in Figure 2b, eliminates all three blades for the purpose of dissociating the shear stress rendered by the blades from the mixing process. Figure 2c shows a divider made of a clear plastic cylinder that was inserted at the top of the bladeless impeller/drive unit coupling. This configuration can divide the liquid in the mixer into two separate reservoirs: an inner reservoir (solution inside the plastic cylinder) and an outer reservoir (solution outside the plastic cylinder). This configuration allows the solutions in the two reservoirs to be evaluated separately, as this clear cylinder permits a visual assessment of any changes in the solution being tested.

Photographs of (a) the Mavag Mavadrive™ Mixer's impeller-drive unit assembly, (b) a modified Mavag bladeless impeller, (c) the Mavag bladeless impeller with a plastic cylinder inserted to divide the mixing zone into inner and outer reservoirs, (d) green dye solution in the inner reservoir, (e) after 1 h mixing of mAb A solution in the inner reservoir, (f) appearance of mAb A samples taken from the outer and inner reservoirs, and (g) the foamy mAb A solution after 1 h mixing using the standard Mavag mixer (impeller with blades).
In the first set of experiments, 10 mL of a green food dye solution and 2.5 L of filtered deionized water were added to the inner and outer reservoirs, respectively (Figure 2d). The bladeless impeller was rotated at 200 rpm for 1 h and followed by rotation at 356 rpm (maximum speed of the system) for 1 h. Water samples taken from the outer reservoir were tested by UV spectroscopy and showed no presence of dye. The same observation was noted when the green-dye-containing solution was added to the outer reservoir and pure water to the inner reservoir. This outcome suggests that <1% (if any) of liquid flows through the tight gap.
The second set of experiments involved mixing the mAb A solution using three different Mavag mixer configurations: the standard impeller with blades (Figure 2a), a bladeless impeller (Figure 2b), and the bladeless impeller with a cylinder divider (Figure 2c). This was done to compare the relative impact of mixing rendered by the blades and the tight gap between the impeller and the drive unit. All mixing experiments were performed on the mAb A solution at 200 rpm for 1 h. As expected, mixing with the impeller without blades is not effective, as there was not much movement. Thus, samples for analysis were taken from areas close to and away from the impeller in case the solution was not homogeneous, but no significant difference was observed between the two samples. On the contrary, the impeller with blades resulted in mixing that was not only highly turbulent but also very foamy (Figure 2g). However, SvP count data, as summarized in Table III, showed no obvious difference in particle count between the impeller with and without blades. It suggested that turbulence and air-liquid interfaces (foams) generated by blades have no impact on mAb SvP formation.
Particle Count Analysis by Coulter Counter of mAb A Solution after Mixing at 200 rpm for up to 1 h in a Mavag Mavadrive™ Mixer with Different Impeller Designs
In the mixing experiment involving the bladeless impeller and a cylinder divider, the inner reservoir contained 10 mL and the outer reservoir 2.5 L of mAb A solution. With mixing, the solution in the inner reservoir turned increasingly turbid over time (Figures 2e and 2f), whereas the solution in the outer reservoir remained slightly opalescent (similar to the control). The solution post-mixing using the impeller with blades (Figure 2a) as well as using the bladeless impeller without the cylinder divider (Figure 2b) also remained slightly opalescent (similar to the control; picture not shown). The particle count of the solution in the inner chamber (Figure 2e) after mixing for 1 h was 2.77 × 10⁷ particles/mL (Table III). This particle count is exaggerated because the volume of the liquid in the inner reservoir is 250 times lower than that in the outer reservoir (10 mL vs 2500 mL). After volume correction (250× dilution with mixed solution from the outer reservoir), the measured particle count was 2.60 × 10⁵ particles/mL, which is still more than 10 times higher than the particle count of the solution in the outer reservoir (Table III). In addition, this particle count is comparable to that of the solution in mixing experiments without the cylinder divider. In Table III, the change in SvP relative to t = 0 (average particle count after mixing for 1 h ÷ average particle count in mAb A at t = 0) is also presented to demonstrate significant increase in SvP for solution within the inner reservoir (ratio of 1471) versus outside the reservoir (ratio of 1). This set of experiments implied that the shear zone located at the top portion of the impeller and the drive unit coupling area is responsible for mAb SvP formation, while the mechanical turbulence and the air-liquid interfacial stress generated by impeller rotation play only a minor role, if any.
3.3. JetMixerTM Mixing Studies
The JetMixer™ mimics the function of a centrifuge pump via a magnetically impelled turbine secured at the bottom center of the biocontainer (Table II). A closer examination of the turbine design reveals that the impeller is actually a magnetic stir bar rotating against the bottom of the biocontainer. As the stir bar rotates, it draws the fluid in vertically and expels it horizontally along the bottom.
The performance of the JetMixer™ was compared with two previously assessed impeller-based BMMs (LevMixer® and Mobius® Mixer). All three mixers have very different mixing mechanisms/designs/dimensions/configurations (Table II). Thus, constant tip speed was applied to each impeller-based mixer to simplify the comparison. The tip speed of the impeller was calculated by πDN, where N is rotation per minute and D is impeller length in meters. Table IV summarizes the calculated rotational speed (rpm) of each mixer at low and high tip speeds (0.84 and 1.37 m/s, respectively), which was established previously (4).
Experimental Design for Various BMMs: Operating Parameters and Ranges
The worst-case strategy was applied to determine the mixing time in each of the 50 L mixers using low mixing speed, high volume (45 L), and high viscosity (25 cP for 55% w/w sucrose solution). Green dye was added to the top of the solution at the beginning of mixing, and its concentration was monitored by UV spectrophotometry. Mixing time was determined when UV readings reached a constant absorbance and dye homogeneity was confirmed by visual observation. Mixing time results for all three mixers are shown in Table IV. Mixing time increased following the order of LevMixer® (<1 min), JetMixer™ (10 min), and Mobius® Mixer (85 min).
The impact of the JetMixer™ on SvP formation when mixing the mAb A formulation (up to 8 h using the mixing conditions summarized in Table IV) was assessed and compared with the LevMixer® and Mobius® Mixer. SvP count of the solution in the JetMixer™ increased with mixing time, whereas no obvious SvP count increase was detected in the LevMixer® and Mobius® Mixer (Table V) even after mixing for 8 h. The change in SvP relative to t = 0 in the table clearly suggested this trend. As the stir bar of the JetMixer™ (Table II) is rotated at the bottom of the biocontainer, it is in direct contact with the flat surface of the biocontainer and presents another example that supports the hypothesis that tight clearance/close contact is the cause of particle formation.
Particle Count Analysis by Coulter Counter of mAb A Formulation upon Mixing in Three BMMs Using the Mixing Conditions Listed in Table IV
3.4. Small-scale Mixing Model
3.4.1. Impact of Stir Bar Design:
The mAb A formulation was mixed at 180 rpm using the four stir bars described in the section summarized in Table II for up to 2 h. Samples were taken at 0, 1, and 2 h and analyzed for particle count using a Coulter Counter. The results in Table VI indicate that mixing using SB4 resulted in the lowest SvP count compared with mixing using SB1, SB2, or SB3. The impact of stir bar design on SvP formation follows the order of SB1 > SB2 > SB3 > SB4, which correlates with increasing surface area between two surfaces where one surface moves closely against the other. Change in SvP relative to t = 0 calculated in Table VI also suggested the same trend.
Particle Count Analysis by Coulter Counter of mAb A Formulation Mixed in Small-Scale Study Using Various Stir Bar Designs (200 mL Solution in 500 mL Glass Flask or Beaker under 180 rpm for up to 2 h)
In addition, the stir-bar-mixed solutions were filtered. Filtration profiles allowed filter fouling to be quantified based on the gradual pore-plugging model that allows determination of Vmax, or Mmax if filtrate weight is monitored, using the equation: t/mt = t/Mmax + 1/Ji, where t is filtration time, mt is filtrate weight at a given time, Mmax is filtrate weight at infinite time (maximum capacity), and Ji is initial mass filtration rate.
Figure 3 summarizes the filtration profiles for mAb A formulation that was either not mixed (control) or mixed using one of the four stir-bar designs. Their respective Mmax was calculated and shown in Figure 3. Mixing by the top-entry stir bar (SB4) did not show any sign of filter fouling (i.e., its filtration profile overlaps that of the control). Filter fouling was observed during filtration of the solutions that had been mixed using the other three stir bar designs. The extent of fouling indicated by Mmax was consistent with the SvP count data (SB1 > SB2 > SB3).

Filtration profiles and Mmax values of mAb A formulation after mixing for 2 h at 180 rpm using four different stir bar designs: SB1 (standard stir bar), SB2 (standard stir bar with a ring), SB 3 (standard stir bar on a stand), and SB4 (top-entry stir bar).
This observation appeared to correlate with the increasing gap and/or decreasing contact of the stir bar with the bottom of the container. SB4 is a top-entry stir bar system that does not come in contact or produce a tight clearance with the bottom of the container. Although the SB3 stir bar system (a stir bar riding in a tri-stand) is away from the bottom of the container with no contact or tight gap, its mixing still induced some SvPs and eventually fouled the filter. The reason can be attributed to the pin that positions the bar in place within the tri-stand. As the pin rotated with the stir bar, there was close contact between the pin in the pin holes of the tri-stand and the bar. The contact area in this model is relatively smaller than SB1 and SB2, so the SvP count and the extent of fouling are lower than those of the SB1 and SB2 systems. The outcome of this study corroborated the hypothesis that supports tight clearance/close contact as the cause of SvP formation and likely suggested that close contact may play a more important role than tight clearance in protein particle formation during mixing (further discussed later).
3.4.2. Protein Type and Formulation Effect:
A wide range of protein formulations (Table I) were tested in this study, including five mAbs and four low-molecular-weight proteins. All proteins were formulated at different concentrations (2.5–200 mg/mL) and with various excipients (such as trehalose, sucrose, arginine salt, sodium salt, Polysorbate 20, etc.). These solutions were mixed in the small-scale model using SB1 and SB2 and assessed for filtration fouling and SvP count analysis. All control solutions (before mixing) showed a linear filtration profile (filtrate weight vs time) with different slopes, which might be caused by differences in molecular type, concentration, formulation, viscosity, etc. To normalize these differences relative to mAb A, a factor for each protein formulation was obtained by dividing the filtration rate of the particular protein formulation to that of the mAb A formulation (Table VII). The filtration rate of the mAb A formulation was 5.6 g/min. The normalized filtration profile for each mixed formulation showed different levels of filter fouling based on the Mmax value (Table VII). The level of filter fouling increases as the calculated Mmax decreases.
Mixinga of Various Protein Formulations in Small-Scale Study: Impact on Filter Foulingb and Particle Formation
Filter fouling was observed during filtration of all five mAb formulations after mixing using SB1 and SB2. Among the four low-molecular-weight proteins, two extremes of fouling were observed. The two Fab proteins (Fab A and Fab B) were highly sensitive to SvP formation (i.e., filter fouling) after mixing, at a level comparable to all mAb formulations, whereas the two non-antibody-related proteins, BSA and tPA, did not foul the filter at all and were stable against mixing. A greater impact of SB1 on filter fouling than that of SB2 was consistently observed in all formulations. The antibody-related molecules (five mAbs and two Fabs) were more susceptible to particle formation than the two non-antibody-related protein molecules upon mixing. The reason for the sensitivity of antibody-related molecules to SvP formation is not yet clear but it should be considered carefully when mixing mAb formulations. More antibody-related and non-antibody-related molecules/formulations need to be evaluated to expand the database before a more definite conclusion can be drawn on the relative sensitivity of these two types of molecules to the mixing stress.
There was no clear trend of filter fouling in relation to formulation excipient and protein concentration, whereas molecular types appeared to play a role. Note that formulations of all proteins except for BSA have been individually optimized to achieve a predetermined shelf life but are not necessarily optimized to sustain mixing stress. BSA was formulated in the same concentration and formulation as mAb E to evaluate the impact of the protein type. More mixing studies are ongoing to evaluate the impact of formulation and protein concentration.
3.4.3. Mixing Effect on Forming Soluble versus Insoluble mAb Aggregates:
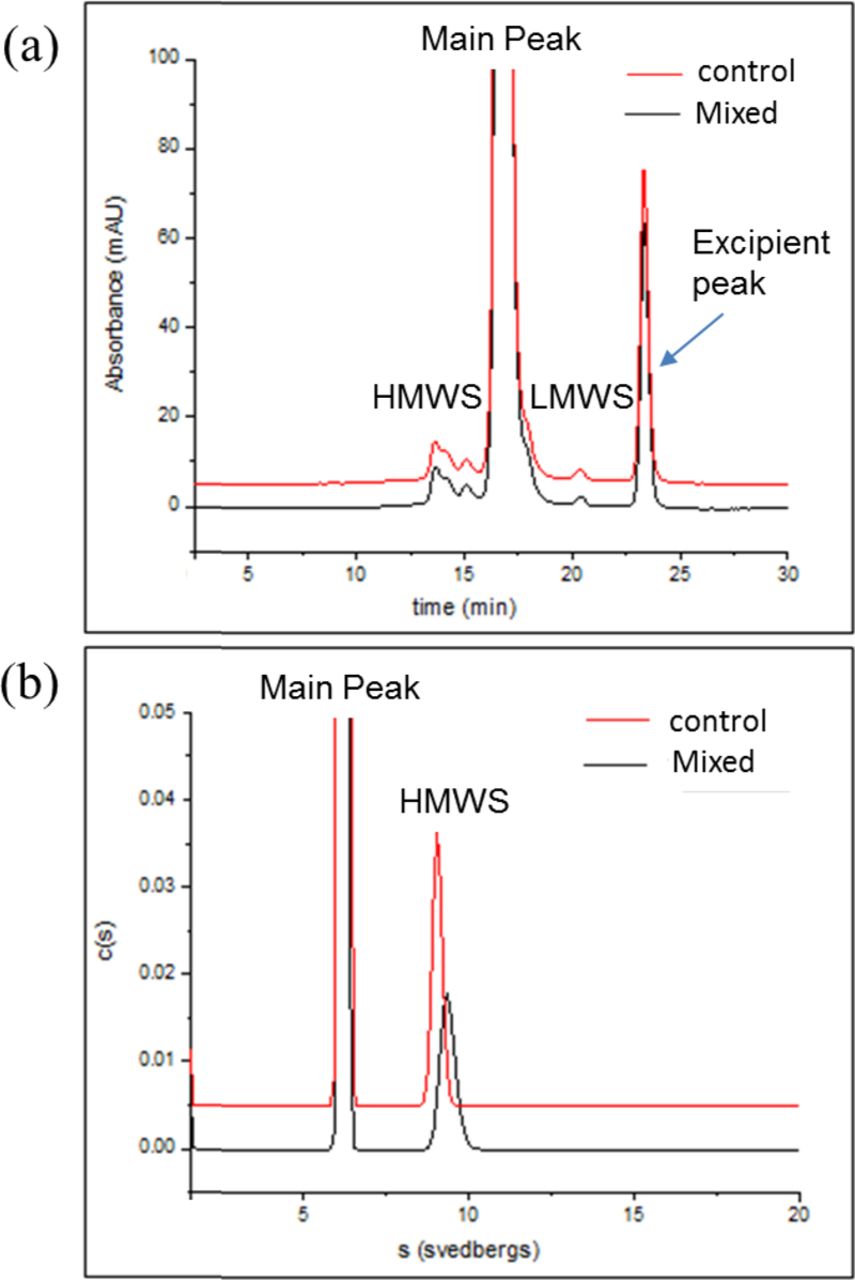
Antibody-related molecules formed SvPs (insoluble aggregates) upon mixing. Intuitively, insoluble aggregates are the result of continuing aggregation of soluble aggregates (e.g., dimers, trimers, oligomers, etc.). SEC-HPLC was used to analyze soluble aggregation on mAb A and mAb E formulations after mixing in the small-scale model using SB1. Surprisingly, no soluble aggregates were detected in either case, although the two mAb formulations formed a large amount of SvPs. This observation was previously reported (4, 6). The results were confirmed by SEC-HPLC and AUC-SV analysis for the mAb solutions mixed using the Mavag mixer configuration with a bladeless impeller and a cylinder divider (Figure 4). As discussed earlier, SvP counts were high in samples taken from the inner reservoir, while they showed a comparable level of soluble higher molecular weight species compared to the control sample both by AUC-SV and SEC. For SEC-HPLC, samples tested showed a main species eluting at approximately 17 min, consistent with monomeric antibody. A distribution of high molecular weight species (HMWS) eluting between approximately 12.5 and 15.5 min and low molecular weight species (LMWS) eluting at approximately 20.4 min were also observed and accounted for 1.8% and 0.2% of the total mass in each sample, respectively. AUC-SV analysis of mAb A control sample and mixed sample showed a main peak at approximately 6.2 s consistent with monomeric antibody and a HMWS peak at approximately 9.6 s, accounting for 1.5% of the total mass in each sample. This phenomenon appears to be general to antibody-related molecules. The cause of this phenomenon is not clear, although it is possible that mAb molecules are kinetically more favorable in forming large aggregates than small aggregates or the Coulter Counter is more sensitive in picking up submicron particles (insoluble aggregates) than SEC and AUC in detecting low levels of soluble aggregates.

Comparison of mAb A size variants before and after mixing using Mavag bladeless impeller with plastic cylinder divider at 200 RPM for 60 min by (a) SEC-HPLC and (b) AUC-SV. The results are from samples taken from the inner reservoir.
In a separate study, two formulations, mAb A and BSA, were recirculated and pumped through a rotary piston pump. SvP count was measured and plotted against the number of recirculations through the pump (Figure 5). Pumping through the rotary piston pump resulted in very high SvP count in the mAb A formulation where the number of SvPs increased with increase in the number of recirculations. The rotary piston pump also produced SvPs in the BSA solution but at a substantially lower rate compared with that in the mAb A formulation, which confirmed the previous finding that mAb molecules are more sensitive to SvP formation for the proteins tested.

Subvisible particle count of mAb A and BSA formulations as a function of the number of recirculations in a rotary piston pump.
It has been widely reported that protein SvPs form during rotary piston pump operation (7, 8, 11). The root cause of particle formation has been attributed to shear/cavitation within the tight clearance (7, 11) or heterogeneous nucleation of protein on microparticles/nanoparticles of foreign stainless steel materials shed from contacts of the piston and the housing (8). The former implied the contribution from tight clearance but the latter suggested the presence of contacts between the piston and the housing of the pump. The tight clearance is critical in ensuring accurate dosing of a given solution and can be compared to the gap observed in some BMMs with tight clearance between the impeller bearing and shaft bearing when engaged (e.g., Mavag Mixer). Inopportunely, in both cases, it's challenging to decipher the relative importance of tight clearance or close contact during mixing or filling as both are present.
3.5. Differentiation of Tight Clearance and Close Contact
Table VIII summarizes results from all BMMs and small-scale models and suggests that the presence of tight clearance (<5 mm gap), close contact, or both in the processing system is a necessary condition for mAb SvP formation. However, in none of these systems, except for LevMixer® and Mobius® Mixer, can one differentiate these two factors. LevMixer® and Mobius® Mixer contained a 3–4 mm gap but no contact between the impeller and the container bag surface (sitting above the drive unit) and produced no mAb SvPs. Although it may imply the relative importance of close contact to tight clearance, the impact of a very narrow gap (e.g., <1 mm) on SvP formation still cannot be ruled out. Thus, additional small-scale models such as three rheometer designs were evaluated.
Summary of Potential Cause of Protein Particulate Formation by Tight Clearance and/or Close Contact in Different Drug Product Processing Systems
3.6. Rheometer Models
Rotational rheometers are high-precision, continuously variable shear instruments in which the test fluid is sheared between a moving surface and a static surface found in double gap/concentric cylinders, cone and plate, or plate and plate, under controlled-stress or controlled-rate conditions. Three rheometer geometries offering various levels of surface area and gap between the two surfaces (i.e., double-gap, cone-plate, and plate-plate) were tested in this study. The gap between the rotating and the stationary surfaces was either fixed (double-gap) or adjustable (plate-plate and cone-plate). Unlike the Mavag impeller/drive unit assembly, these surfaces did not contact each other.
3.6.1. Double-gap Rheometer:
The double-gap configuration (Table IX) is useful for low-viscosity fluids because it increases the total surface area, and therefore the viscous drag, on the rotating inner cylinder and generally increases the accuracy of the measurement. The gap between the rotating and the stationary cylinders is 0.42 mm and 0.47 mm (inner gap and outer gap, respectively) and these two surfaces do not touch each other. The relative motion of these two cylinders mimics that of the Mavag Mavadrive™ Mixer where the impeller is the rotating cylinder and the drive unit the stationary cylinder. Yet, the impeller and the drive unit of the Mavag mixer can touch each other during rotation due to the very tight gap (0.035–0.04 mm). There are two worst-case conditions for the double-gap rheometer: >650 times lower volume and >3,000 times higher surface-area-to-volume ratio. A lower volume results in a higher SvP concentration (particle count per volume) and a higher surface-area-to-volume ratio indicates greater solid/liquid interactions. The surface area of the double-gap rheometer is the combined surface area of the rotational cylinder and stationary cylinders. Despite these worst-case parameters and a comparable mixing condition (tip speed), the double-gap rheometer resulted in a significantly lower SvP concentration than the Mavag impeller/drive unit assembly (Table IX). Actually, the double-gap rheometer yielded no obvious SvP count increase after 1 h rotation of the rotating cylinder at 660 rpm (change in SvP relative to before rotation being 2 vs 35 for Mavag Mixer), suggesting the impact of mechanical shear and the solid-liquid interactions on mAb SvP formation is minimal. However, due to the even smaller gap of the Mavag impeller/drive unit assembly, two additional rheometers (cone-plate and plate-plate) were tested to evaluate the effect of a very tight gap but without contact.
Comparison of the Mixer Models in SvP Formation in mAb A Formulation
3.6.2. Cone–plate Rheometer:
An AR-G2 Magnetic Bearing Rheometer with a cone-plate measuring system features a shallow cone (∼1°) rotating on the top of a plate. In between is the liquid sample. Overall, the torsion, degree of twist, rotational speed, and dimensions of the cone give the shear stress and the shear rate, which allow viscosity and other rheological properties to be calculated. The cone-plate rheometer used in this study also features a high surface-area-to-volume ratio: 0.094 m2/L versus 0.001 m2/L for the impeller-drive unit assembly of the Mavag mixer (Table IX). An extremely tight gap, 0.018 mm, between the cone tip and the plate was used. After 1 h rotation at 436 rpm (i.e., 1.37 m/s tip speed), there was no significant increase in SvP count (with respect to Mavag based on the change in SvP relative to before rotation of 7 vs 35) compared with the mAb A sample prior to being subjected to rotation (Table IX), suggesting that the shear rate and stress under such a tight gap between two surfaces with no contact have minimal impact, if any, on mAb SvP formation.
3.6.3. Plate–plate Rheometer:
An AR-G2 Magnetic Bearing Rheometer with plate-plate measuring system is similar to the cone-plate rheometer. The gap between the plates was controlled at 0.1 mm, and the instrument was operated at a maximal rotational speed of 654 rpm (i.e., 1.37 m/s tip speed) (Table IX). The gap size could not be reduced further without risking damage to the instrument. The surface-area-to-volume ratio (0.042 m2/L) was also substantially higher than with the impeller-drive unit assembly of the Mavag mixer. After 1 h rotation on the mAb A solution, no significant increase in SvP count was detected (with respect to Mavag based on change in SvP relative to before rotation of 5 vs 35), again suggesting that the shear rate and stress under such a tight gap between two surfaces with no contact as well as significant solid-liquid interactions have minimal impact, if any, on mAb SvP formation.
3.7. Stress Type
The investigation thus far suggests that grinding mAb between two surfaces (close contact) is the primary root cause for mAb SvP formation and not the tight gap between two surfaces without contact (tight clearance). However, there are several possible types of stress in the grinding zone, such as mechanical stress, interfacial stress (solid-liquid and air-liquid), cavitation, local thermal stress, etc. This study has demonstrated that mechanical stress and interface stress individually might not be the primary mechanism responsible for SvP formation. It is likely that the synergetic action of multiple stresses might be the root cause. Challenges are anticipated in identifying suitable small-scale models to differentiate these stress mechanisms, which are the focus of our ongoing research.
4. Conclusions
Processing mAb formulations in unit operations with relative motion between two surfaces, such as mixing and filling operations, needs to be carefully assessed. This study clearly demonstrated that the relative motion between the impeller and drive unit assembly in several BMMs as well as between the piston and the housing of the rotary piston pump played a critical role in mAb SvP formation, which could subsequently foul the filtration membrane to cause major manufacturing disturbances. This study further elucidates that the contact of the two surfaces, not the tight gap between them, is the root cause of SvP formation. mAb-related molecules are particularly prone to SvP formation than other non-antibody-related protein molecules under the grinding stress. The responsible stress type in the grinding zone is currently under investigation but appeared not to be interface (solid-liquid and air-liquid) related. The findings of this study will benefit scientists and engineers who develop mAb manufacturing processes by providing a better understanding of drug product process challenges and sound justifications for selecting appropriate processing equipment.
Conflict of Interest Declaration
The authors declare that they have no competing interests.
Acknowledgments
The authors would like to thank Chris Heynes, Fred Lim, Michael Schneider, Imke Sonya Ludwig, Joerg Luemkemann, and Danielle Leiske for their many useful inputs and valuable comments.
- © PDA, Inc. 2017


