
Abstract
Low pH inactivation of enveloped viruses has historically been shown to be an effective viral inactivation step in biopharmaceutical manufacturing. To date, most statistical analyses supporting modular low pH viral inactivation claims have used descriptive statistical analyses, which in many cases do not allow for probabilistic characterization of future experimental log10 reduction values (LRVs). Using Bayesian hierarchical logistic regression modeling, probability statements regarding the likelihood of successful low pH viral inactivation based on only certain process parameter settings can be derived. This type of analysis also permits statistical modeling in the presence of historical data from different experiments and right-censored data, two issues that have not as yet been satisfactorily dealt with in the literature. The characterization of the probability of successful inactivation allows creation of a modular claim stating future LRVs will be greater than or equal to some critical value, based on only certain process parameter settings of the viral inactivation unit operation. This risk-based approach, when used in conjunction with traditional descriptive statistics, facilitates coherent and cogent decision-making about modular viral clearance LRV claims.
LAY ABSTRACT: Viral contamination of biologically derived drug products is a safety concern for both regulatory agencies and drug manufacturers. Validation of the removal and inactivation of model viruses is required to ensure the safety of patients receiving these drugs, and dedicated steps, including viral filtration and chemical inactivation, are often added to manufacturing processes to provide additional clearance and inactivation capabilities. One of these steps, low pH inactivation, exposes enveloped viruses to a low pH environment to reduce the potential of the virus to infect host cells. Because the viral inactivation capability of this well-understood unit operation has been demonstrated for years across many different biological drugs, many companies have begun investigating the use of the modular viral clearance claim for the low pH inactivation step. Modular claims ensure, without experimentation, that a certain level of reduction of virus will occur if specific parameters are used in the manufacturing process, allowing manufacturers to save both time and resources in the early developmental phases of biologically derived drugs. A novel type of statistical analysis is outlined in this article that when used in addition to previously used analyses allows drug manufacturers to estimate a more valid level of virus reduction in modular viral clearance claims.
- Viral inactivation
- Modular viral clearance
- Modular claim
- Generic claim
- Low pH inactivation
- Viral clearance
- Log reduction value (LRV)
- Murine leukemia virus (MuLV)
- Retrovirus
- Viral safety
Introduction
A viral safety strategy that includes validation of the removal or the inactivation of potential adventitious viruses is necessary for manufacture of biopharmaceutical drugs (1). One component of this strategy consists of using qualified, scaled-down models of unit operations that demonstrate viral clearance or inactivation. Typical unit operations studied include anion exchange chromatography, viral filtration, and low pH inactivation (2).
Low pH inactivation is a dedicated virus inactivation step used in many biopharmaceutical manufacturing processes (2, 3). Typically, the pH of a cell-free product intermediate is adjusted to <4.0 by addition of acid and held for a specified length of time within a temperature range. Experimentation suggests that exposure to low pH environments reduces or eliminates the ability of an enveloped virion to infect susceptible host test cells through alteration of surface conformation or surface glycoproteins (4, 5). Inactivation is kinetic, increasing with both time and temperature (5). The effectiveness of low pH inactivation can be experimentally demonstrated using well-controlled, scaled-down low pH viral inactivation studies (6).
Published low pH inactivation data have consistently shown that low pH inactivation effectively inactivates enveloped viruses (2, 3, 5, 7, 8), making this unit operation an ideal target for modular claims. Modular viral clearance or viral inactivation claims provide specific log reduction values (LRV) for a unit operation performed within specified parameter ranges based on historic data (9).
Published analyses of low pH viral inactivation and other unit operations for modular claims generally use descriptive statistics summaries (5, 7, 8, 10⇓⇓–13). Data are obtained from historical estimates or statistically designed experiments, usually restricting analyses to data plots and numerical summaries such as sample means and standard deviations. Although these statistical tools are needed to generate modular claims, these summaries do not allow probabilistic statements to be made about future observations of LRV. Studies have addressed this lack of probabilistic statistical methods using designed, inferential experiments to determine which process parameters are critical for the LRV via normal linear models (8). The models were used to predict the mean LRV for future experiments; however, these experiments did not address how to manage right-censored data, which occur frequently for many viral clearance or inactivation studies.
Valid statistical inference for a modular claim LRV can be difficult because of right censoring, reporting the experimental LRV as greater than or equal to a certain log10 level. This makes the use of the usual linear regression approach for analysis difficult, which could be why limited statistical inferential work has been performed and published for modular claims. Reasons for right censoring can include virus stock titers that are lower than the total possible inactivation LRV and limited levels of detection in viral assays because of matrix toxicity or interference.
Right censoring can be accommodated by making the outcome of interest a binary variable. Using a binary variable, success can be defined as no detectable virus or an LRV greater than a specific value. Thus, there is a shift in inferential focus from the mean LRV to the probability of success as defined above (i.e., undetectable virus or LRV > c). It is assumed that the probability of success is systematically determined by certain critical process parameters. This implies the use of logistic regression to make inferential and probabilistic statements about the future probability of success.
Quasi-complete separation also occurs in many viral inactivation analyses because unit operation parameter specification ranges that are designed to ensure patient safety generate high probabilities of successful inactivation. Because of this, the response will be above a specified LRV threshold for a given linear combination of the process parameters in almost all instances tested. Analyses of quasi-complete separation data sets can be problematic for frequentist or maximum likelihood estimation (MLE) statistical approaches to logistic regression because parameter estimates approach infinity, but can be managed using a Bayesian statistical approach. Bayesian inferential approaches allow parameter estimation even with quasi-complete separation and additionally can aid decision-making by providing a complete probability distribution of the parameter of interest, in this case probability of success.
Another problem that arises in the development of a modular viral clearance claim, especially from historical data, is collection of data from different experiments. Measurements obtained in the same experiment may be more similar than measurements obtained from different experiments. To properly account for the correlation structure of the data induced by different experiments, a hierarchical model is used. This treats each experiment as a random variable that is generated first, and then measurements made within a given experiment are also randomly generated. This model properly accounts for the sources of variability in the entire set of data.
This manuscript proposes the use of a cogent and coherent inferential statistical approach to aid the decision-making processes previously used to generate modular viral clearance or inactivation claims. Namely, Bayesian hierarchical logistic regression, which is used to make inferences about the probability of achieving a specified LRV value or complete inactivation based on given process parameter factor settings accommodating the issues of right-censoring, quasi-complete separation, and data generated within separate experiments.
Materials & Methods
Data for these analyses were gathered from Janssen low pH virus inactivation experiments performed from 2011 to 2016. Data consisted of 108 measurements from 10 different monoclonal antibody products generated using Chinese Hamster Ovary, CHO, cells, production cell substrates developed at Janssen R&D. Sodium acetate trihydrate, acetic acid, and tris chemicals were sourced from Avantor Performance Materials, Merck KGaA, or Sigma Aldrich chemical suppliers.
Protein A eluates in sodium acetate buffering systems (50–100 mM) were obtained from manufacturing scale runs. Initial samples (T = 0 min) were spiked (0.7%–10% v/v) in small-scale experiments with xenotropic murine leukemia virus (xMuLV) at a neutral pH. For time point samples, the material was adjusted to required inactivation pH using 1.0 M acetic acid and then spiked with xMuLV. All samples were held within a specified temperature range. Target pH was verified across the incubation time and adjusted if necessary. At specified incubation time points, aliquots were removed and adjusted to neutral pH with 1.0 M Tris. All samples were analyzed using the median tissue culture infectious dose (TCID50) or the plaque assay to determine the xMuLV titer.
Experimental isoelectric points of the antibodies varied from 6.33 to 9.35. Protein concentrations ranged from 4.0 to 25.0 g/L. Experimental inactivation temperatures used for inactivation were 15°C–20°C with tested inactivation times from 5 to 120 min. Starting virus stock titers ranged from 1.5 × 10⁶ to 5.6 × 10⁷ TCID50/mL or pfu/mL.
In the statistical analyses, when multiple pH values were measured within a unique experimental time course, the lowest measured pH value was used for the model to provide the most conservative estimate of LRV. The lowest pH values measured within each unique experiment ranged from 3.63 to 3.93. LRV estimates were calculated from the difference of total log10 xMuLV at the initial timepoint and the total log10 at each measured time point. LRV estimates ranged from 1.5 to 6.9 LRV.
Statistical Analyses
The data set used for analysis included all recordedinformation from each experiment. Exploratory analyses were performed to determine manufacturing critical process parameters (CPPs) to be included in the final statistical model. These analyses entailed close collaboration with scientists who possessed specific viral inactivation knowledge, the aim being determination of prior distributions for model parameters and CPPs. Based on this collaboration and preliminary analyses, process parameters identified as critical for mean LRV and probability of success were: assay type, protein concentration, time, pH, and temperature.
The response variable LRV was rewritten as a binary variable:
A Bayesian model was then used to obtain estimates for π = Pr(y = 1) using the posterior probability distribution about this probability π. This probability of success is dependent on the settings of the critical process parameters previously identified. The posterior distribution of π is used to get a point estimate (median of the posterior distribution) of the probability that an experiment would have either some level of LRV (c) or complete inactivation. A 95% credible interval, which is an interval that contains 95% of the distribution of π, that is there is a 95% probability that the true value of π lies within this interval given the data collected, was also calculated.
The data were structured in a hierarchical fashion; there were 26 experiments and within each experiment there was a varying number of measurements of LRV. The likelihood of observing a certain value of LRV for each observation is:

The derived binary outcome variable y, described in (eq 1), has a Bernoulli distribution, which is characterized by the probability of observing success, π, and is equivalent to the expected value of y. To determine how various factors (i.e., CPP and assay type) affected the expected value of y, we assumed the following:
Here, xij is a vector that contains the values of each of the factors—assay type (a categorical variable: TCID50 and Plaque), protein concentration, time, pH, and temperature—for the jth observation in the ith experiment; β is a vector of the corresponding effects of these factors, and experimenti is the effect of the ith experimental run factor.
To complete the analyses, prior distributions were specified for the parameters in the model. The prior distributions were:
 or
or
 depending on the value of c = (LRV) in the definition of y above;
Prior distributions were justified as follows. When LRV ≥ 5, the factors (CPP and assay type) are expected to have a significant effect on the mean value of y, but because we did not have much a priori knowledge of what this effect was, we used an extremely noninformative prior distribution: β ∼ Normal(0, 100). For LRV ≥ 4.5 or 4.0, previous knowledge that the factors had a large effect on the mean value of y due to quasi-complete separation allowed for the use of a prior distribution reflective of this knowledge: β ∼ Normal(0,1). A weakly informative prior distribution was used for the experiment factor because there was little prior information available about its effects.
The “rstan” package in the R version 3.3.0 software was used to model the data and obtain samples from the posterior distributions.
Results & Discussion
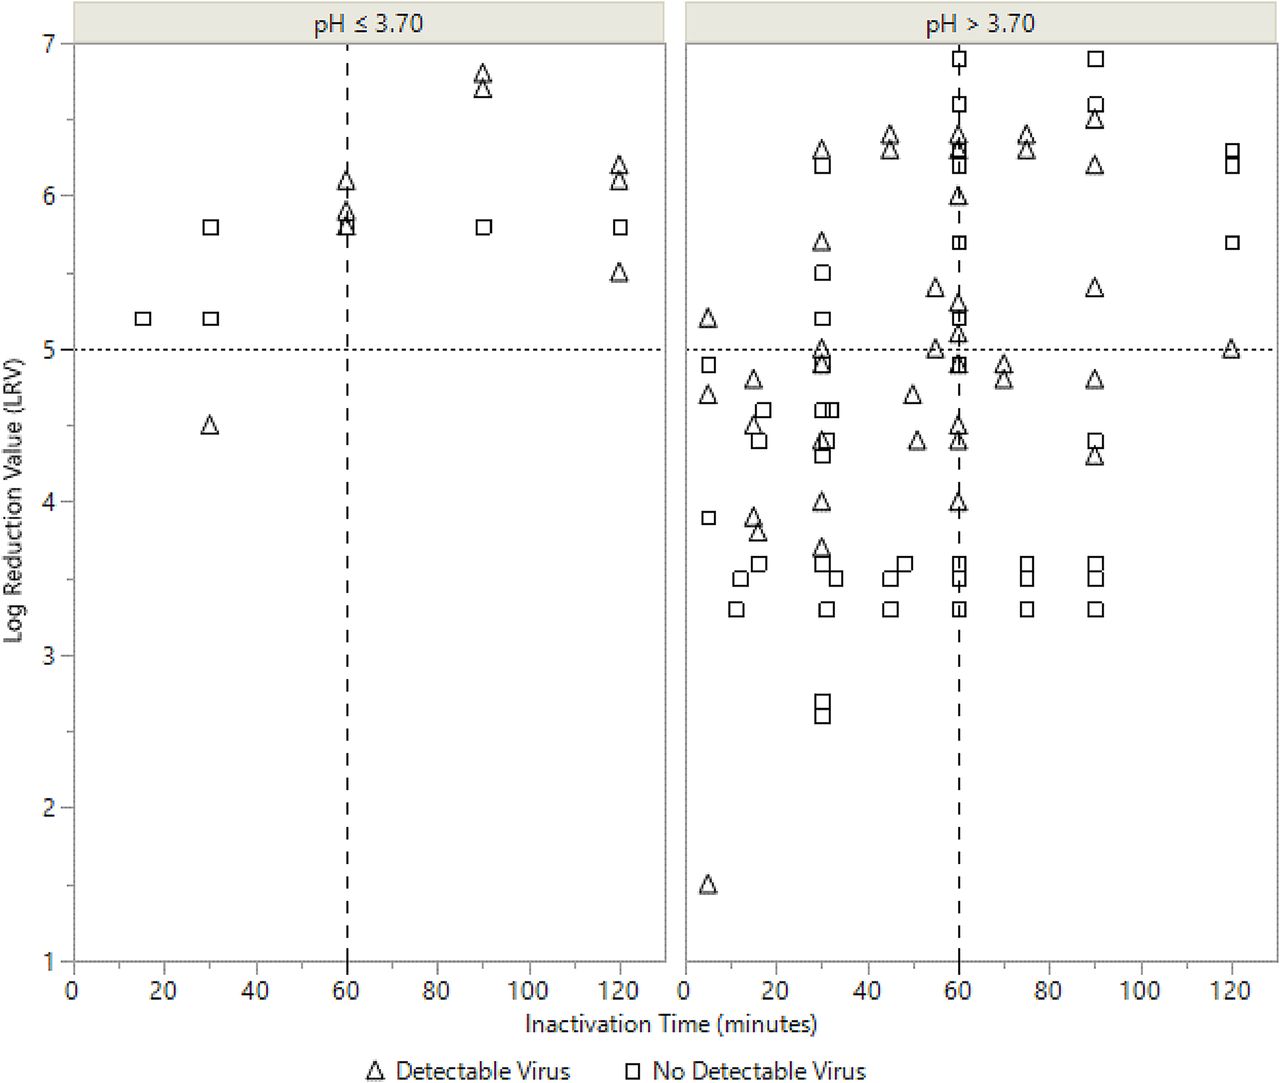
LRV data from all modeled experiments are shown in Figure 1. After 60 min, regardless of any other process parameter value, at least 4.0 LRV or no detectable virus was shown for all experimental timepoints. Additionally, if the data set is restricted to experimental points at pH ≤ 3.70, at least 5.0 LRV or no detectable virus was shown after 60 min.

Log Reduction Values (LRVs) across time for all experimental points. Experiments performed at pH ≤ 3.70 are shown in the left panel in the figure and experiments performed at pH > 3.70 are shown in the right panel. Open triangles represent experiments where detectable levels of virus were measured and open squares denote experiments where no virus was detected.
Point estimates of the probability of success and corresponding 95% credible intervals, based on the posterior distributions from the Bayesian hierarchical logistic regression, were generated for two levels of LRV (c); 4.0 and 5.0. Point estimates were based on the median of the posterior distribution. The 95% credible interval represents an interval that contains 95% of the posterior distribution, implying that there is a probability of 0.95 that the true value of the probability of success lies within the given interval based on the data. This is in contradistinction to a confidence interval, which does not give the probability that the true value lies within the interval calculated; rather, it states that if experiments were repeated ad infinitum, 95 out of a 100 of the consequent intervals calculated would contain the true probability of success. A modular claim could be considered justifiable for a given specification of process parameters if the estimate of the probability of success is sufficiently high, for instance ≥95%.
Assay type was analyzed because Janssen experiments were performed using two different assays, TCID50 and plaque. The posterior distribution for the linear effect of the difference between TCID50 and plaque on the log odds of success had a median value of 0.65, which indicates increased probability of success for the TCID50 in comparison to the plaque assay. This same distribution also showed 0 as a very likely value of the effect of the difference between TCID50 and plaque, indicating that no difference between assay types is a plausible hypothesis based on this data.
Table I shows examples of point estimates of the true probability of success and corresponding 95% credible intervals, at the conditions: c is 4.0 and 5.0 LRV; assay type is TCID50, temperature is 18°C; protein concentration is 4.0, 16.4, and 25.0 g/L; time is 90 min, and pH is 3.70 or 3.80. As can be seen in Table I, all point estimates of probability of success (success is LRV ≥ 5.0) were above 95% for pH ≤ 3.70.
Point Estimates of Probability and Credible Intervals for c of 4.0 and 5.0 LRV, TCID50 Assay Type, 18°C Temperature, 90 min Time, and Varying Levels of pH and Protein Concentration
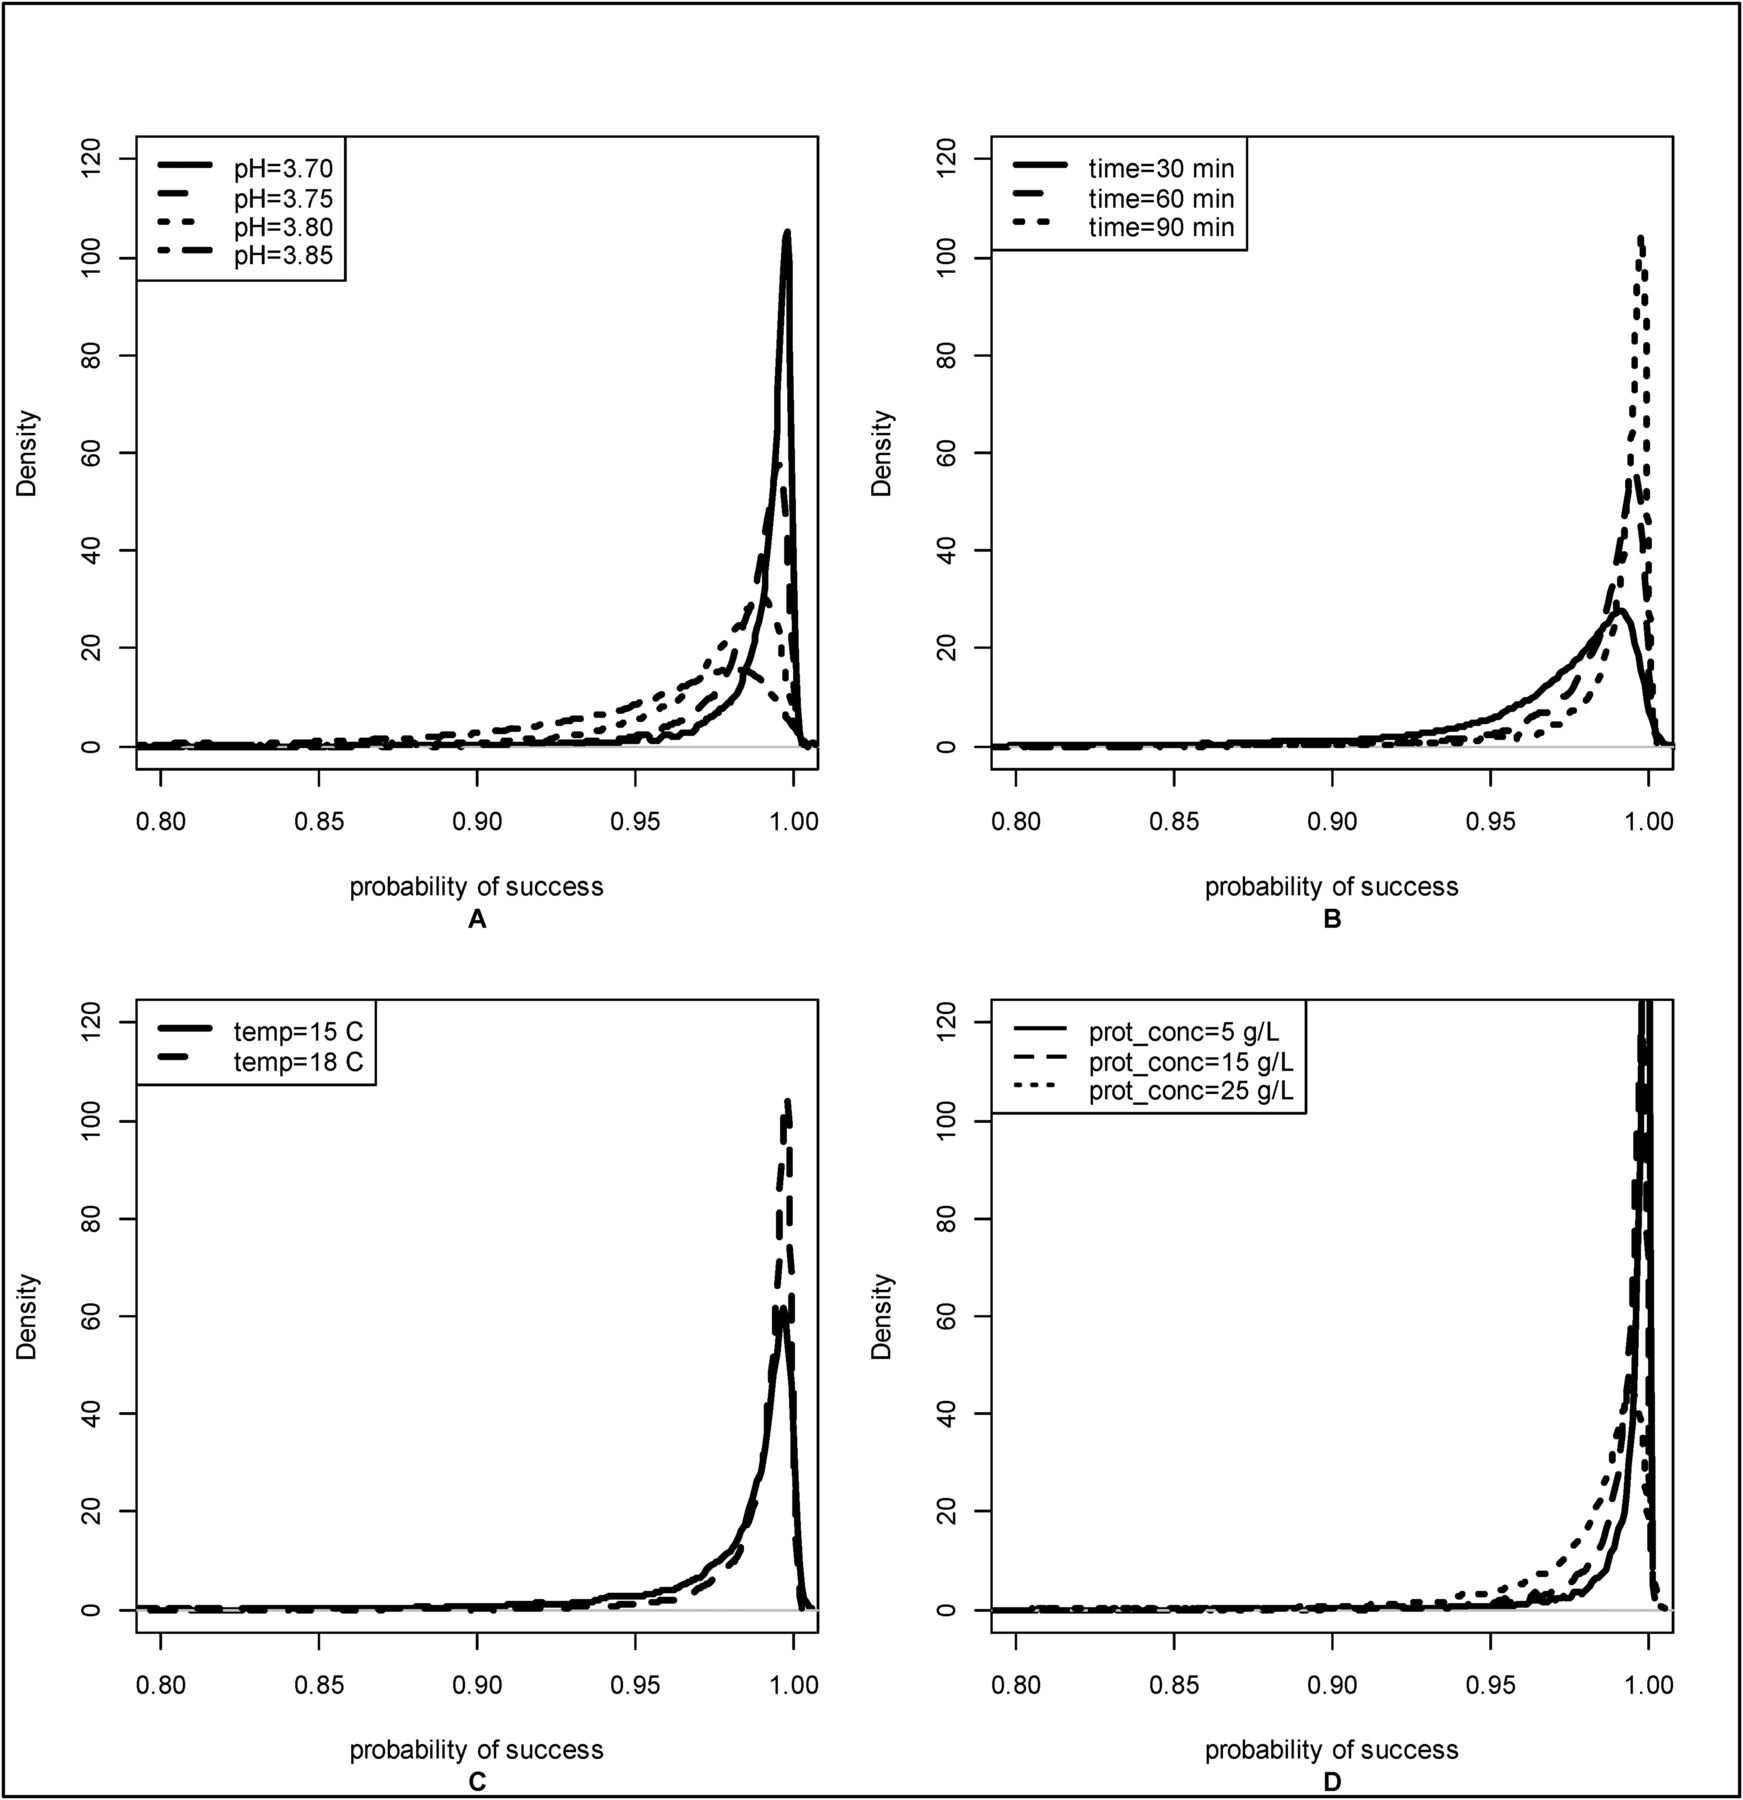
To illustrate the effect of various process parameters on the probability of successful viral inactivation, the posterior distributions for corresponding probabilities of success were generated by varying one process parameter and holding the others at the same levels. These distributions are shown in Figure 2. Distributions become more concentrated around the probability of success, near 1, as pH decreases (Pane A), time increases (Pane B), temperature increases (Pane C), and as protein concentration decreases (Pane D). These changes in the probability of success distributions generated at different levels of time, temperature, and pH were consistent with previously published data.

Posterior distributions become more concentrated around probability of success = 1 as pH decreases (Pane A), time increases (Pane B), temperature increases (Pane C), and as protein concentration decreases (Pane D). Unless otherwise noted, posterior distributions of probability of success were generated using the following values: c of 5.0 LRV, assay type TCID50, temperature 18°C, protein concentration 16.4 g/L, pH 3.70, and Time 90 min.
However, the changes seen across protein concentration were not consistent, showing sharper distributions near 1 as protein concentration decreased. Previously reported data examining the effect of protein concentration on low pH inactivation have not shown consistent results (3, 5, 7, 8, 14).
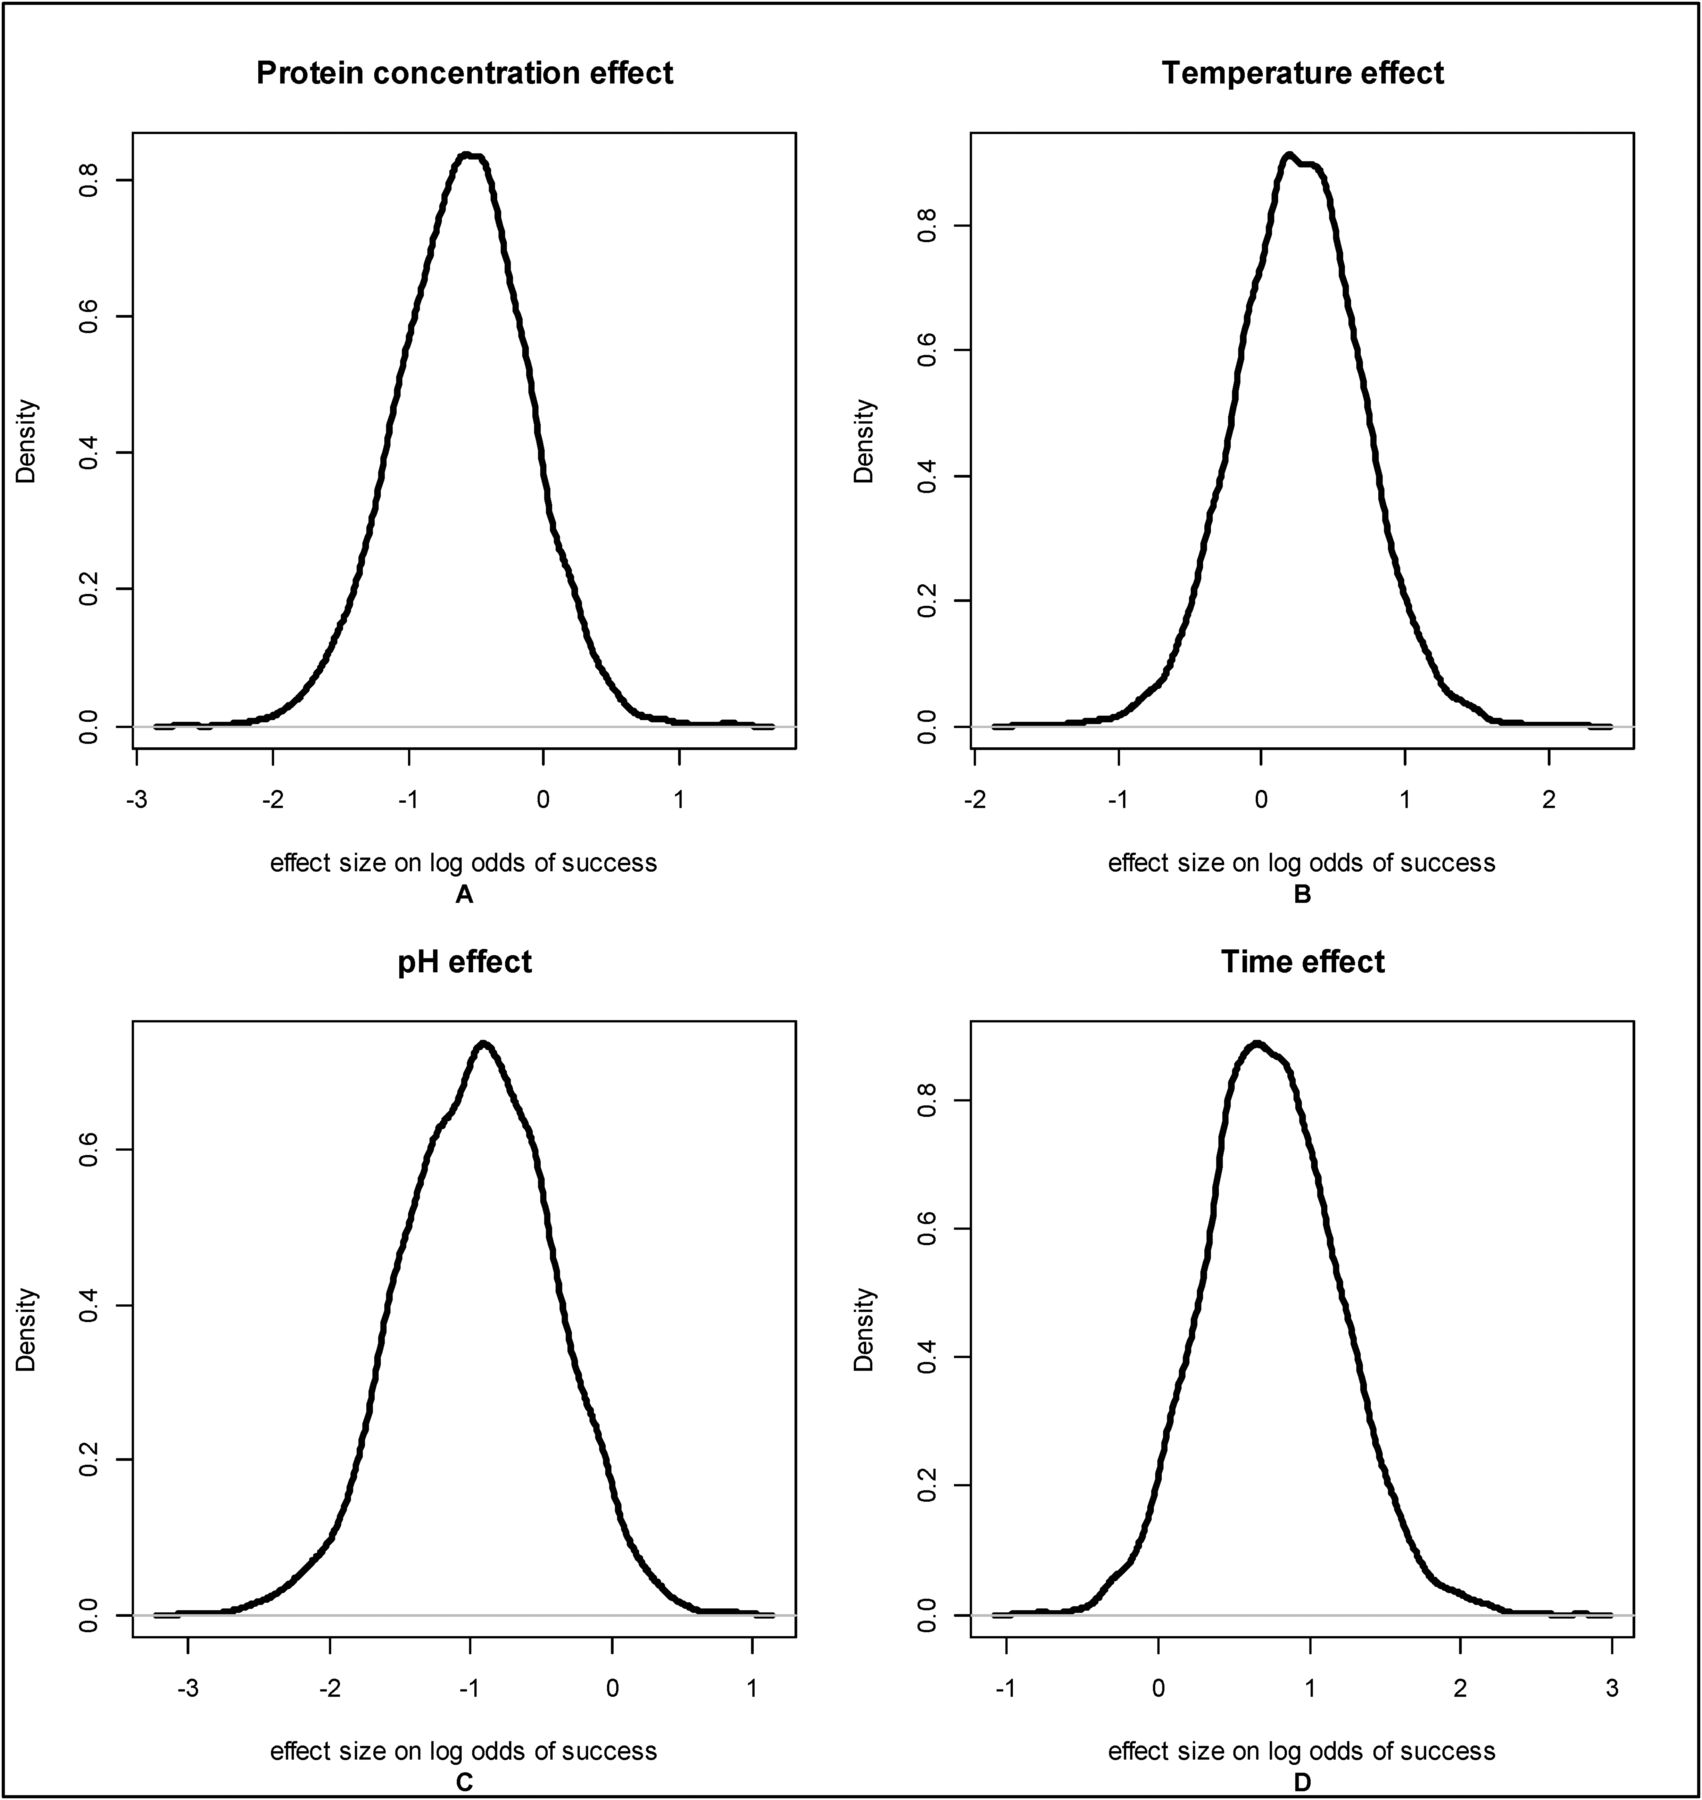
To further investigate the effect of temperature and protein concentration, log odds of the probability of success were inspected. The effect of each process parameter on the log odds of success, the β vector from eq 3, indicates whether the odds of success increase or decrease as the process parameter increases. If the element of β is 0, then that process parameter does not have an effect on the odds of success. The posterior distributions of effect size for log odds of success (Figure 3) showed protein concentration and temperature had high posterior densities at 0, indicating that based on the data analyzed these parameters are not likely to have important effects on LRV. The limited range of temperature studied (15.0°–18.0°C) is a likely cause of the small effect size for this parameter.

Posterior distributions of the log odds of successful viral inactivation at LRV ≥5 for 4 critical process parameters: protein concentration, temperature, pH and time.
Buffer system and buffer molarity have both been shown to affect low pH inactivation LRV (3, 8). These parameters could not be studied because of lack of information within our data set. All experiments were performed in the same buffer matrix, sodium acetate, and only one experiment was performed using a sodium acetate molarity level other than 100 mM.
Conclusions
Analyses performed on Janssen viral inactivation data at studied process parameter ranges demonstrated a robust and effective unit operation. These LRV results are consistent with previously published data performed within or near the studied ranges. Bayesian analyses provided posterior distributions of the probability of success for greater than 4 or 5 LRV or no detectable virus that were also consistent with previously reported analyses, except for protein concentration.
The decreased likelihood of the probability of success at increasing levels of protein concentration within this data set is in contrast to some previously published reports for protein concentration (3, 8, 14). The mechanism of decreased probability of inactivation of virus at lower concentrations is currently unknown, but protection because of virus aggregation at lower ionic strengths has been theorized (8). The mechanism for higher concentrations decreasing the probability of success is also unknown. As previously stated, the effect of protein concentration on the log odds of success had a high posterior density at 0, indicating that the hypothesis that protein has no effect on LRV is plausible. To more fully explore and resolve this possible contradictory effect of protein concentration on LRV, additional data points tested over a wider range of protein concentrations should be included in future analyses.
Multiple safe and robust LRV levels could have been justified for our Janssen modular viral inactivation claim. All experimental points showed no detectable virus or at least 4.0 LRV for time points ≥60 min and no detectable virus or at least 4.3 LRV for time points ≥90 min, regardless of pH, temperature, and protein concentration within the studied ranges. Average LRV for all points (including those with no detectable virus) for ≥60 min inactivation time was 5.38 LRV and for ≥90 min was 5.54 LRV, regardless of other parameter conditions studied. Excluding right-censored data, the average LRV for incubation ≥60 min inactivation time was 5.54 and the average LRV for incubation ≥90 min was 5.77 LRV, regardless of other parameter conditions.
The LRV levels listed previously, ranging from 4.0 to 5.77, show how much variation in LRV is possible and justifiable from the same data set. Any one of these levels, and even additional levels, could have been used to justify a modular claim using our data. The most conservative of these levels could underestimate the actual LRV level, limiting the utility of a modular claim, whereas the least conservative approach could overestimate both LRV and overall viral safety factor. However, these claims based on descriptive statistics alone would not have provided a rational, scientific, decision-making process based on probability theory for the likelihood of successful viral inactivation for future experiments. Making generalizable statements from experimental data is an essential feature of the scientific method. Decisions based only on observations from a sample are not completely appropriate for future experiments, because different samples could give different results, impacting consequent decisions of modular LRV claim levels.
A statistical approach that considers the randomness of the data source and hierarchical structure is the Bayesian hierarchical logistic regression outlined in this paper. This approach was used to supplement and complement other approaches used in the development of the Janssen modular claim. A posterior probability of success distribution was developed for the following process parameter specifications: c of 5.0 LRV; pH ≤ 3.70; protein concentration 4.0–25.0 g/L; temperatures ≥18°C; inactivation time ≥90 min, and a lower threshold of >95% for the point estimate. This distribution was used to justify the Janssen low pH inactivation modular LRV claim of 5.0 for these parameters.
The statistical treatment in this paper leads to a more accurate and coherent estimate of the probability of successful inactivation in comparison to other methods that do not satisfactorily consider the censored nature of the data. The modular claim LRV generated using a Bayesian approach is in line with previously published data (5, 7, 8, 12), although direct comparisons of LRV levels are difficult across these studies because of varying specifications. Bayesian hierarchical logistic regression allowed for valid inference even with a high proportion of right-censored data, quasi-complete separation, and data gathered across different experiments without performing additional, expensive experiments. Our analyses illustrate that inferential statistical techniques can be a valuable tool to supplement descriptive statistics in the establishment of modular viral clearance claims. This approach can also be applied to other viral clearance and inactivation steps, especially those that frequently have right-censored data, like surfactant inactivation, anion exchange chromatography, and retrovirus or other large virus clearance using small virus retentive filters.
Conflict of Interest Declaration
The authors declare that they have no competing interest.
Acknowledgements
The authors would like to acknowledge Susan Liu, Veronica Holmes, Vince Scalese, Brian Polilli, Ken Goldberg, Terry Benner, Denis Twomey, Shant Shahinian, and all of the members of the Janssen Viral Clearance Toolbox Team for their review and feedback on the manuscript; Suryalekshmy Rajasimhan for her review of the large amount of data used to generate our modular claim; and Janssen management John Knighton, Gene Schaefer, and Chris Rode for supporting this effort.
- © PDA, Inc. 2019


