
Abstract
During the manufacture of a monoclonal antibody drug product, which was aseptically filled within a vapor phase hydrogen peroxide-sanitized isolator, samples were taken to investigate the hydrogen peroxide uptake behaviors. Surprisingly, the samples had no detectable hydrogen peroxide (most results below the limit of detection). This finding was later attributed to hydrogen peroxide decomposition after the samples were stored frozen at −20°C for two weeks before testing. This case study highlights the criticality of storage conditions for hydrogen peroxide-containing samples and summarizes an investigation on hydrogen peroxide stability in water and in three monoclonal antibody solutions having a wide protein concentration range (30–200 mg/mL). Samples were stored at three temperatures (−70°C, −20°C, or 2–8°C) for up to 28 days to assess the impact of protein concentration and storage temperature on hydrogen peroxide decomposition rates. Hydrogen peroxide degraded slightly more rapidly with increasing protein concentration independent of storage condition. When stored at −20°C, hydrogen peroxide was least stable and degraded faster than when stored at 2–8°C. Hydrogen peroxide was most stable when the samples were stored at −70°C. Overall, this case study brings the hydrogen peroxide stability issue to the attention of process development scientists and engineers and offers a valuable lesson learned during process development.
LAY ABSTRACT: The use of vapor phase hydrogen peroxide as a sanitizing agent for isolator and cleanroom decontamination has become common in recent years. Because of the potential impact of residual hydrogen peroxide on biopharmaceutical product quality, hydrogen peroxide uptake behaviors and mechanisms during the manufacturing process within these barriers need to be evaluated and understood. Samples taken from various small-scale and manufacturing-scale hydrogen peroxide uptake studies are often stored frozen before testing. This case study reports an important and interesting finding about hydrogen peroxide stability in samples collected for hydrogen peroxide uptake investigation, and it demonstrates the relationship between hydrogen peroxide stability and storage temperature, storage duration, and monoclonal antibody concentration. The approach and outcome of this study are expected to benefit scientists and engineers who develop biologic product manufacturing processes by providing a better understanding of drug product process challenges and appropriate sample storage.
- Hydrogen peroxide (H2O2)
- Vapor phase hydrogen peroxide (VPHP)
- Vaporized hydrogen peroxide (VHP)
- Monoclonal antibody
- VPHP uptake
- H2O2 decomposition
1. Introduction
A monoclonal antibody (mAb) drug product (DP) was transferred to a new manufacturing site for production. Comparison of the manufacturing processes between the two sites identified a major difference in sanitization of the aseptic filling core. At the new site, the vial-filling operation took place within an isolator, which was decontaminated using vapor phase hydrogen peroxide (VPHP). At the original site, a non-VPHP agent was used for sanitizing a restricted access barrier system (RABS). The risk of hydrogen peroxide (H2O2) uptake during manufacturing and subsequent migration into the protein solution was previously evaluated through a combination of small-scale and manufacturing-scale studies (1). H2O2 uptake samples were collected at various manufacturing steps and tested for H2O2 content at a later date. A major setback was encountered in the first manufacturing-scale study when the analysis of the uptake samples suggested that the majority of the H2O2 values were below the assay's detection limit. An investigation and failure analysis found the likely root cause to be H2O2 decomposition during sample storage.
H2O2 is thermodynamically unstable and can decompose to form water and oxygen in aqueous solutions. The rate of decomposition typically increases with rising temperature, H2O2 concentration, and pH (2, 3). Because of its known instability in the liquid state, storing H2O2 in the frozen state seems to be an intuitive solution. To the authors' knowledge, there is no published information regarding H2O2 stability at frozen temperatures. H2O2 stability in mAb formulations is not reported in the public domain either. Monoclonal antibodies are typically formulated at different concentrations in the pH range of 5–6 in the presence of a buffer, a stabilizer, and a surfactant. In a previous H2O2 spiking study (1), H2O2 decomposition over time was observed in mAb formulations. Storage temperature is an important factor for H2O2 decomposition, as 90% of H2O2 decomposed after 1 month at 2–8°C and H2O2 was not detectable after 1 month at 25°C or after one week at 40°C (refer to Table III in Reference 1).
However, all uptake samples in the failed study had been stored frozen at −20°C. Major H2O2 decomposition in a few weeks at such a low temperature is unexpected. This prompted us to confirm the decomposition of H2O2 at −20°C and to study H2O2 decomposition in response to different storage temperatures (particularly frozen temperatures). The impact of the mAb concentration was also studied. This report summarizes the findings of this study and the lessons learned.
2. Materials and Methods
Materials used in this study include three mAb formulations (see Table I), water for injection (WFI), and 29%–32% H2O2 stock solution (Alfa Aesar, MA). A 2–8°C refrigerator (Bahnson Environmental Specialties, NC), a −20°C freezer (Bahnson Environmental Specialties), and a −70°C freezer (Thermo Scientific, NC, USA) were used for storage of H2O2-spiked solutions.
Monoclonal Antibody Formulations Used in the Study
2.1. Preparation of H2O2-Spiked Solutions
The H2O2 stock solution was sequentially diluted by WFI or one of the two mAb formulations (mAb A and mAb C) into 50, 100, and 250 ng/mL H2O2-spiked solutions (see Table II for dilution calculation). For mAb B, only the 100 ng/mL H2O2-spiked solution was prepared. There were 10 H2O2-spiked solutions evaluated in the study.
Dilution Series to Make the H2O2 Spike Solutions
2.2. Stability Study Plan
Each H2O2-spiked formulation was filled into forty-eight 6 cc vials (Schott, Müllheim Germany) with a fill volume of 4.6 mL. Each vial was stoppered with a 20 mm Daikyo stopper (D-777-1, Daikyo, Sano-shi, Japan). The 48 vials were divided into three groups of 15 vials and one group of 3 vials. Each of the three 15-vial groups was placed into a cardboard box for light protection and then stored in a 2–8°C refrigerator, a −20°C freezer, and a −70°C freezer. Vials were stored for up to 28 days in each condition with time points of 1, 3, 7, 13, and 28 days (i.e., 3 vials for each time point). The 3-vial group served as the Day 0 control. Control vials were held in the 2–8°C refrigerator for <2 h before analysis for H2O2 concentration.
2.3. Sample Analysis
At each time point, 27 vial samples (3 vials × 9 conditions) from each of the three formulation groups (WFI, mAb A, and mAb C) were pulled and analyzed at the same time. Note that only 9 vials were pulled and tested for the mAb B formulation, as it was spiked with just one level of H2O2 (100 ng/mL). All frozen vials were placed on the benchtop protected from light for 1 h to ensure complete thawing and gentle mixing. The H2O2 concentration was determined using the Amplex UltraRed assay, which has been previously described (4).
To demonstrate test validity, the analysis needed to satisfy the following system suitability criteria:
Percent coefficient of variation (%CV) of the standards: ≤15%
Spiked control: 20% within the target spiked control and %CV of ≤20%
R2 value: ≥0.99
The assay has a 5–15% intraday variability (by the same operator, instrument, and assay plate) depending on spiked H2O2 concentration. The higher the H2O2 concentration, the lower the intraday variability. The limit of detection (LOD) is protein specific: 4 ng/mL for mAb A, 7 ng/mL for mAb B, and 13 ng/mL for mAb C.
At each time point, samples of the same formulation were pulled and analyzed at the same time.
3. Results and Discussion
3.1. H2O2 Decomposition in WFI
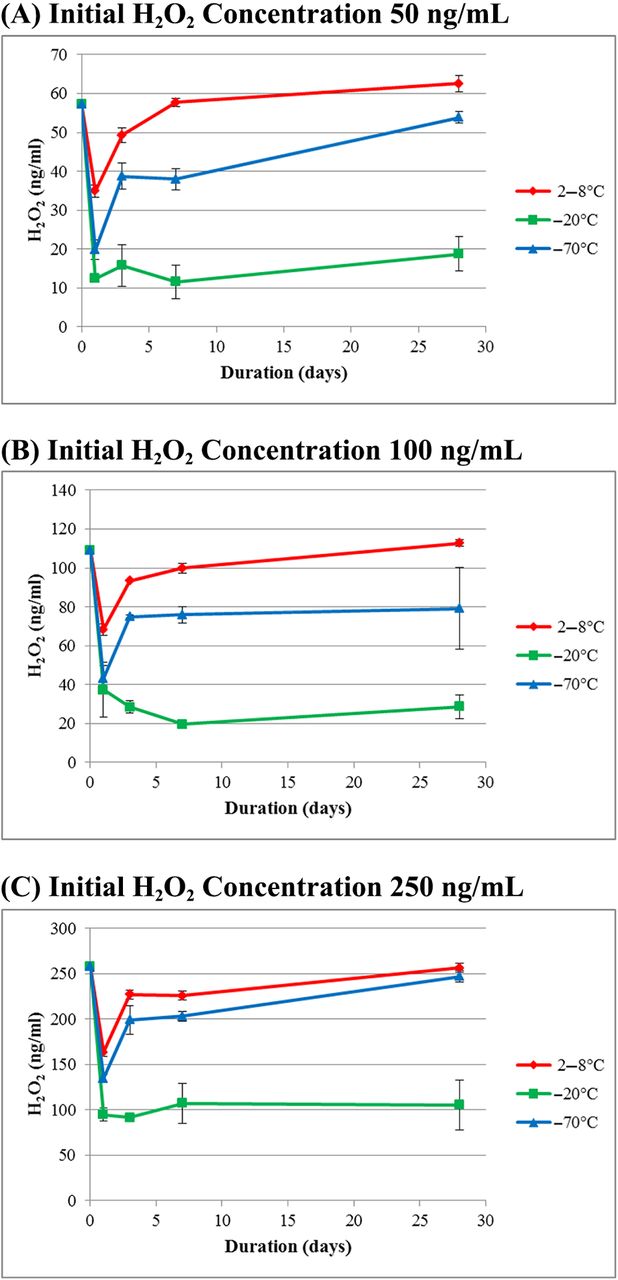
H2O2 stability in WFI as a function of storage time at three different temperatures (2–8°C, −20°C, and −70°C) is summarized in Figure 1 (initial H2O2 concentration of 50, 100, and 250 ng/mL in Figure 1A, 1B, and 1C, respectively). For all concentrations tested, H2O2 in WFI is most stable at 2–8°C as the initial concentration did not change after 28 days, although there was a sharp concentration drop on Day 1. The Day 1 testing result is an outlier, which may be due to assay- or sample preparation–related issues. H2O2 in WFI is slightly less stable at −70°C where it suffered ∼20% concentration loss at Day 28. H2O2 in WFI was least stable during frozen storage at −20°C as it was decomposed by 60–80% on Day 1 and was then stable for the remaining time.

Profiles of H2O2 concentration in WFI formulation at three storage temperatures with three initial H2O2 concentrations. Each data point represents the average of three samples assayed in triplicate.
3.2. H2O2 Decomposition in mAb Formulations
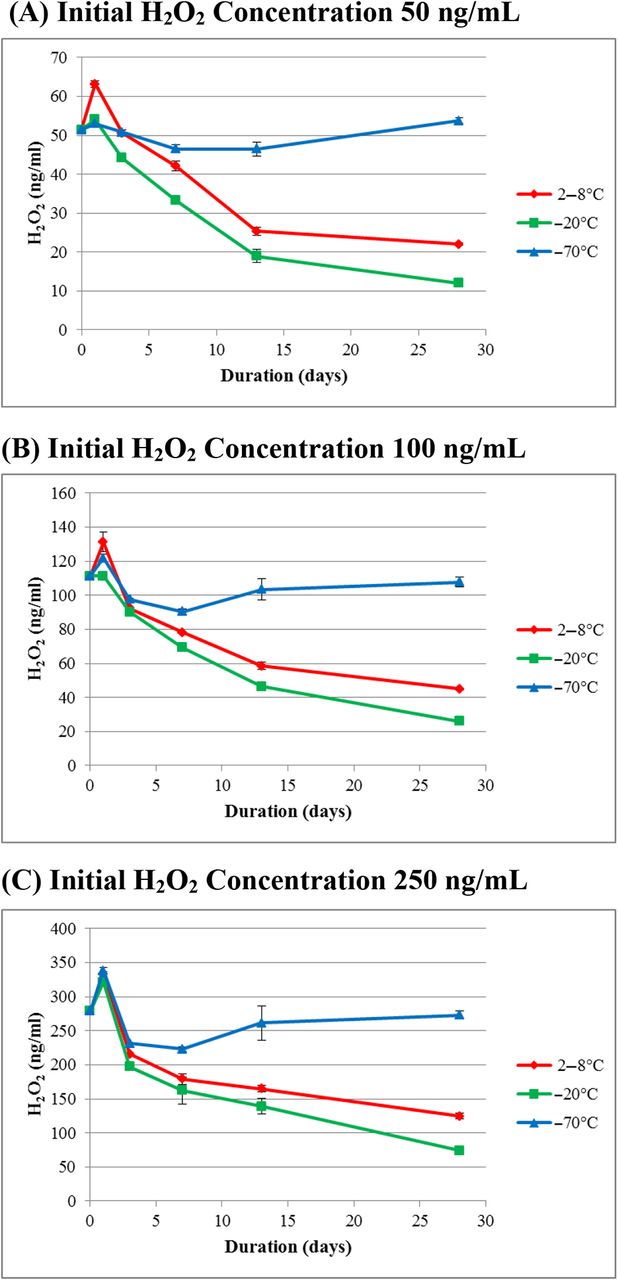
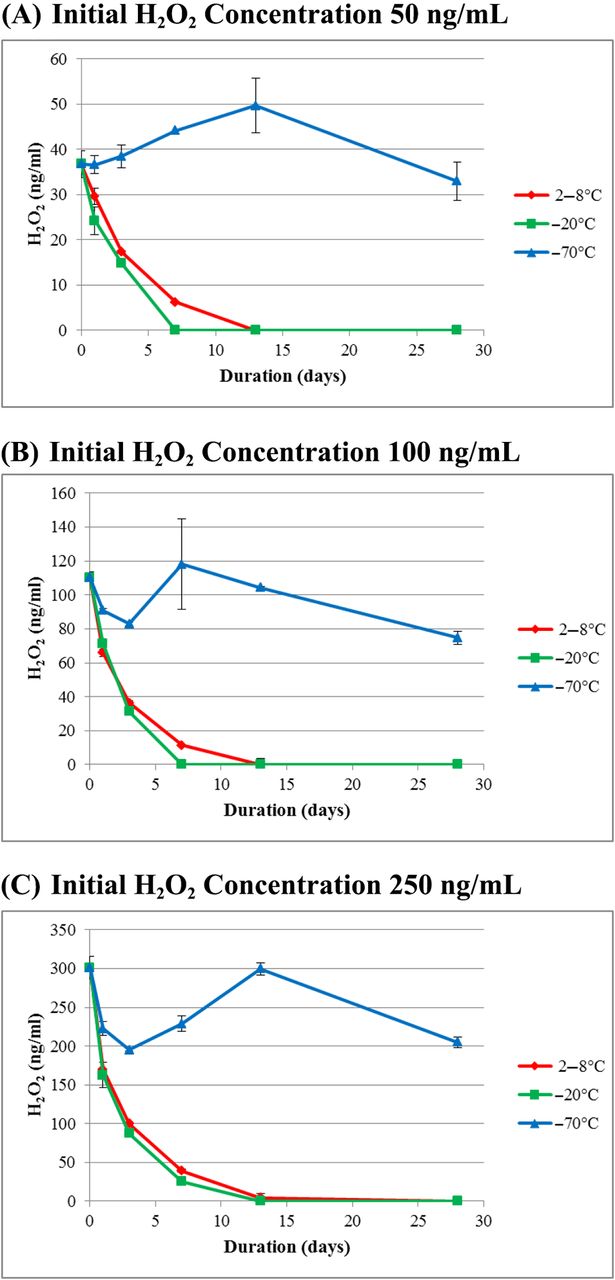
H2O2 stability in two mAb formulations with different protein concentrations (mAb A at 30 mg/mL and mAb C at 200 mg/mL) and as a function of storage time at three different temperatures (2–8°C, −20°C, and −70°C) is illustrated in Figures 2 and 3, respectively. In both cases, frozen at −70°C presented the most stable storage condition. At Day 28, H2O2 concentration was similar to its initial concentration in the mAb A formulation, while the mAb C formulation showed an H2O2 concentration loss of ∼25% (outside the 20% variability). For both mAb formulations, there was more H2O2 decomposition during storage at both 2–8°C and −20°C than at −70°C. For the mAb C formulation, there was no observable difference in decomposition between 2–8°C and −20°C storage, and the decomposition rate at both temperatures was equally rapid with H2O2 concentration dropping below the assay detection limit at Day 7 for all H2O2 concentrations. For mAb A, the fastest decomposition of H2O2 was seen at the −20°C storage temperature. The amount of H2O2 in mAb A after 28-day storage decreased by 60% at 2–8°C and by 80% at −20°C, which is considered significant, as samples were tested on the same day and on the same assay plate, meaning that the assay variability was <20%.

Profiles of H2O2 concentration in the mAb A formulation at three storage temperatures with three initial H2O2 concentrations. Each data point represents the average of three samples assayed in triplicate.

Profiles of H2O2 concentration in the mAb C formulation at three storage temperatures with three initial H2O2 concentrations. Each data point represents the average of three samples assayed in triplicate.
To further explore the effect of protein concentration on H2O2 decomposition, an mAb B formulation with a mid-range concentration (60 mg/mL) was compared with mAb A and mAb C in the 100 ng/mL H2O2 group. The comparison data are summarized in Table III. There is a general correlation of H2O2 decomposition rate with increasing protein concentration—the higher the protein concentration, the faster the H2O2 decomposition rate. The correlation is less obvious with the −70°C storage condition owing to better stability at this low temperature.
H2O2 Decomposition Rate Comparison Between Different mAb Formulations
The effect of initial H2O2 concentration on H2O2 decomposition is visualized in Figure 4, where the decomposition of H2O2 in mAb A at 2–8°C for the three initial H2O2 concentrations is plotted. H2O2 decomposed at roughly the same rate for every initial concentration. This trend applies to all other temperatures and formulations.

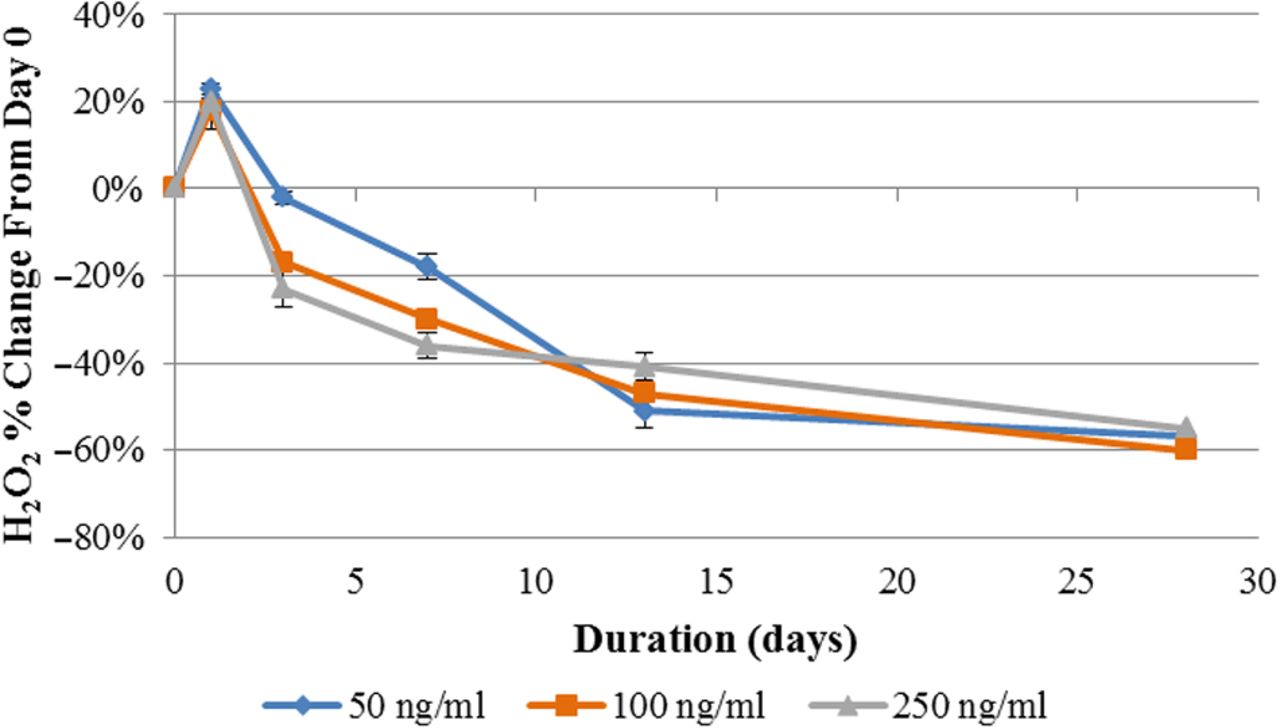
Stability profiles (% change relative to Day 0) of the mAb A formulation spiked with three H2O2 concentrations (50, 100, and 250 ng/mL) after 28-day storage at 2–8°C.
3.3. Data Interpretation
H2O2 is thermodynamically unstable and can decompose in aqueous solutions. In the presence of protein, H2O2 can be further consumed owing to oxidative reactions with the protein. Although rising temperature, H2O2 concentration, and pH are well-known factors leading to higher H2O2 decomposition rates in aqueous solutions, this study proved that H2O2 stability in the frozen state contradicts that in the liquid state. Of the three storage temperatures, −20°C represents the worst storage temperature. It may be because of increased H2O2 concentration in the freeze concentrates dispersed among ice crystals that could still have reactivity at −20°C so that the reaction rates may actually increase under this condition when compared with cold liquid temperatures. At −70°C, the matrix mobility would be greatly decreased and H2O2 activity is substantially inhibited because of the much lower temperature.
The presence of mAb is another factor influencing H2O2 decomposition. H2O2 oxidation of the protein may lead to the correlation of the increased H2O2 decomposition rate with increasing mAb concentration. However, this observation is difficult to explain because of the different mAb formulations tested in this study. The impact of other formulation excipients on H2O2 decomposition is unknown.
4. Conclusions
This case study presents unique behaviors of H2O2 decomposition in mAb-containing formulations. H2O2 decomposes at different rates in all storage conditions. Frozen storage at −70°C is an acceptable storage condition, but storage at −20°C should be avoided. In addition, we suggest that process scientists and engineers pay close attention to minimize the storage time for H2O2 uptake samples regardless of the storage conditions. Preferably, prior to VPHP uptake studies, a short-term stability study should be performed to ensure that H2O2 remains stable in the specific test solution prior to analysis.
Conflict of Interest Declaration
The authors declare that they have no competing interests.
Acknowledgments
The authors would like to thank Dr. Alexander Streubel, Dr. Thomas Roedl, and Dr. Stephanie Knueppel for their contribution in project transfer and valuable discussion. The authors are indebted to Mr. Aaron Hubbard for assay support.
- © PDA, Inc. 2019


