
Abstract
The sterility of drug products intended for parenteral administration is a critical quality attribute (CQA) because it serves to ensure patient safety and is thus a key requirement by health authorities. While sterility testing is a probabilistic test, the assurance of sterility is a holistic concept including adequate design of manufacturing facilities, process performance, and product design. Container closure integrity testing (CCIT) is necessary to confirm the integrity of a container closure system (CCS), until the end of a product's shelf life. The new and revised United States Pharmacopeia (USP) General Chapter <1207> is a comprehensive guidance on CCI. Nevertheless, practical considerations including the choice of CCIT methods, the acceptance criteria, or the positive control samples (artificial leaks) must be addressed by the pharmaceutical manufacturer.
This study is the first to provide a systematic comparison of four commonly used physical CCIT (pCCIT) methods [Helium (He) leak, vacuum decay, laser-based headspace analysis (HSA), and dye ingress] and four commonly used modes of creating artificial leaks (laser-drilled micro holes, copper wire introduced leaks, and two types of capillary leaks).
The results from these experiments provide comprehensive data to allow a direct comparison of the capabilities of the individual methods. The results confirmed that the He leak detection method, which is considered the “gold-standard” for pCCIT regarding method sensitivity, indeed demonstrates the highest detection sensitivity (lowest detection limit). In comparison to the dye ingress method, HSA and vacuum decay also demonstrated better detection sensitivity in our study.
Capillary leaks with orifice diameter (capillary leak with flow according to an ideal orifice) and micro holes yielded similar leak rates, whereas capillaries with nominal diameters yielded significantly lower leak rates. In conclusion, method sensitivity cannot be compared by means of a leak diameter, but requires the consideration of multiple impacting factors (e.g., path length, uniformity).
LAY ABSTRACT: Sterility of drug products intended for parenteral administration is a critical quality attribute to ensure patient's safety and is thus a key requirement by health authorities. The absence of microbial contamination must be demonstrated by container closure integrity (CCI) of the container closure system (CCS). Currently, the revised United States Pharmacopeia (USP) General Chapter <1207> provides the most extensive guidance on how CCI should be assessed. Nevertheless, practical considerations on the choice of an appropriate CCIT method, artificial leaks or the choice of an acceptance criteria are lacking and must be addressed by the pharmaceutical manufacturer.
This study provides a systematic comparison of four commonly used physical CCIT (pCCIT) methods [Helium (He) leak, vacuum decay, laser-based headspace analysis (HSA) and dye ingress] and four commonly used modes of creating artificial leaks (laser-drilled micro holes, copper wire introduced leaks, and two types of capillary leaks).
- Container closure integrity testing
- Artificial leaks
- Primary packaging
- USP <1207>
- Mass spectrometry-based helium leak detection
- Laser-based headspace analysis
Introduction
Drug products intended for parenteral administration are required to be free from microbial contamination (obligatory critical quality attribute, CQA). The maintenance of product sterility can be demonstrated by container closure integrity testing (CCIT). CCIT demonstrates the maintenance of integrity of a container closure system (CCS) until opening of the product. Appropriate selection, development, and qualification of the primary packaging, which include CCI assessments, are mandatory prior to human use. Depending on product-specific requirements, the prevention of oxygen (O2) and moisture ingress could additionally be necessary (1), for example, for oxidation-sensitive products (2), for products protected by inert gas-filled headspace, or to protect lyophilized products from moisture (3), which can also be demonstrated by CCI testing. In addition, CCIT can be used to demonstrate the maintenance of a specified inner pressure required over the entire shelf life, such as a vacuum for a convenient reconstitution of a lyophilized product (4, 5).
The current regulatory environment related to CCI is complex owing to regional differences and also because of the lack of clear guidelines on how to assess CCI in practice and in relation to all its relevant areas of consideration, including container closure selection and product development, manufacture, and quality control. The United States Pharmacopeia (USP) General Chapter <1207> (1) (revised in August 2016) currently provides an extensive and detailed guidance on CCI assessment. However, the industry still lacks practical recommendations on the choice of the CCIT methods and positive control samples (artificial leaks) to set acceptance criteria. A helpful overview and perspective by industry experts was provided by Brown et al. (6).
Several CCIT methods for different CCS configurations are available to date. According to USP <1207.1>, CCIT methods can be classified into (a) physical CCIT (pCCIT) or (b) microbial ingress testing (mCCIT). The pCCI methods can be further classified as (a) deterministic or (b) probabilistic leak test methods (5). A deterministic method detects leaks based on a predictable chain of events, for instance, the predictable movement of gas through a hole owing to a specific pressure gradient. Examples of deterministic CCIT methods include a tracer gas or laser-based headspace analysis (HSA) or pressure/vacuum decay approach. Deterministic test methods are intrinsically pCCIT methods, as the leakage event is quantified using physicochemical technologies yielding quantitative data. In contrast, probabilistic methods, for example, microbial ingress (mCCIT), dye ingress, and bubble emission test, are stochastic in nature and rely on a series of sequential and/or simultaneous events, each yielding a random outcome described by probability distribution and dependent on the sample size and the operator's skill. The outcomes of these methods are associated with uncertainties, and in order to obtain reliable data, larger sample sizes and rigorous test condition control are required, which also make test method validation challenging. As a result, the revised USP <1207> emphasizes the preference for deterministic methods over probabilistic methods for CCI assessment in general terms.
The selection of an appropriate CCIT method depends on a number of considerations, such as the product development phase, the specific container closure system configuration, the formulation and dosage form, or the sample size. While in general terms deterministic methods are preferable, there are various cases where a probabilistic test may well be appropriate (1, 5⇓–7).
Any of the several established methods may be applied for CCIT of a particular CCS if appropriately qualified and validated. The most commonly used CCIT methods are dye ingress, laser-based HSA, vacuum decay, and He leak methods.
Moving from a probabilistic to a deterministic method is not directly possible. It requires thorough studies of the leak rates of positive and negative controls.
The dye ingress method challenges samples with a dye solution in a vacuum/pressure chamber. The samples are (visually or instrumentally) inspected for potential dye ingress, which would indicate the presence of a leak (8). A variety of dyes can be used for this purpose.
In the vacuum decay method, the samples are placed in a hermitically sealed chamber in which a vacuum is subsequently generated. Pressure transducers in the chamber measure the pressure increase (vacuum loss), which is proportional to the size of the leak present in the CCS (9).
The laser-based HSA uses a near-infrared diode laser, which passes through the headspace of the sample to quantify the O2 content based on the light absorbance. Sudo et al. have described the principle of HSA in detail (10). Products which require nitrogen (N2) headspace, for example, for some oxidation-sensitive products (2), or which are sealed in a vacuum atmosphere can be monitored over time (days, weeks or years) using HSA to measure leakage-induced O2 ingress. Alternatively, prior to HSA, a pressure cycle (bombing) or vacuum can be applied in order to accelerate the gas exchange between the environmental gas and the headspace (10⇓–12). Alternatively, in cold storage handling, cooling down the CCS may decrease the headspace pressure.
In the He leak detection method, CCS samples are filled or flushed with He as a tracer gas. The sample is placed into a sample holder, which is connected, with an air-tight connection, to a mass spectrometer featuring a vacuum pump. Trace amounts of He leaking out of the CCS can be detected and quantified by the mass spectrometer and are converted into a He leak rate (13–14). The He leak detection method is currently the most sensitive pCCIT method and is considered to be the “gold-standard” for CCS development and qualification regarding method sensitivity (5–6).
CCSs with artificially introduced leaks are used as controls to both assess the sensitivity of the CCIT method and establish acceptance criteria for the CCIT method via mCCI/pCCI correlation studies. Several methods for creating artificial leaks exist. The choice of an artificial leak type is important, especially if artificial leaks are solely described by size, given that different leak geometries have different leakage dynamics leading to different CCIT method sensitivity.
The probability of a microbial contamination via a CCS leak, apart from the leak size, depends on several additional factors, such as path length and geometry, the presence of liquid, type and number of microorganisms. Therefore, correlating a leak size to the probability of microbial ingress may not be sufficient and may generate misleading results and conclusions.
An established approach for developing acceptance criteria for pCCIT methods is to correlate mCCI data to pCCI data for the method of interest (14⇓–16). In a mCCI – pCCI correlation study, leak sizes are measured for potential microbial ingress and correlated to the data found in the pCCIT study. Samples for these studies would typically include CCS with artificial leaks generated by the same method for both the mCCI and pCCI assessments. Previous studies have reported that microbial ingress may be detected with artificial leaks in a size range between 0.3 μm (nominal ID of glass micropipette) and 20 μm (OD of copper wire) (8, 14–15). The actual leak size is often described as nominal and may require further assessment (e.g., via He leak detection), given that artificial leaks lead to different leak sizes and geometries. Artificial leaks are prone to potential leak size increase (e.g., by breakage of pipette tips), but also to leak size decrease (e.g., by incrustation of dissolved compounds upon liquid evaporation or leak blockage by subvisible or visible particles).
The most commonly used methods to generate artificial leaks are laser-drilled micro holes, capillaries introduced into the container (glass wall or rubber closure) using epoxy glue, and copper wires inserted between sealing interfaces. All of these different artificial leak types pose specific challenges (6).
Capillary leaks are prepared by inserting a capillary of known length and inner diameter into the CCS (glass wall or rubber closure) using an epoxy glue to fix the capillary. Compared to micro hole leaks, capillaries feature oversized path lengths. However, the reproducibility of the leaks is typically higher owing to consistent diameters of capillaries used. However, they are also prone to clogging, which is also true for laser-drilled micro holes. Given the flexibility to vary the inner diameter and the capillary length, these leaks can be prepared either with true capillary diameter (to achieve a certain nominal diameter size) or with orifice diameter according to a measured flow rate (to achieve a certain orifice size) (8, 17). Capillary leaks can be prepared with any ID or length in order to achieve a specific flow rate according to eq 1, which describes the leak rate through a tube. The USP <1207.1> refers to orifice sizes and their respective leak rates (5). For a specific flow rate, an orifice size is reported, which basically represents a hypothetical leak (size) without path length (= zero path length). A leak rate measurement is required to verify the ID and length of the capillary according to eq 1.
Laser-drilled micro holes are channels through the CCS wall. Compared to capillary leaks, laser-drilled holes represent a shorter path length (somewhat closer to the thickness of the container wall). However, laser-drilled holes have been reported to have significant inherent variability owing to the process used, to potentially enlarge over time and/or during shipments, and to be prone to clogging by airborne particles, viscous liquids [e.g., silicone oil when used in prefilled syringes (PFSs)] or dried formulation components (6, 18–19). The latter is a specific challenge for CCIT methods where vacuum is applied, which may drive liquids to evaporate. In addition, the preparation of laser-drilled micro holes requires special equipment, which may preclude the preparation of such samples at the testing site itself.
A third type of artificial leak is a copper wire sandwiched between two sealing interfaces in a CCS (e.g., a copper wire set between the glass/rubber stopper interface), creating a leak channel on both sides along the copper wire. Nieto et. al. (20) previously nicely illustrated in a schematic diagram (finite element modeling) the assumed leak geometry resulting from the copper wire introduced between vial/stopper sealing interfaces. The preparation method for copper wire leaks is of low cost and robust. Parameters leading to variations need to be controlled (e.g. waiting time after preparation, rubber formulation or temperature). Furthermore, copper wire leaks can likely be considered a more realistic defect and leak, considering potential material such as fibers being possibly trapped between the glass/rubber stopper sealing interface. An approximation of leak sizes resulting from different copper wire sizes (and different capping forces applied) was investigated by Nieto et al. (20). Even if no exact hole size per se can be reported for such an artificial leak, the resulting leaks are reproducible when considering the elastomeric behavior of the rubber stopper by using consistent primary packaging components, consistent capping parameters and controlling parameters such as the temperature and the waiting time between artificial leak preparation and CCI assessment. (14, 20). Obviously, no artificial leak type can completely represent some or all of the types of potential leaks that may occur in real situations.
In general, despite several published studies reporting measurements using these various CCIT methods and leak types, a systematic direct comparison of, for example, the commonly used instruments for CCIT, the probabilistic dye ingress method to different pCCIT methods, the different artificial leak types, or correlation between leak rates and orifice size is not yet available.
This study provides a systematic experimental comparison of the four most commonly used CCIT methods and the four most commonly used artificial leak types.
The following four leak test methods were employed in this study:
He leak;
vacuum decay;
HSA; and
dye ingress.
This CCI assessment was performed with 6R glass vials featuring rubber stoppers/crimp caps as the model that CCS most widely used for biologics and other injectable drug products. For this CCI study, we prepared vials with the following artificial leak types of different sizes:
laser-drilled micro holes (nominal IDs of 2, 5, 10, 20, 60 μm);
copper wire set between the glass/rubber stopper interface (nominal ODs of copper wire of 10, 20, 60 μm);
capillaries of different nominal sizes (nominal IDs of 2, 5, 10, 15 μm); and
capillaries of different orifice sizes (nominal orifice diameters of 2, 5, 15, 60 μm according to an ideal orifice verified by flow measurements).
Materials and Methods
Container Closure System and Capping Process
The different types of artificial leaks were introduced into 6R glass vials purchased from Schott AG (Müllheim, Germany). The empty vials were capped with serum bromobutyl rubber stoppers and aluminum crimp caps (West, Exton, PA, USA) using an Integra West Capper (Genesis Packaging Technologies, Exton, PA, USA). The following capping parameters were set for the capping process: compression force: 30 lbs (133.45 N); capping block height: 145 (unitless machine parameter).
CCIT Methods
Dye Ingress Method:
The dye solution was prepared with 0.1% (w/v) methylene blue (Acros Organics, Geel, Belgium) and 0.01% (v/v) polysorbate 20 (Avantor, PA, USA) in purified water. Prior to use, the solution was filtered through a 0.22 μm polyethersulfone filter (Merck Millipore, Darmstadt, Germany). The CCSs were filled with 5 mL of purified water (to ensure detectability of any ingressed dye) and capped as described above. The CCSs were placed upside down into a custom-made metal grid with a metal cover to ensure complete immersion of the CCSs in the dye solution. The dye bath with the CCSs was placed in a vacuum cabinet VD 115 (Binder, Tuttlingen, Germany) featuring a vacuum pump VARIO PC 3001 (Vacuubrand, Theilingen, Switzerland). After evacuating the chamber to 500 mbar, the chamber pressure was kept at 500 mbar for 1 h followed by ventilation of the chamber. The CCSs were held for 1 h at atmospheric pressure to allow pressure equilibration inside the CCSs. This evacuation and re-pressurization cycle was performed for each type of artificial leak including intact CCSs as negative controls. After washing the CCSs, samples were visually inspected for the presence of blue dye. Visual inspection of the vials was performed by holding the vial against the white background of a black and white board for visual inspection as defined by Ph.Eur. 2.9.20. The intensity of illumination at the viewing point was maintained between 2000 and 3750 lux. The limit of detection (LOD) by visual inspection for the operator was ascertained using a dilution series and was determined to be 10 ppm, which corresponds to an ingress of 0.05 μL 0.1% (m/v) methylene blue dye solution into the CCS (filled with 5 mL purified water). A CCS filled with purified water (colorless sample) represented the blank for a visual comparison to the sample.
He Leak Detection Method:
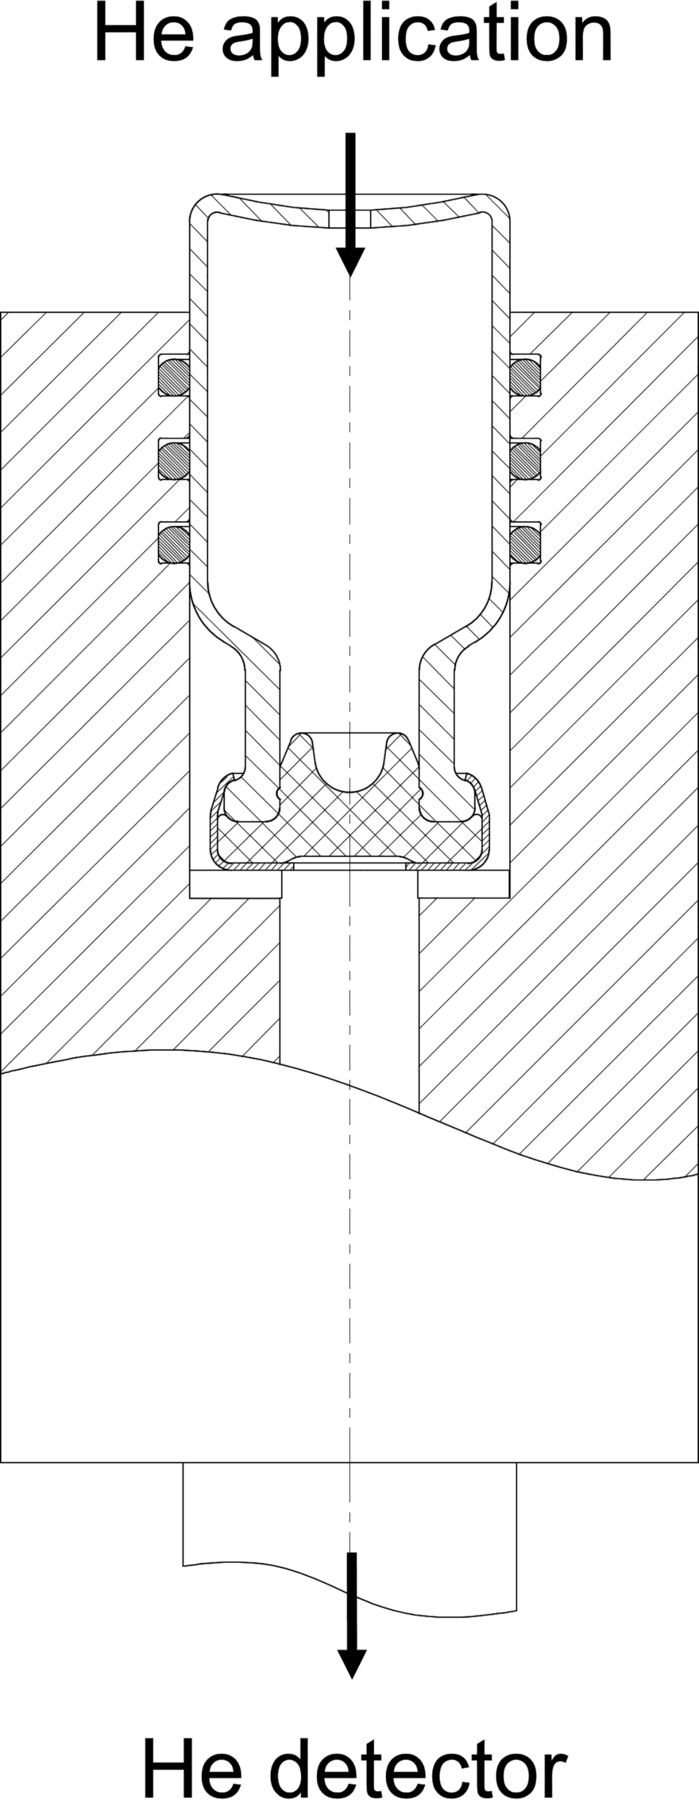
The He leak setup is based on the general setup described by Morrical et al. (14). The method described previously by Mathaes et al. (21) was significantly improved to prevent “false-negative” results. In this specific setup, an in-house-manufactured flange for vials (Figure 1) was connected with an air-tight connection to an ASM340 mass spectrometric He detector (Pfeifer Vacuum, Asslar, Germany). For measurement, holes were cut into the bottom of the vials using a diamond saw (Arnold Gruppe, Weilburg, Germany) to allow He application inside the CCSs. Vials were placed into the air-tight flange connected to the mass spectrometer, the vacuum pump was turned on, and a measurement was performed while He gas was constantly applied into the CCSs. Leak rates displayed on the mass spectrometer were recorded. Leak rates of <10−8 mbar L/s were reported as 10−8 mbar L/s. All negative controls (intact vials) were shown to yield leak rates of <10−8 mbar L/s. In Table I, the CCS with artificial leaks yielding He leak rates of >2 × 10⁻⁸ mbar L/s was evaluated. The He leak system is able to measure leak rates down to <10−9 mbar L/s.

Schematic diagram of He leak CCIT setup for vials.
Percentage of Detected Leaks (n = 10 CCSs) According to the Chosen Threshold Values Displayed as Matrix with CCIT Methods and Differently Sized Artificial Leak Typesa
Laser-Based Headspace Analysis:
The HSA method was adopted from Sudo et al. (10). Based on preliminary studies performed (data not shown), the gas exchange between the N2 headspace and the surrounding air was found to occur quite slowly. A vacuum cycle was thus applied to accelerate the gas flow between the two compartments (inside and outside the CCS). Initially, vials were capped with N2 headspace by flooding the vial with N2 gas immediately prior to the capping procedure as described above. The CCSs were then placed in a vacuum cabinet VD 115 (Binder, Tuttlingen, Germany) featuring a vacuum pump VARIO PC 3001 (Vacuubrand, Theilingen, Switzerland). After evacuation of the chamber to 500 mbar, the chamber pressure was kept at 500 mbar for 3 h, followed by ventilation of the cabinet. The CCSs were held for another 3 h at atmospheric pressure, which allowed pressure equalization inside the CCSs. One vacuum and re-pressurization cycle was run for each type of artificial leak including intact CCSs as negative controls.
The HSA instrument WILCOMAT® HSA-Lab (Wilco AG, Wohlen, Switzerland) featured a sample holder for vials. Prior to initiating measurements, the performance of the instrument was verified with a system suitability test (SST) by using reference standard vials of known O2 content (0 and 2.1% O2). For each sample, 10 measurements were recorded by the instrument. Prior to vacuum cycle exposure, the N2 content in the CCS headspace was verified to exceed 99.8% N2, with the exception of CCSs with 60 μm micro holes, in which gas exchange started immediately after capping. The N2 content in CCSs with 60 μm micro holes exceeded 99.0%. For data evaluation, the mean of the O2 values from the 10-fold determination were calculated and blanks (O2 values before the vacuum cycle) were subtracted from the O2 values after the vacuum cycle. All negative controls were shown to have an O2 concentration in the headspace of <0.1%. In Table I, the CCS with artificial leaks with O2 concentrations >2% after the pressure cycle was considered to be nonintegral.
Vacuum Decay:
Vacuum decay was measured with the WILCOMAT® 07 featuring a test chamber for 6R vials. After a CCS was placed into the test chamber, the chamber was evacuated to a chamber pressure of <10 mbar; the vacuum supply was then disconnected and the chamber equalized for 1 s. A pressure transducer (sensor LP-5A) measured the differential pressure (DP) for 15 s.
The threshold for the vacuum decay method was derived from the mean and standard deviation (SD) of the negative control differential pressure values. For this study, the limit of quantification (LOQ) was defined as mean plus 10 times the SD (10σ), which resulted in 160 Pa. CCI was considered to be compromised for samples exceeding a DP of 160 Pa. As an example of the LOD, the 5 μm leaks (capillaries with orifice diameter) yielded a mean value of 248 Pa. This clearly demonstrates the capability of the applied vacuum decay method to detect samples with artificial leaks of 5 μm. CCSs with 2 μm leaks (capillaries with orifice diameter) showed mean values of 150 Pa DP. Accordingly, a 3 μm leak (capillaries with orifice diameter) would generate DP values of approximately 200 Pa, whilst 190 Pa would correspond to a 6σ DP level above LOQ (160 Pa). This means that leaks with 3 μm orifice diameters can be detected with an accuracy of more than 6σ.
Artificial Leaks
The four different types of artificial leaks included in this study were introduced into our model CCS according to the preparation procedures described as follows.
Laser-Drilled Micro Holes:
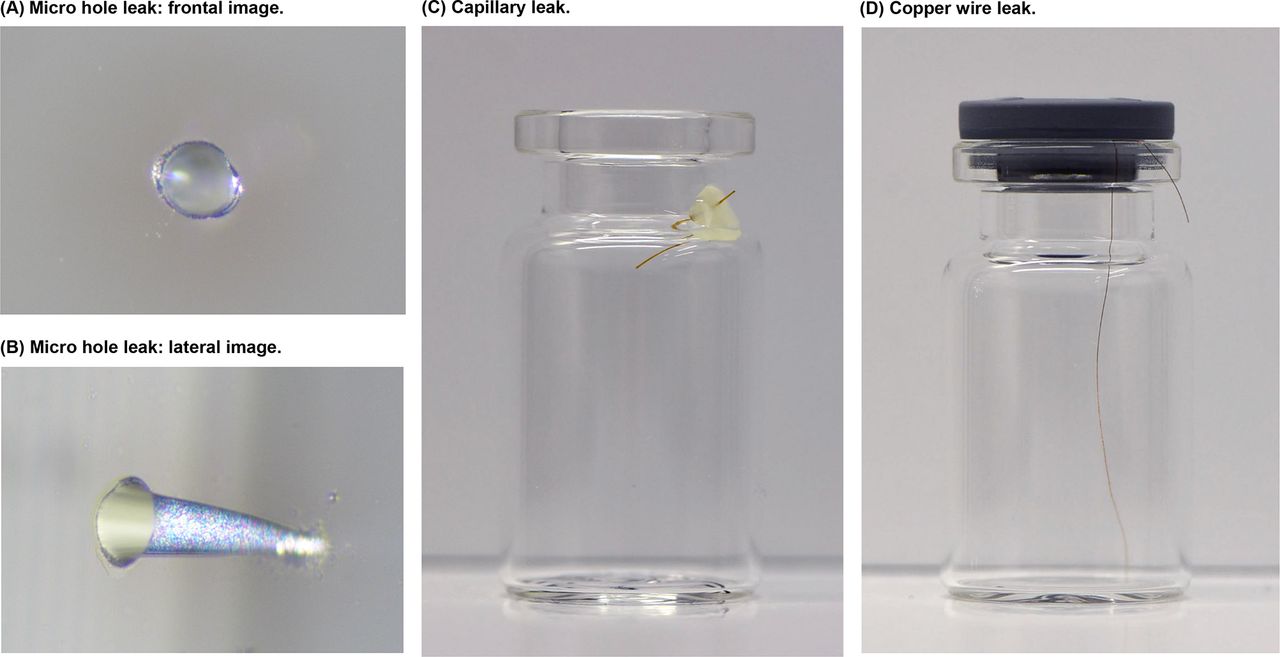
Laser-drilled micro holes (Figure 2, A and B) were generated by a service provider, using the same CCS vials as tested in the other parts of this study. One micro hole per vial with nominal diameters of either 2, 5, 10, 20, or 60 μm was drilled into the vial wall (wall thickness: approximately. 1 mm) by means of the cold ablation process. The vials containing the laser-drilled holes were then shipped to the test laboratory. For the subsequent CCI assessments, these vials were capped using an Integra West Capper with capping parameters as described above.

Artificial leak types and preparation. (A) Micro hole leak: light microscope images of laser-drilled micro hole (60 μm nominal diameter) in vial wall frontal and (B) lateral. (C) Capillary leak: Vial with capillary (ID: 15 μm, length: 10 mm) fixed with epoxy glue into a 1 mm drilled hole. (D) Copper wire leak: Copper wire (OD: 60 μm) sandwiched between vial and serum rubber stopper prior to capping.
Capillary Leaks (Nominal Diameter, Orifice Diameter):
Fused silica capillary tubings of different IDs (inner diameters) were purchased from Polymicro Technologies (Phoenix, AZ, USA). Capillary tubings were cut into pieces of specific lengths using a ceramic cleaving stone. In order to incorporate the capillaries into the CCS wall, holes of 1 mm diameter were drilled into the vial neck using a Proxxon diamond drill (Puag AG, Bremgarten, Switzerland). An epoxy glue was used to glue the capillary into the drilled hole to seal the drilled hole around the capillary as shown in Figure 2C. In preliminary studies, He permeation through epoxy glue in a 1 mm drilled hole around the capillary was verified to be below the baseline of 2 × 10⁻⁸ mbar L/s. Capillary leaks were prepared with either nominal diameter or orifice diameter. Nominal diameter leaks were prepared by using capillaries of different nominal IDs (2, 5, 10, or 15 μm), all cut to a length of 10 mm. Capillary leaks with orifice diameters were prepared based on geometrical estimation of the leak channels and empirically estimated values. Capillaries of the same nominal diameter were cut into different lengths according to calculations (eq 1) to achieve a specific flow rate. He leak rate measurements verified the prepared capillary leaks of theoretically estimated orifice diameters. For the CCI assessment, the vials were capped using an Integra West Capper with capping parameters as described above.
Leak rate qL (in mbar L/s) through a capillary [derived from the Hagen–Poiseuille equation (22)] with ID of the capillary d (in m), length of the capillary l (in m), inlet pressure pi (in Pa), outlet pressure po (in Pa), viscosity of the air or He (in kg/ms) (air at 20°C: 1.82 × 10⁻⁵ kg/ms, He at 20°C 1.87 × 10⁻⁵ kg/ms). The equation applies for laminar flow conditions, which is by definition between 10−6 mbar L/s and 10−1 mbar L/s (23).
Copper Wire Leaks:
Prior to capping, a non-coated copper wire (Elektrisola Feindraht AG, Switzerland) of 10, 20, or 60 μm nominal diameter was placed between the vial lip and the rubber stopper (Figure 2D) and subsequently capped with a crimp cap using an Integra West Capper with capping parameters as described above.
Sample Size
CCI assessments were performed with a sample size of 10 units per artificial leak type and size. CCSs with micro holes were checked for clogging (using He leak) and replaced if necessary. In total, six CCSs with micro holes needed to be replaced. One CCS with capillary leak was replaced due to capillary breakage, and one CCS with micro hole of size 60 μm, which broke during the blue dye cycle procedure, was replaced as well. All CCI assessments also included intact CCSs (without artificial leaks) as negative controls (n = 10). For the blue dye cycle with capillary leaks of nominal diameter, copper wire leaks were included as positive controls to ensure appropriate method performance.
Results and Discussion
Comparison of Four CCIT Methods
Table I shows the percentage of detected leaks per artificial leak type and size. For evaluation of the He leak method capability, samples with He leak rates of >2 × 10⁻⁸ mbar L/s were considered as nonintegral. In standard CCIT, one of the reported acceptance criteria in the public domain must be selected for CCI evaluation (25). The method capabilities of the HSA and vacuum decay method shown in Table I depend on the chosen method parameters. In this study setup, a pressure stress cycle was applied prior to HSA in order to avoid having long waiting times for gas exchange at atmospheric pressure. CCS with small headspace (e.g., PFS) might be challenging or unsuitable for HSA assessment and depending on the development phase the waiting time or application of a pressure cycle might be unfavorable. The pressure and time applied during the stress cycle have a major impact on the number of samples detected as non-integral. In principle, any leak allowing gas flow can be detected by HSA given that the concentration of the detected gas in the headspace exceeds the measuring instrument's limit of quantification. The outcome of the vacuum decay method is however dependent on the applied pressure, equalizing time, waiting time, and other settings. For the vacuum decay and HSA, a threshold above which an artificial leak was considered to be detected as non-integral by the CCIT method was set with respect to the negative control samples. For the vacuum decay, a threshold of 160 Pa DP was applied, and for the HSA method, a threshold of 2% O2 ingress was applied. For both the vacuum decay and the HSA method, leak rates of negative controls in all assessments were shown to be below the threshold applied.
Comparison of CCIT Method Sensitivity
When comparing the different CCIT methods, it must be noted that different artificial leak types with the same nominal leak size cannot be compared directly. Different leak types result in different leak rates, which is due to the different leak geometries (e.g., actual diameter, path length, path geometry). For the same reason, it is not meaningful to state a specific hole size as LOD for a CCIT method. As an example, method sensitivity is discussed using the results of the copper wire and micro hole artificial leaks. The two types of capillary leaks are discussed separately below, as well as the specific characteristics of artificial leak types.
All CCIT methods, including the dye ingress method, were capable of detecting 100% of the CCSs with 60 μm copper wires. Copper wires of 10 and 20 μm sandwiched between vial and stopper were only partially detected by the vacuum decay method (20% of CCSs with 20 μm copper wire, 40% of CCSs with 10 μm copper wire). The He leak method found all artificial leaks of all sizes. All pCCIT methods were able to detect 100% of CCSs with introduced micro holes down to 5 μm nominal diameter, meaning all micro holes of >5 μm (10, 20, 60 μm) were also detected by 100%. The dye ingress method in comparison detected micro holes down to 10 μm nominal diameter. For the He leak detection method, several acceptance criteria have been described in the literature based on studies (25) correlating actual microbial ingress versus He leak rates (using various artificial leak methods): Kirsch et al.: 6 × 10⁻⁶ mbar L/s (15); Morrical et al.: 5 × 10⁻⁶ mbar L/s (14); and Mathaes et al.: 10−7 mbar L/s (21). The USP <1207> recommends 6 × 10⁻⁶ mbar L/s (1). Thus, different acceptance criteria would lead to a different number of non-integral detected samples, even though the He leak method is capable of detecting all levels of leaks in this sample set. The results obtained were in line with other published research. For example, Wolf et al. previously demonstrated the ability of the vacuum decay method to detect laser-drilled micro holes in empty syringes down to 5 μm (9). Our results showed that the vacuum decay method was able to even detect leaks down to 3 μm (orifice diameter) with a statistical security level above 6σ. The high sensitivity of the He leak detection method has been previously reported by several authors (1, 6–7, 13) and can be attributed to the mass spectrometric detection of the gas flow in combination with the fact that He atoms can penetrate extremely small leaks due to their small size.
The dye ingress method detected only 50% of the 5 μm capillary leaks (orifice diameter) and 60% of 5 μm micro holes. Capillary leaks of 2 μm orifice diameter were detected by all the pCCI methods, but not by the dye ingress method. Whereas 100% of capillaries with 10 μm orifice diameter were detected by dye ingress, only 90% of the 15 μm capillary leaks of the same type were detected. This variation may be due to the probabilistic nature of the dye ingress method and suggests that this method has not only lower sensitivity but also higher variability in the test setup used with water-filled vials.
In summary, the He leak method showed the highest method sensitivity followed by HSA and vacuum decay, considering that the dye ingress test was performed with water-filled vials. The vacuum decay method was able to detect micro hole and capillary leaks (orifice diameter) and copper wire leaks, whereas the smallest leaks were only partially detected as described in Table I. Not surprisingly, the dye ingress method showed the lowest method sensitivity. It must also be noted that the sensitivity of the dye ingress method is highly dependent on the method parameters, for example, pressure and vacuum cycle and hold-times as well as the selected dye and the composition of the dye solution (e.g., dye concentration, addition of surfactants).
It is difficult to compare the variability of the CCIT methods because of their different detection modes and ranges. Specific limits depend on various parameters to be chosen.
Comparison of Artificial Leak Types
The leak geometry has a significant impact on the resultant leak rate. Equation 1 is derived from the gas flow equation and describes the gas flow rate through a tubing of known ID (d) and length (l) driven by a pressure gradient. The equation applies for laminar flow (in the range between 10−6 mbar L/s and 10−1 mbar L/s) though an ideal tubing (23). The equation illustrates the significant impact of the leak geometry on the leak rate. More specifically, the leak rate is proportional to the fourth power of the ID of the leak, which means that doubling the ID would result in a 16-fold increase of the leak rate. The path length of the leak impacts the leak rate in a negative proportional relation.
Results in Table I also demonstrate the impact of different leak types featuring different leak geometries on their detectability. For example, micro holes down to 5 μm were detectable for 100% of all samples tested by all deterministic methods, whereas capillary leaks with a nominal ID of 5 μm were only detected by the He leak method.
Capillaries of orifice diameters (capillary leak with flow according to an ideal orifice) were prepared by measuring the flow rate and adjusting the capillary diameter and length accordingly. The results for capillary leaks with orifice diameters should therefore theoretically be in agreement with the results of the micro holes, as the path length of 0.2 mm can be considered as negligible. In fact, data for method capability as shown in Table I are comparable in the range from 5 μm to 60 μm leak size. Micro holes of 2 μm leak size were not perfectly in line with the orifice capillary leaks (expected leak rates), which is further discussed below.
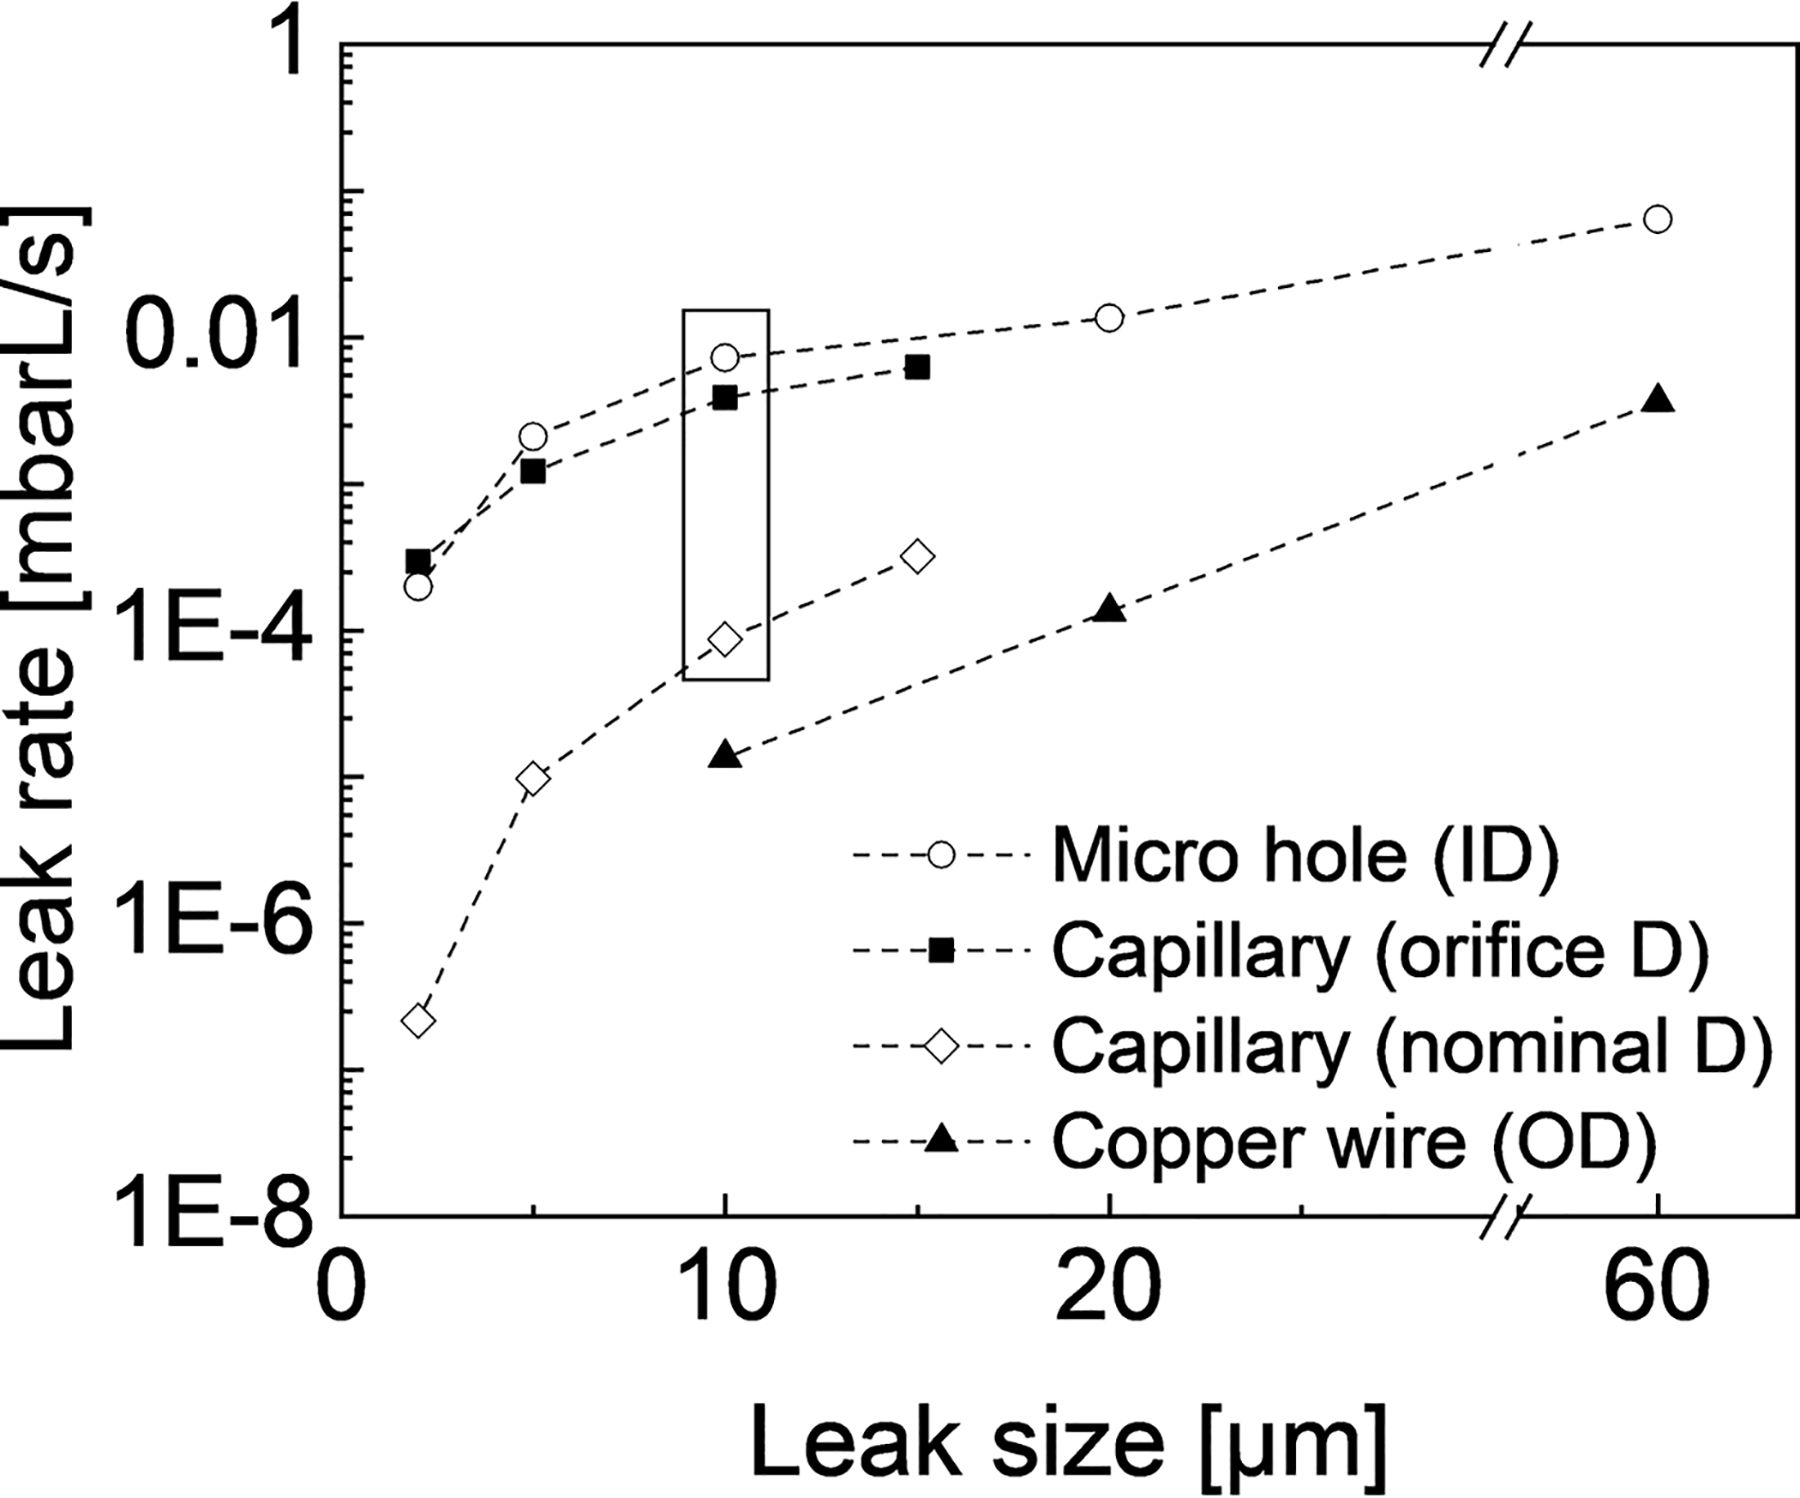
Considering the means of the absolute He leak rate values (Figure 3), the leak rates of the capillaries with orifice diameter were systematically lower than the leak rates for micro holes of same hole sizes.

He leak rates of four different artificial leaks. Each point represents the mean of n = 10 CCSs per artificial leak type and size with the exception of these sample groups: 5 μm capillaries orifice D (n = 9), 2 μm capillaries orifice D (n = 7) and 2 μm capillaries nominal D (n = 3). The four artificial leak types are represented by different symbols and grouped by dashed lines. Copper wire leaks are reported as OD of the copper wire.
The variation between different types of artificial leaks can be assessed using the He leak data set, as this method was able to detect all types of artificial leaks. Figure 3 shows means of He leak rates as a function of leak type and size. He leak rate values increased with larger leak sizes regardless of the artificial leak type. The four leak types show specific leak rates according to their leak geometries. For example, the three leak types of 10 μm leak size (framed in Figure 3) showed significant differences in He flow rates. The measured He leak rates were as expected according to theoretical estimation derived from eq 1 and as following: micro hole = capillary leaks (orifice diameter) > capillary leaks (nominal diameter) > copper wire leaks. Copper wire leaks showed the lowest leak rates, as the copper wire-induced leak channel is smaller than the OD of the copper wire itself, as reported by Nieto et al. (20). The leak rates of copper wires therefore cannot be compared to the micro hole and capillary leaks, as the actual leak sizes are not defined. The framed values in Figure 3 highlight the observation that leak rates of orifice sizes are significantly higher than leak rates of nominal leak sizes. This results from the strong dependence of the gas flow rate on the leak path length.
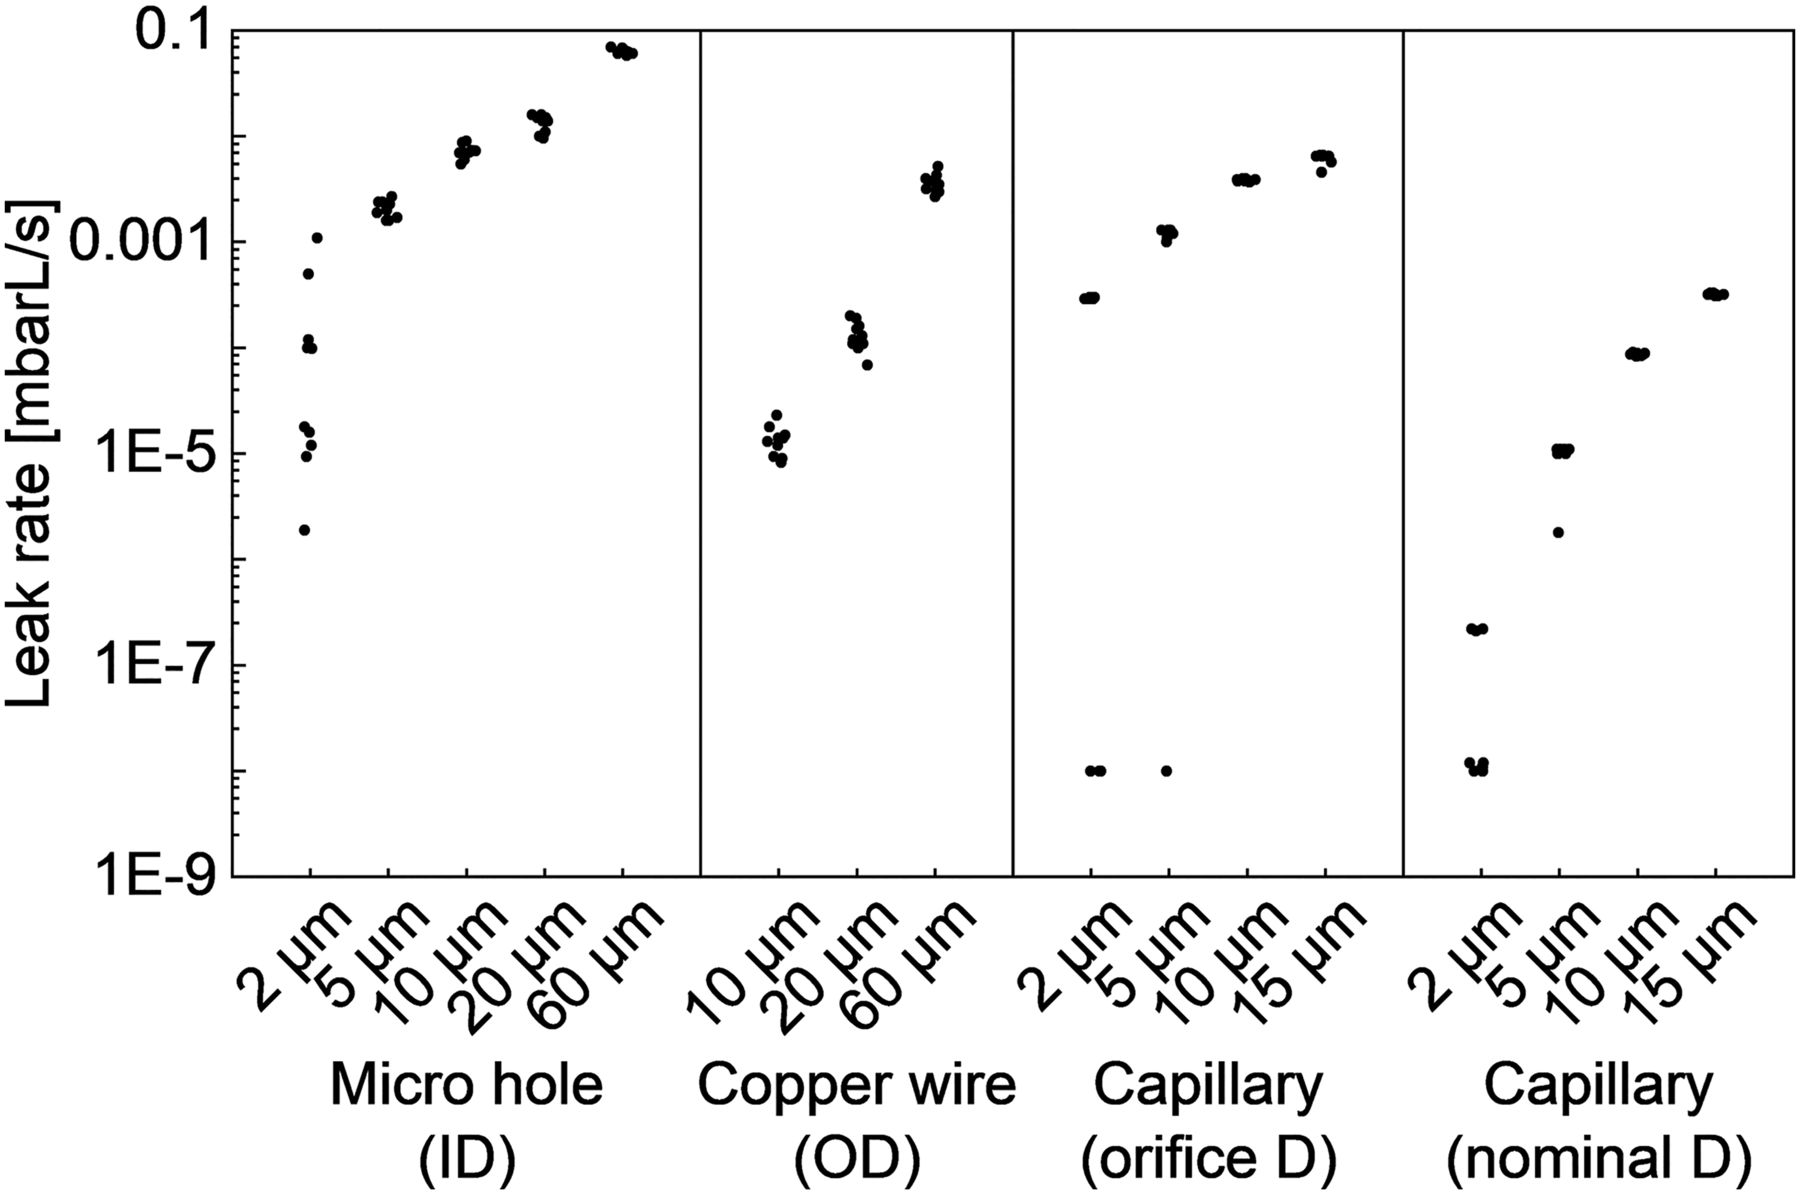
Figure 4 shows all measured He leak samples, including the ones which were excluded from further data evaluation. The data scatter in Figure 4 showed that some capillary leaks of small sizes were defective. These artificial leaks yielded leak rates between 1 × 10⁻⁸ mbar L/s and 2 × 10⁻⁸ mbar L/s, which indicated that no leak was present. These very small capillary leaks of 2 μm and 5 μm leak sizes were therefore assumed to be clogged in the course of unsuccessful leak preparation. These values were thus excluded from the data evaluation. This highlights the criticality of proper capillary leak preparation procedure or handling prior to testing, especially as small capillaries are difficult to handle and are readily susceptible to clogging.

Variability of leak rates (measured with He leak) of artificial leak types of different sizes (n = 10).
The variability in each sample group increased for smaller leaks, especially in the case of micro holes. Artificial leaks can have significant variability in the actual leak size and significant deviations from the nominal target leak size.
Laser-drilled micro holes can result in tortuous and irregular leak channels. The complex and irregular shapes of micro hole channels in syringes were previously documented photographically (9). Figure 2B also shows that the diameter of a laser-drilled micro hole may not be consistent along the path length. In this study, micro holes seemed to have the highest variability compared to capillary leaks and copper wire leaks, as can be seen in Figure 4. Particularly, the leak rates of the smallest micro holes of 2 μm varied significantly.
Capillary leaks, in contrast, are consistent channels with known tolerance of ID, yet very idealized and likely significantly different from leaks in real life. Apart from defective capillary leaks, which remained closed, the variability of capillary leaks can result from rough edges (caused by cutting or even breakage) or variance of capillary lengths. The capillary leaks with nominal diameter have a relatively low variability. Clearly, the capillaries with orifice diameter have per se low variabilities, as they were prepared according to the measured leak rate as described above.
It was observed that the copper wires can be entrapped in rubber stopper wrinkles. The variability of this artifact can be controlled by consistent capping parameters (20). The generated path length can also vary due to kinks in the wire, askew introduction of the wire between the sealing surfaces, or the possible breakage of the copper wire during preparation. Different stopper geometries can also have an impact on the path length of the entrapped copper wire. Rubber stoppers for lyophilization (lyo stoppers), for instance, feature so called “legs”. This may result in a longer path length depending on the copper wire position. In this study the capping parameters and the primary packaging components were absolutely consistent and the copper wire leaks were carefully prepared by a highly trained operator. Thus, the variability of the copper wire leaks was comparable for all leak sizes (copper wire OD 10, 20, and 60 μm), especially when compared to micro holes, but also compared to capillaries.
In general, the outliers on the low side are an indication for the leak being actually smaller than intended, for example, by partial clogging. Both capillaries and micro hole channels are prone to clogging by airborne particles or viscous liquids (e.g., grease or silicone oil in syringes) (6). Clogged leaks and especially partially clogged leaks are difficult to identify.
Quality of Artificial Leaks
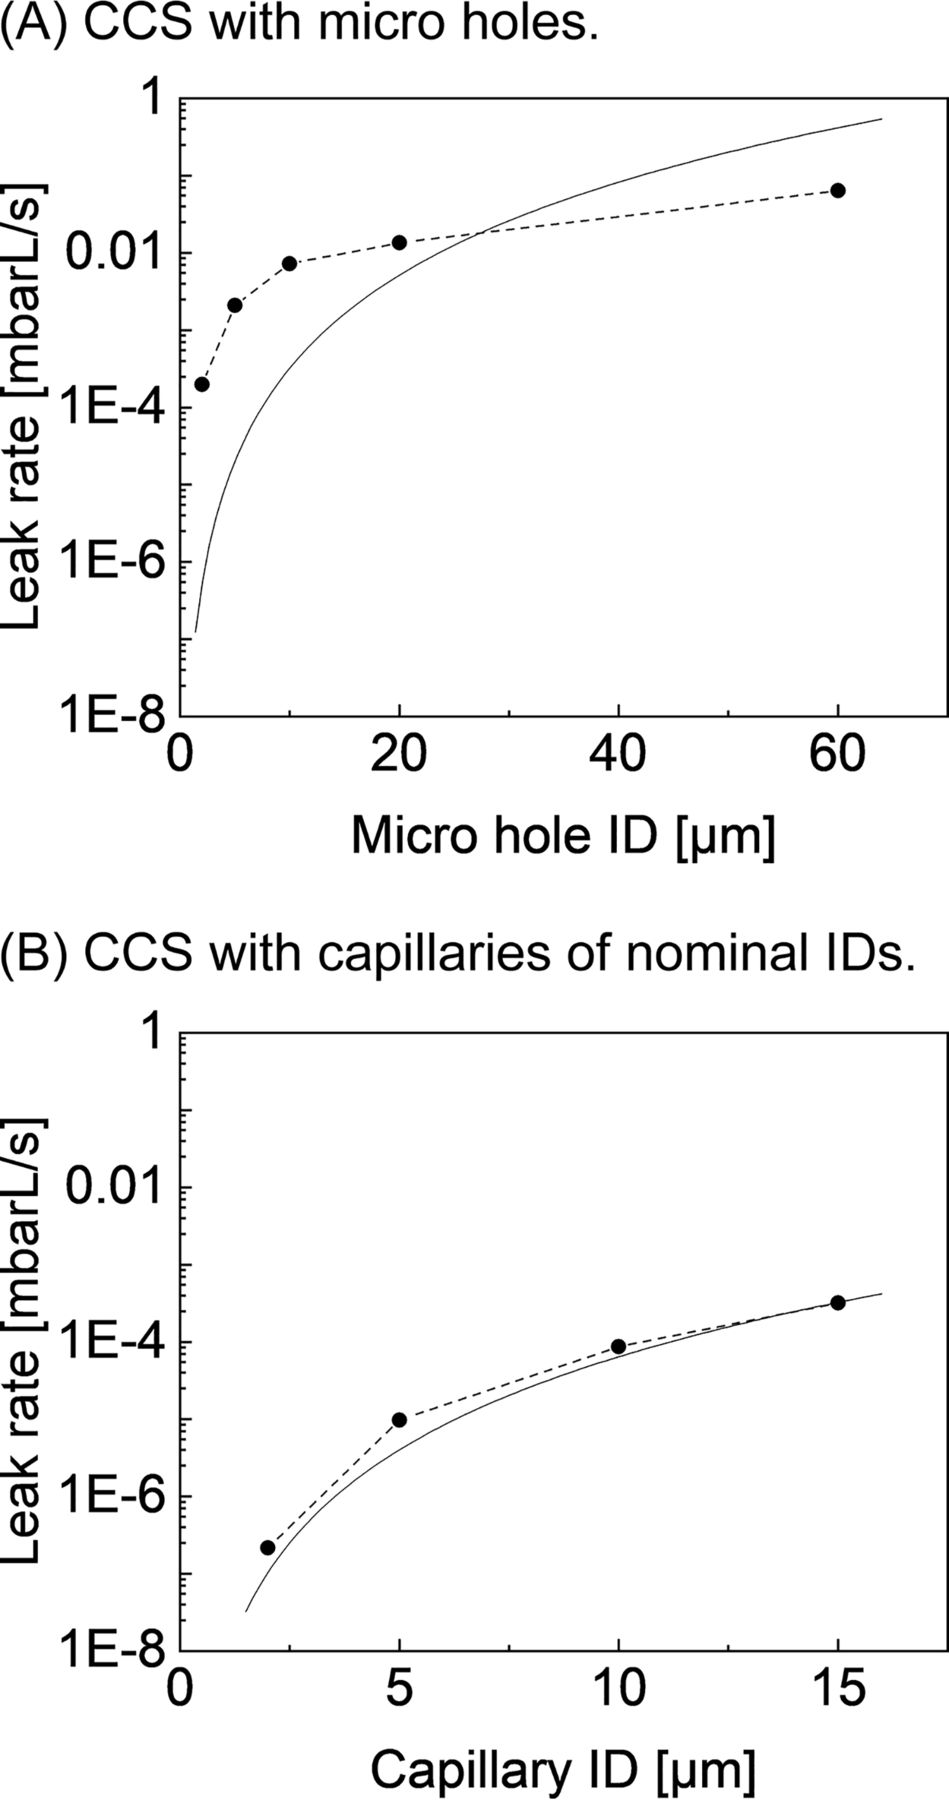
The actual sizes and quality of the artificial leaks were assessed by He leak measurements and compared to the theoretical leak rates calculated using eq 1 (Figure 5). For example, the measured He leak rate values for CCS with micro holes and capillaries of nominal diameter were compared to the theoretical leak rate. The black curves in Figure 5, A and B, represent the theoretical values derived by eq 1. Of note, the theoretical estimation (eq 1) applies for tubes with uniform ID and does not consider resistance from uneven wall structure in the leak channel, as was shown to be the case for micro holes (9). Furthermore, the actual leakage sizes (measured leak rates) deviated significantly from the nominal leak sizes. In particular, the smaller micro holes showed higher leak rate values than expected. In case of a 5 μm micro hole, the means of the measured values were 2.1 × 10⁻³ mbar L/s, whereas the values were expected to be around 4 × 10⁻⁵ mbar L/s based on the theoretical estimation. These results show that small micro holes were much larger than expected and nominally declared by the supplier. This could be due to an increase in size of this artificial defect due to sample handling by the user, but also due to shipping after preparation, measurement, and certification by the supplier (26). This highlights the risk in depending on leak size certifications for any artificial leak samples prepared elsewhere and not at the site of testing. The measured He leak rates of capillaries with nominal diameter showed a good correlation to the estimated leak rate values for all tested leak sizes.

Means of measured He leak rates of CCS with (A) micro holes and (B) capillaries of nominal diameter and estimated leak rate values for different nominal IDs and respective path length (micro hole: l = 1 mm, capillary: l = 10 mm) according to eq 1 (black curve).
Comparison of Capillary Leaks with Nominal Diameter and Orifice Diameter
Another interesting aspect of this study was to compare capillary leaks of nominal leak sizes to capillary leaks of orifice sizes (orifice size referenced in the revised USP <1207>). Leaks with orifice diameter were prepared by adjusting the length and ID of the capillary according to the calculated leak rate (eq 1). The prepared samples were verified by He leak rate measurement.
The difference between the capillary leak types regarding the obtained He leak rate can be seen in Figure 3. Capillaries with orifice sizes (no path length) yielded significantly higher He leak rates for all leak sizes (2, 5, 10, 15 μm) compared to capillaries of nominal diameters. Because the capillary leaks with nominal diameters had a consistent path length of 10 mm, He leak rates were significantly lower given the negative proportional relation of the path length to the leak rate (eq 1). This is also reflected in Table I showing the detectability of the artificial leaks by the different pCCIT methods.
Capillary leaks of 10 μm nominal diameters could only be detected using the most sensitive He leak detection method. In contrast, leaks from 10 μm orifice diameter capillaries could be reliably detected by all methods including the dye ingress method. These observations highlight the importance of the capillary diameter and path length used to create the artificial leaks in creating sensitive positive controls. Positive controls in container closure integrity testing are vital in order to draw relevant conclusions of such integrity tests.
Conclusion
We have evaluated a variety of commonly used methods to generate artificial leaks and tested method performance of various physical CCI tests, such as dye ingress, He leak, HSA, and vacuum decay, against four artificial leak types. Under our specific test parameters, the probabilistic dye ingress method showed the lowest method sensitivity and significant variability compared to all other pCCIT methods included in this study. The vacuum decay method applied showed lower sensitivity compared to the He leak and HSA method and detected leaks of 5 μm orifice diameter and even demonstrated detection capabilities for leaks down to 3 μm with a statistical security level above 6σ. The HSA method used here detected leaks of 2 μm orifice diameter. The He leak method was able to detect 2 μm nominal sized micro holes. The results of our study confirm that the He leak detection method shows the highest sensitivity of all pCCIT methods but has the drawback of being destructive.
The He leak method was suitable to determine actual artificial leak sizes. The He leak rate results also allowed a correlation between the different leak sizes (ID, orifice diameter, or OD of copper wire) and the actual leak size measured. Capillary leaks (especially the ones prepared with orifice diameter) showed low variability, which is likely due to a consistent diameter of the capillary tubes. The copper wire leaks also showed acceptable and consistent variability for leak sizes, which could be achieved by an accurate preparation procedure, using consistent primary packaging materials and consistent capping parameters. Micro holes, especially small holes of 2 μm ID, tended to show a high variability.
When comparing actual nominal leak sizes of artificial leaks versus actual leak sizes measured by He flow rate, the smaller sized artificial leaks showed significant variability. This highlights the conclusion that actual leak sizes/rates are often far off their target sizes/rates and that the actual leak size differs between different artificial leak methods. While the use of samples with artificial leaks is mandatory for determining method sensitivity and as positive controls during actual testing, it is imperative to (a) always mention and refer to the method actually used to generate artificial leaks and (b) consider that nominal leak sizes are not the actual ones. This study also shows that nominal leak sizes generated by the various artificial leak methods cannot be easily correlated to actual leaks or defects, and may be misleading in interpreting results in the context of microbial ingress. An offset in actual leak sizes and expected nominal leak size could have various reasons, including change in leak size due to sample shipment, handling, or change during measurement, such as partial clogging. This highlights the risk in depending on leak size certifications for any artificial leak samples prepared elsewhere and not at site of testing. In light of the above conclusions, copper wires may be a robust method for introducing artificial leaks given the possibility of generating such samples at site of testing and its relation to some possible defects. It is recommended to evaluate artificial leak samples by He leak measurements ideally prior to and after their use as positive controls, to confirm and evaluate actual leak sizes and thus, system suitability.
In general, the selection of an appropriate CCIT method should be based on the intended purpose. Product properties with potential impact on CCIT sensitivity, such as high sugar or salt concentrations, or high viscosity, need to be considered. CCS qualification and process characterization are typically performed using a highly sensitive CCIT method (e.g., He leak), whereas for routine manufacturing and quality control purposes less sensitive CCIT methods (e.g., HSA, vacuum decay or dye ingress) are justifiable. In this context, non-destructive tests such as vacuum decay or HSA offer the opportunity of 100% in-line control.
Conflict of Interest Declaration
The authors declare that they have no competing interests.
Abbreviations
- atm. pressure
- Atmospheric pressure
- CCI
- Container closure integrity
- CCIT
- Container closure integrity testing
- CCS
- Container closure system
- CQA
- Critical quality attribute
- DP
- Differential pressure
- He
- Helium
- HSA
- Lased-based headspace analysis
- ID
- Inner diameter
- LOD
- Limit of detection
- LOQ
- Limit of Quantification
- mCCIT
- Microbial container closure integrity testing
- N2
- Nitrogen
- O2
- Oxygen
- OD
- Outer diameter
- pCCIT
- Physical container closure integrity testing
- SD
- Standard deviation
- SST
- system suitability test
- USP
- United States Pharmacopeia
- PFS
- prefilled syringe.
- © PDA, Inc. 2019
References


Jump to section
Related Articles
Cited By...
- Comparing Container Closure Integrity Test Methods--Performance of Headspace Carbon Dioxide Analysis versus Helium Leakage Using Positive Controls
- A Multicompany Survey Study for Helium Leak Container Closure Integrity Test
- Container Closure Integrity Test Using Frequency Modulation Spectroscopy Headspace Analysis with Carbon Dioxide as a Tracer Gas