
Abstract
Eudralex volume 4, Annex 1, the European Union Good Manufacturing Practice for sterile products, requires that “The integrity of the sterilised filter should be verified before use” (1). Implicit in this requirement for a PUPSIT is the rationale that the sterilizing filter could sustain damage during sterilization or use (i.e., subsequent to any pre-use test conducted prior to sterilization), causing a defect which would not be detected by the post-use integrity (“masked” during filtration). To assess whether a filter defect could be masked by partial filter plugging, we evaluated the impact of the bacterial challenge test (BCT) on the bubble point (BP) of the test filters. The BP tests that are conducted before and after the BCT have been collected and compared for 2086 filters (1571 × test filters and 515 × control filters), representing 531 BCTs on 518 different pharmaceutical products, buffers, and in-process fluids. These tests comprise a cross section of fluids from multiple firms spanning the pharmaceutical and biotechnology industry. A posttest to pretest BP ratio was calculated for each filter and the distribution of these ratios examined to determine whether there were cases of elevation of the BP because of bacterial loading to the point where masking of a filter defect could occur; that is, if a defective filter could pass integrity testing due to apparent reduction in filter pore size because of the bacteria retained during the BCT. Ratios were averaged across all tests for the same test fluid. The mean average ratio was 1.00 ± 0.15, indicating that on the average, elevation of the BP does not occur. To assess the risk of masking a filter defect, observed BP ratios were compared to the ratio of the minimum BP specification of a 0.2 μm filter to that of a 0.45 μm filter of the same membrane type. The lowest such ratio for any membrane type was 1.33. A BP ratio equal to or higher than this ratio was considered a risk for masking, because a 0.45 μm filter could appear to meet the specifications of a 0.2 μm filter. Out of 518 average BP ratios, only eight fluids (1.5%) produced BP ratios meeting this criterion for a masking risk. Potential risk factors associated with these cases are discussed. We conclude that filtration processes producing BP changes sufficient to present a risk of masking defects are not common, and are detectable during the routine BCT. The BP ratios observed during routine BCT are one means to assess the potential of a given filtration process to mask defects and can be considered when determining whether a PUPSIT should be implemented.
- Annex 1
- Bacterial challenge test
- Bubble point
- Filtration risk management
- PUPSIT
- Sterile drug products
- Sterilizing-grade filters
Introduction
Pre-use/post-sterilization integrity testing (PUPSIT) has been a widely debated topic for the last several years. To a large extent, the debate is because of the fact that scientific data were not available to provide additional clarity that could inform appropriate risk-based judgements and commensurate actions. To gain clarity, the Parenteral Drug Association (PDA) and BioPhorum Organizations Group (BioPhorum) formed the Sterile Filtration Quality Risk Management (SFQRM) consortium in late 2017. The consortium goals have been to fill existing gaps in scientific data as adequately as possible with studies and industry guidance that would provide professionals and license holders with the ability to make informed decisions about appropriate risk management strategies. This paper is one in a series of publications that are the result of the collaboration, and these should be considered together and viewed holistically in order to determine the best course of action with regard to PUPSIT. In total, the four papers cover the following areas: (1) data mining to determine the influence of fluid properties on integrity test values (this publication), (2) filter masking studies and results, (3) risk assessment and management from filter production to end use, and (4) points to consider in the best practice of the use of PUPSIT. In total, 25 manufacturers and filter suppliers have contributed to the work of the Consortium, deploying their filtration experts and pooling their collective knowledge and applied science experience to address these questions. This effort has also been supported by many independent experts currently available that have contributed to and driven the Filtration Interest Group in PDA for many years. Both PDA and BioPhorum have prioritized this program and combined their approaches to deliver this comprehensive body of work. We hope that collectively the publications aid decision making, create greater certainty and confidence and above all alignment among suppliers, manufacturers, and regulators alike on these important questions. A primary rationale for the requirement to conduct an integrity test on a sterilized filter before use (1) is that some damage to the filter that occurred during sterilization (or subsequent handling or transportation) could become “masked” during the filtration process, so as not to be detected by the post-use integrity test. Masking or blocking of membrane pore structures may also shift the integrity test value. A shift in the integrity test value during bacterial challenge testing could be a first indication of potential variability in the post-use test that might prevent detection of a filter defect. To determine whether this has a detectable influence, we evaluated data from a sample of laboratory-scale bacterial challenge tests (BCTs) conducted as part of filter validation to assess whether there is any elevation of the post-use bubble point (BP) that could potentially mask filter damage and give a passing (in this case false-passing) result from a damaged filter.
When filter users conduct a BCT in their products as part of filter validation, three test filters (usually 0.2 μm rated – “0.2” is used here for filters rated at either 0.2 or 0.22 μm) from different lots and one 0.45 μm rated control disk are exposed to product under conditions that are worst-case for the production process with respect to duration, flow rate, total volume processed, and differential pressure (2⇓–4). At the same time, these filters are exposed to a microbial load >107 cfu/cm2, a severe worst case for the bacterial load during any process. Under such conditions, the test and control filters are typically partly plugged, as shown by a reduction in the volumetric flow rate for a given pressure, and therefore a challenge of >107 cfu/cm2 represents a significant fraction of the filter capacity, such that decay of the flow rate is often observed during such testing (4). From studies conducted at high challenge levels, one can infer that a microbial load of ∼109 cfu/cm2 is the maximum achievable without plugging (5, 6).
For each BCT, the test and control filters are integrity tested both before and after the test. This is typically a BP test owing to the small size of the filters used for the scaled-down BCT. The effect of exposure to the process fluid under exaggerated process conditions and severe microbial filter load during this test may be used to screen for indications of masking of a filter defect by contaminants impinging on the filter.
The difference between the pre-test and post-test BP result is a potential indicator of the potential of the product and bacterial load on the test and control filters to change the filter’s BP and thereby potentially “mask” a 0.2 μm “defect” or a 0.45 μm “defect”, respectively. An elevation of the posttest BP relative to the pretest BP would be evidence of the capability of the product and bacterial load to mask a defect larger than the largest normally occurring filter membrane pores. A defect, by definition, should be larger than the filter pores themselves. This is arguably a worst case for masking of the smallest defect occurring during filter production and use and detectable by most integrity tests (7). The “critical size” of a defect for allowing microbial passage appears to be ∼2.5 μm for a liquid challenge and ∼12.5 μm for an aerosol challenge, as determined in tests of films and containers (7). That is, any level of plugging capable of masking an actual filter defect would certainly be expected to partially or completely obstruct the pores in a 0.2 or 0.45 μm rated membrane. Note that the distribution of pores in a 0.2 μm rated sterilizing-grade membrane includes pores much larger than 0.2 μm—the filter is rated for retention, not for physical pore size (5).
Although the 0.45 μm control filter is an important control for the BCT (passage of the test organism though this filter demonstrates the validity of the test), for the purposes of evaluating the impact on the BP, the BPs of the control filters can be treated in the same manner as the BPs of the test filters.
The purpose of this data mining study was to evaluate the potential of a large variety of fluids to increase the BP between pre- and posttest (where they can be shown to be comparable) to a point where small defects might be masked.
Objective/Hypothesis
The objective of this data mining study was to collect the product-specific BCT data (0.2 μm test filters and 0.45 μm controls) that are generated by all companies as part of their filter validation studies, and to review this data set for BP increases that could potentially mask damage. One objective of this study was to statistically test the hypothesis, “The posttest BP is the same as the pretest BP.”
An increase in BP sufficient to raise the BP of a 0.45 μm filter to that of a 0.2 μm filter is the minimum effect that could potentially mask damage. That is, if a given fluid/filtration process can plug a filter enough to make a 0.45 μm filter (only partially retentive) look like a 0.2 μm filter (fully retentive), and if it is found that a 0.45 μm filter could have its BP increased with the same fluid to that of a 0.2 μm filter, this suggests the possibility of a false-passing integrity test, which would then suggest PUPSIT as one of the tools for risk mitigation.
Therefore, the ratio of the posttest BP to the pretest BP was compared to the “BP ratio”, the ratio of the filter manufacturer’s minimum BP specification of a 0.2 μm filter to the manufacturer’s minimum BP specification of a 0.45 μm filter.
The second objective was to determine the frequency at which BP increases of this magnitude occurred during BCTs.
We propose that the BP ratio that is observed during the BCT can be used to assess the risk of masking a filter defect during production filter use.
Materials and Methods
Data have been submitted by two users and all four participating filter manufacturers’ filter validation laboratories, with each BCT generally consisting of three 0.2 μm filters and one 0.45 μm filter. For most of these tests, pretest and posttest BPs were collected for each filter. Exceptions occurred if the test filters were capsules and diffusive flow was used to determine integrity, and if the BP of the 0.45 μm control was not available. The entire data set has been included as Appendix Table S-I.
Summary Statistics of Filter Bubble Point (BP) Ratiosa
This data set includes pretest and posttest BPs on 2086 filters (1571 × 0.2 μm filters and 515 × 0.45 μm filters), representing 531 BCTs on 518 different pharmaceutical products, buffers, and in-process fluids.
In eight cases, replicate sets of tests on the same process fluid have been included: these are test index numbers 4 and 5, 6 through 8, 9 through 12, 13 and 14, 15 through 17, 18 and 19, 43 and 44, and 180 through 182.
For practical reasons, we chose to use the average of all replicate tests (both test and control filters) of the same products, buffers, and in-process fluids to avoid the need to introduce unwarranted statistical complexity, except when treating differences by membrane type (see following). All replicate tests (both pre- and post- BPS) with a given fluid will be referred to as a “test set” or “set.” Except for the replicates described above, each test index number constitutes one test set.
Therefore, the data set actually comprises 518 average-corrected ratios from the combined test and control filters for each test. Because some tests included data only from the control filter, whereas others included data only for test filters, there were 512 average ratios for test filters alone, and 506 ratios for control filters alone. Again, for practical reasons, we chose to use the average of all replicates (test and control) to avoid unwarranted statistical complexity.
A subset of the data (test filters only) was used for analysis by membrane type, as described following.
Tests were assigned index numbers, after which all product identifiers and other proprietary information were removed, and each contributor was provided with the index numbers for the tests they had submitted. Each filter membrane type was assigned a code to replace identification by manufacturer and trade name (polyethersulfone (PES) filters identified as PES1, PES2, polyvinylidene fluoride (PVDF) filters identified as PVDF1, PVDF2, and so forth).
The 0.45 μm control filter for each BCT was not necessarily of the same membrane type as the three test filters, but rather was selected by the laboratory to serve as a positive control and to ensure the suitability of the bacterial suspension to challenge a sterilizing-grade membrane (2⇓–4). Information on the nature of the 0.45 μm control filter was not collected. In one case (index number 22), the three test filters were also 0.45 μm filters.
Because the posttest BP was not always conducted in the same fluid as the pretest BP (e.g., with the filter wet with the product being tested), a correction factor was applied to the posttest BP, when available. In most cases, this factor had been independently determined as part of filter validation testing to obtain a product-wet BP (i.e., the BP ratio derived from multiple tests on at least three filter lots during filter validation). When the pretest and posttest were conducted in the same fluid, this factor was set at 1.00. The correction factor used for each test is also provided in the data set.
The ratio of the corrected posttest BP to the pretest BP was calculated, and this was the value used to characterize the effect of the product exposure and bacterial challenge on the BP. When the relative difference of the corrected posttest BP from the pretest BP was used instead of the ratio, the results were very similar.
The manufacturer’s minimum BP specifications as published for field use by filter users were contributed by the authors and confirmed against publicly available commercial literature such as filter data sheets.
The statistical analysis was performed using Minitab (version 19.1.0.0) under the advice of a statistician. The null hypothesis was that the BP ratio was equal to 1. The BCT on each product consisted of three replicates and a 0.45 μm control filter. To account for relatedness of all filters from a given BCT, statistical analysis used the average-corrected BP ratio for all filters from a given BCT. Ratios of the BPs (corrected post-BP/pre-BP) for replicates within each test (all three test filters plus the control filter) were averaged before statistical treatment. Our primary measurement was the mean of the corrected BP ratios for the four replicates from each test.
Although the 0.45 μm control filters can be considered a fourth replicate for each test, the membrane type of the 0.45 μm control was not necessarily the same as that of the test filters and was not identified in our data set, necessitating exclusion of the 0.45 μm controls when membrane type was being considered. For the analysis by membrane type, only the three replicates for each test were averaged before statistical treatment, because the membrane type of the 0.45 μm control filters was not known. Where the test and control filters were treated separately (to examine the effects of membrane type), data consisted of 512 average-corrected ratios from the test filters and 506 corrected ratios for the 0.45 μm controls. The difference in totals from the number of tests reported overall occurs because replicate tests on a single product were averaged together. Note that if the test filters were identified as 0.45 μm filters (one case), they were included with the 0.2 μm test filter data.
Statistical treatments for analysis of the impact of the product type and the impact of the membrane type by analysis of variance (ANOVA) were performed separately because of the limited sizes of the samples corresponding to some products and/or membrane types. There were insufficient data to understand whether any impact of membrane type varied by product type or vice versa (interactions between membrane type and product type impacts). Not all membrane types were represented within each product type.
Results
Data Sources and Physical Description of the BCT Bubble Points
This data set includes pretest and posttest BPs on 2086 filters (1571 × 0.2 μm filters and 515 × 0.45 μm filters). The pretest BP was always conducted in a standard fluid, either water (for a hydrophilic filter) or an alcohol mixture (for a hydrophobic filter). The posttest BP was either conducted while the filters were wet with the challenge fluid or after flushing the filters with a reference fluid, usually the same fluid used for the pre-test.
A correction factor was applied to the posttest BP when the posttest BP was not conducted in the same fluid as the pre-test BP. For 224 BCTs (a total of 672 × 0.2 μm filter results and 224 × 0.45 μm results), the posttest was conducted in the same fluid as the pre-test, so no correction was required (the correction factor was 1.00). For the other BCTs, a correction of the post-test BP was necessary. For three of these BCTs, no factor was available, and 1.00 was used by default. For the remainder of the data, a correction factor was available as an independently determined BP ratio.
The complete data set (pre-test BPs, correction factors, and posttest BPs) has been included in Appendix Table S-I.
Three BCTs (9 × 0.2 μm filter BPs and 3 × 0.45 μm filter BPs) could not be corrected for the effects of a different posttest wetting fluid, because no correction factor had been determined in the original testing. In addition, some BCTs may have required use of a surrogate, so that the correction factor for the product may not have been appropriate. Our data set did not include whether or not a surrogate was used in each test. Not enough information about each test was available in the blinded (nonproprietary) form to determine the extent or impact of incorrect BP correction factors. However, survey of the available correction factors shows that correction factors far from 1.00 are rare, so that a large impact is unlikely.
The ratio of the average-corrected post-test BP to the average pre-test BP was used to assess the effect of the exposure to process fluid and bacteria on the BP. A ratio >1 indicated an increase in BP, whereas a ratio <1 indicated a decrease.
Summary Statistics and Distributions
Each set of BCT results (three test filters and one control filter in most cases) were related by exposure to the same fluid and by use of the same correction factor. Therefore, statistical treatment of the data used the average BP ratio for all filters from a given BCT (a “set”) except where indicated.
The mean ratio of the corrected post-test BP to the pretest BP was 1.00 (two decimal places) for all filters (considered as sets of four replicates), 1.00 for all test filters and 0.99 for all control filters. The data have a narrow distribution around the means of 0.99 to 1.00, as evidenced by the standard distribution (sd). The sample sd for the average ratio was 0.15 for all filters (sets of four replicates), 0.14 for all test filters (in sets of three), and 0.21 for all control filters. Summary statistics for these data sets are shown in Table I.
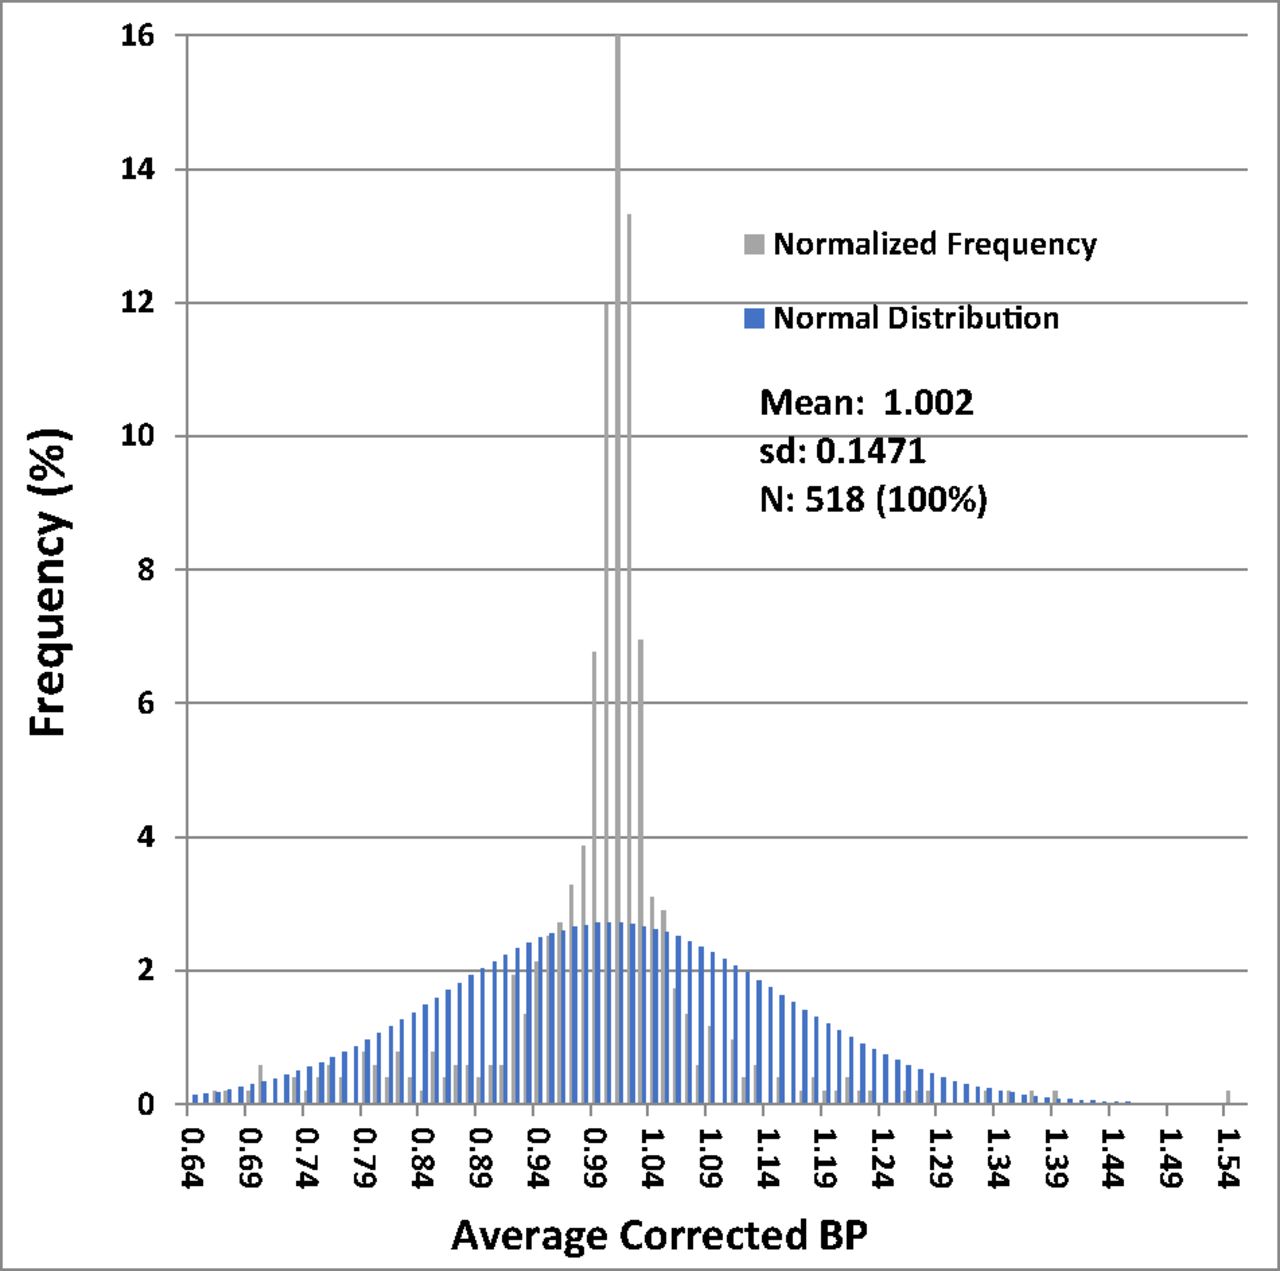
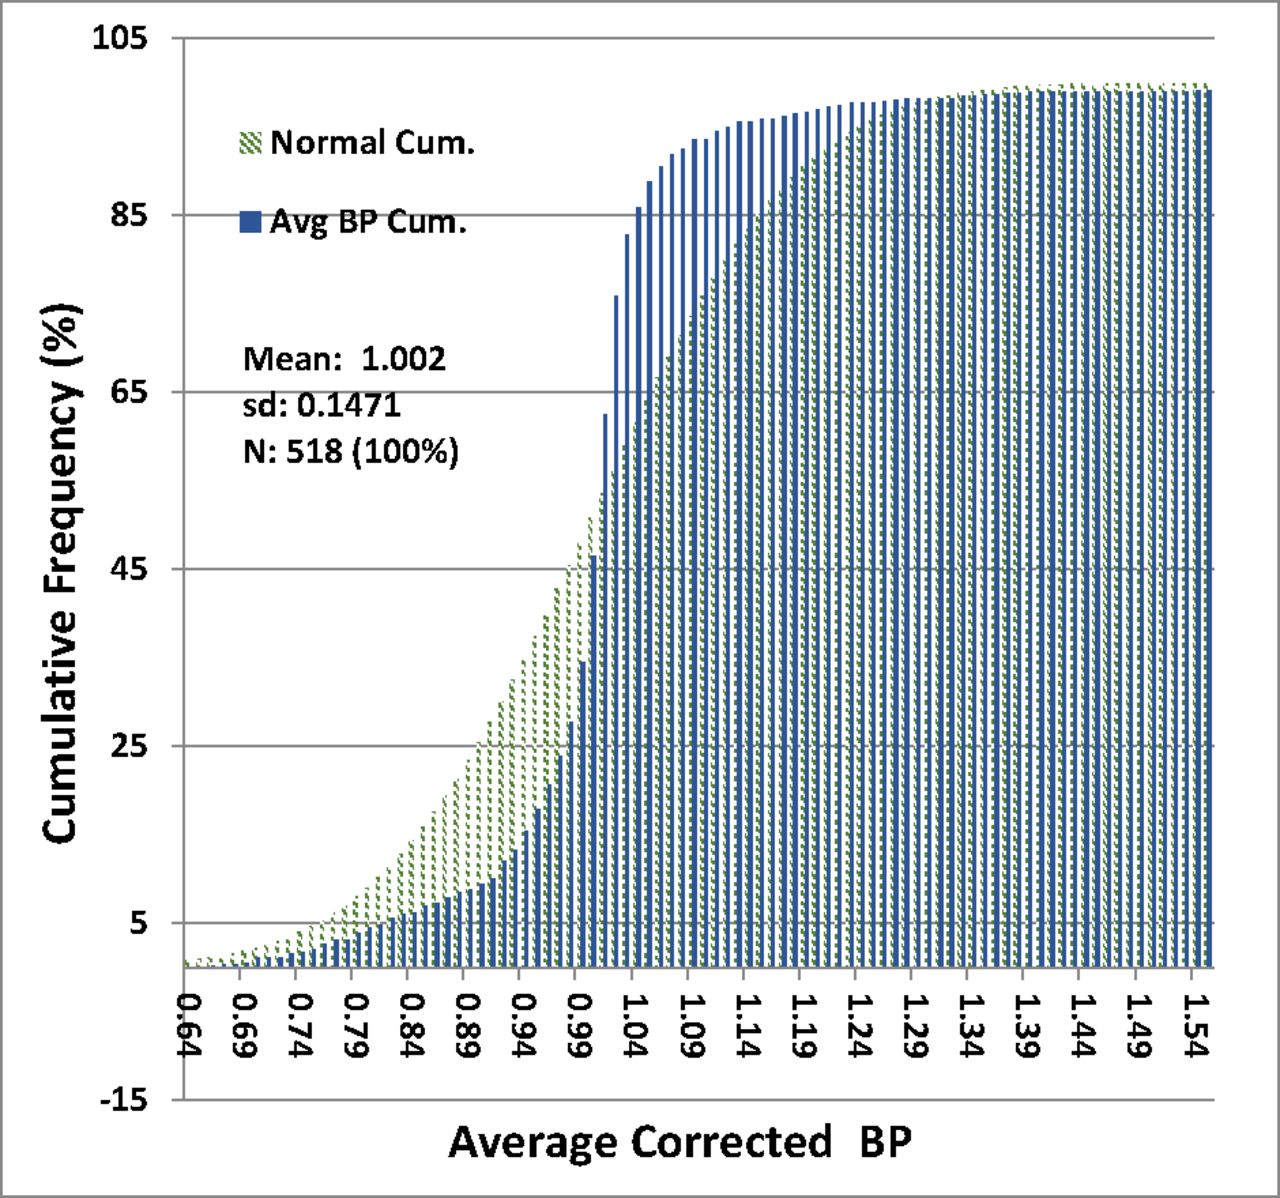
The distribution of average corrected BP ratios for all filters is given in Table II. The distribution functions for BP ratios of all filters are shown graphically in Figure 1 and Figure 2, superimposed with normal distributions calculated with the empirically derived means and sds of the filter ratio distribution. Figure 1 is a histogram of the BP ratio distribution superimposed on a normal distribution of the same mean and standard deviation, and Figure 2 shows the cumulative probability of BP ratios.

Distribution histogram of bubble point (BP) ratios—all filters: The normalized distribution histogram of all average corrected test BP ratios in % of the data is plotted against the value of the ratio in increments of 0.01 and is shown by the gray bars. The normal distribution with the same mean and standard deviation is shown by the blue bars.

Cumulative probability of bubble point (BP) ratios—all filters: The cumulative probability of occurrence of all average-corrected test BP ratios plotted against the value of the ratio in increments of 0.01 (blue bars), superimposed on a normal distribution of the same mean and standard deviation (sd) (green bars).
Distribution of Average Bubble Point (BP) Ratiosa
The data were clearly not normally distributed; which was as expected for ratios. The data for all three data sets comprising all filters, as well as for test filters only and control filters only (not shown) were more tightly clustered around the mean than normally distributed data.
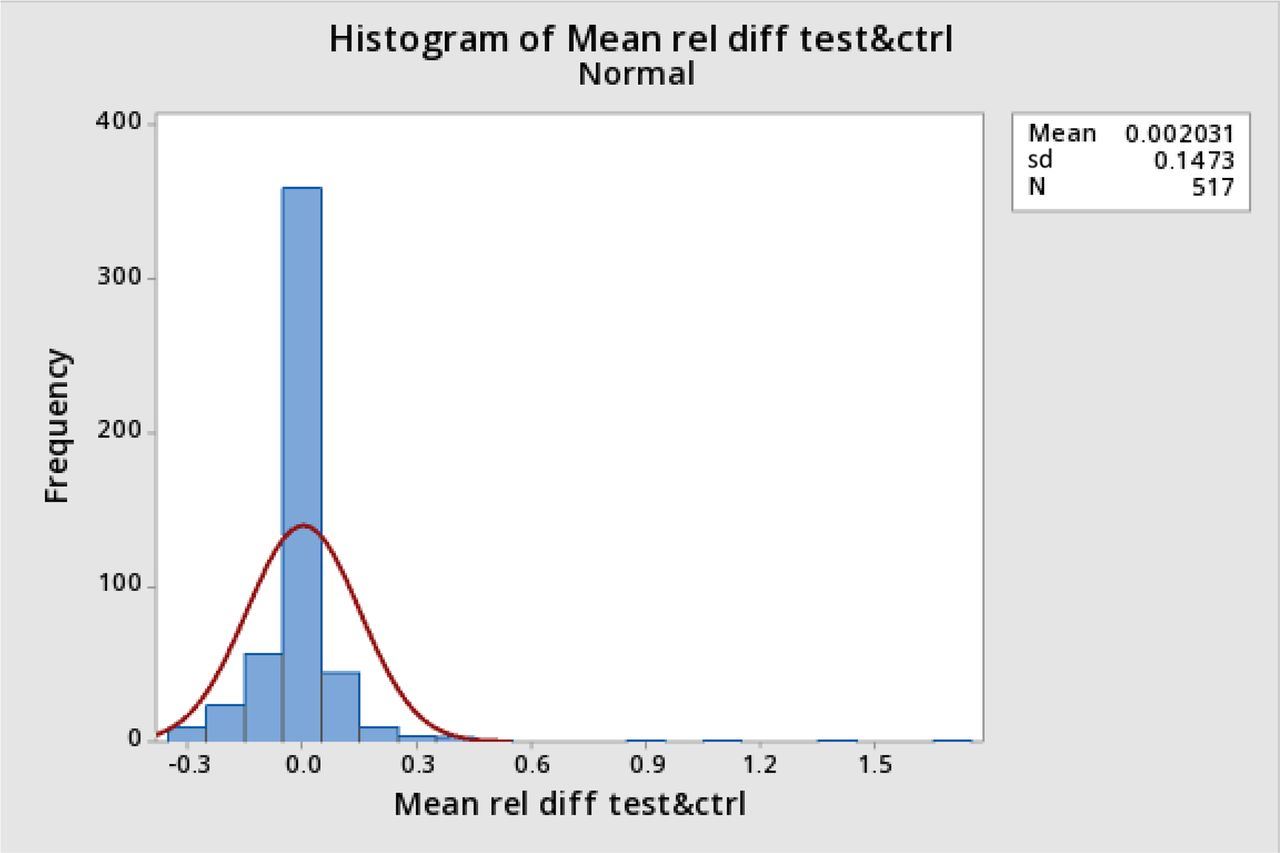
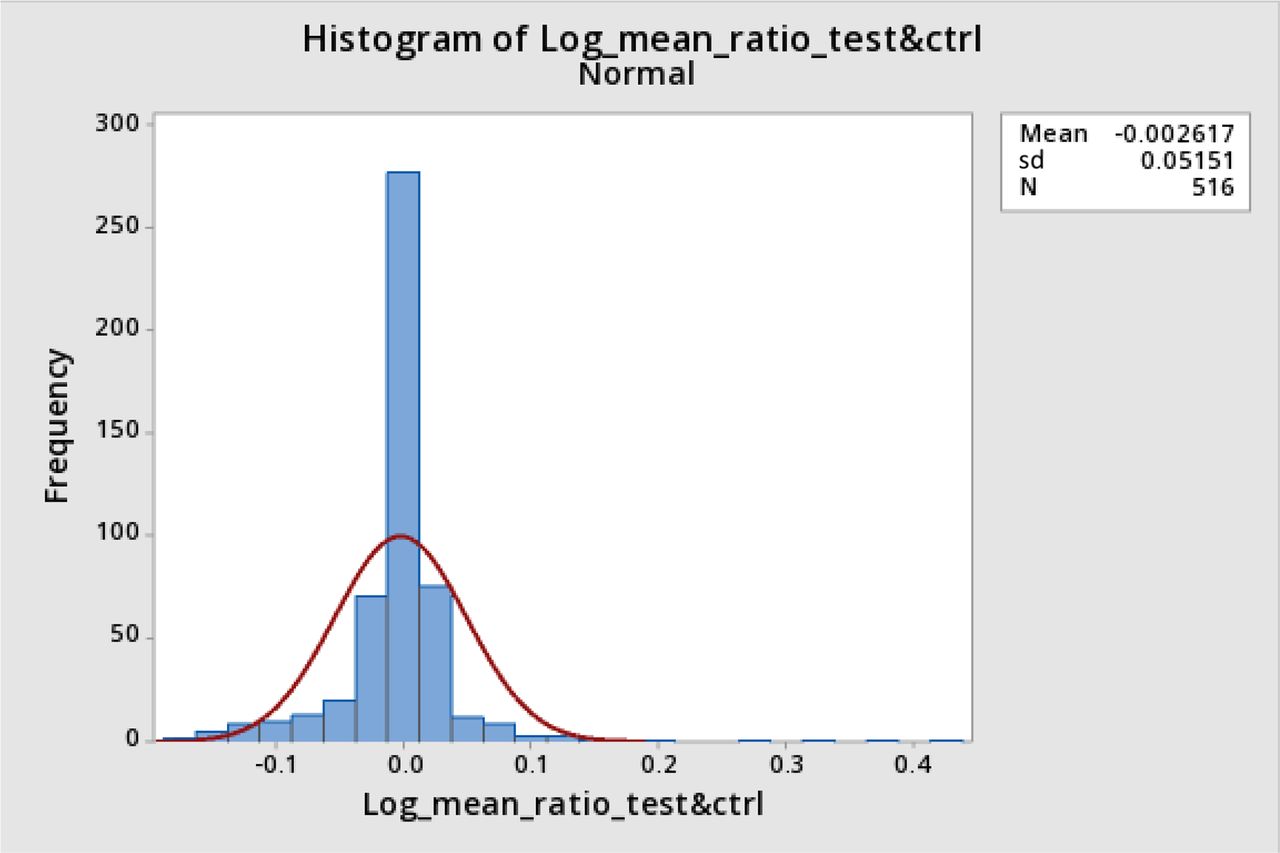
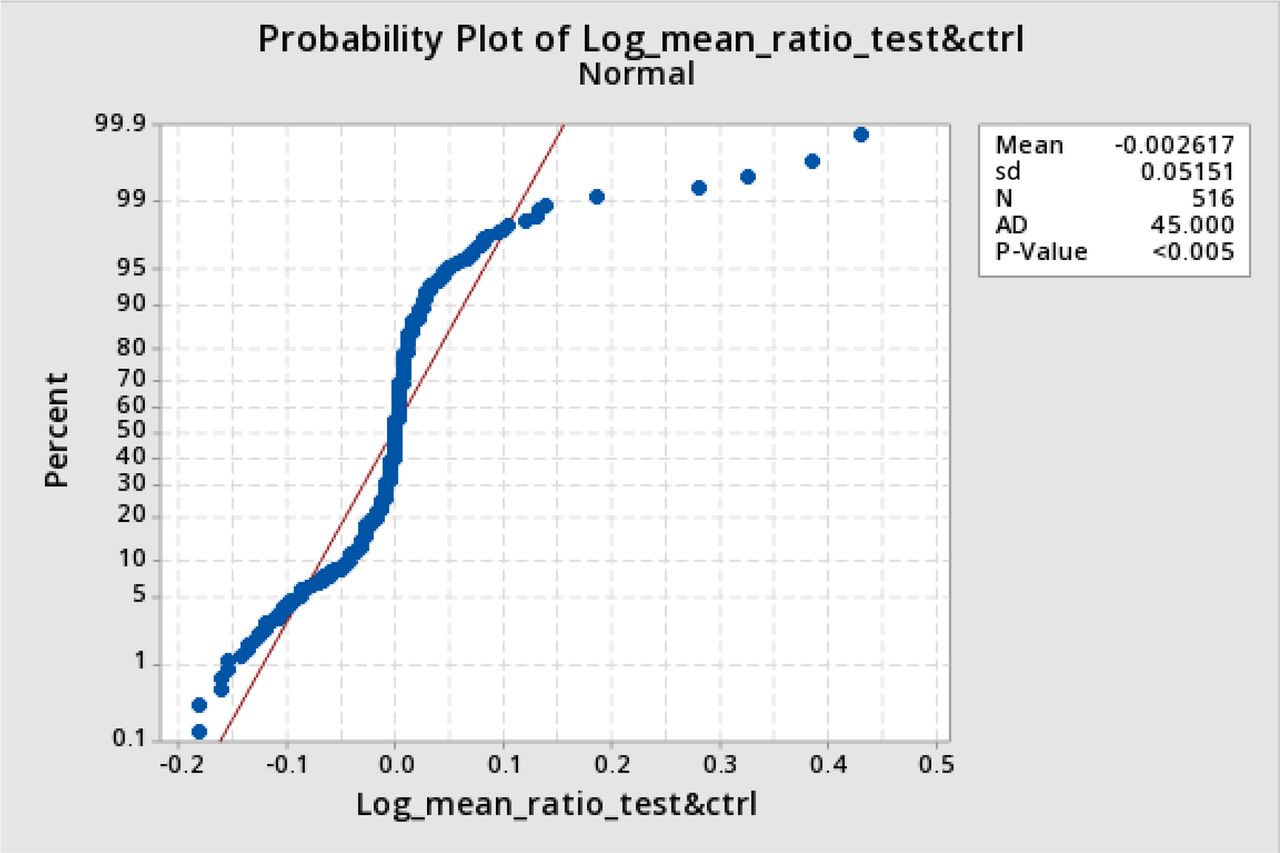
However, the data were also not normally distributed when expressed as a relative difference, nor when transformed to a log ratio. Figure 3 shows the distribution histogram for the data expressed as the relative difference (corrected post-BP−pre-BP)/(corrected post BP), and Figures 4 and 5 show the distribution histogram and cumulative probability, respectively, when the data are plotted as log10 of the corrected BP ratios.

Distribution histogram for bubble point (BP) relative difference and corresponding normal distribution: The normalized distribution histogram of all average-corrected posttest BP relative difference from the pretest BP as % of the data is plotted against the value of the relative difference and is shown by the blue bars. The normal distribution with the same mean and standard deviation (sd) is superimposed (red line).

Distribution histogram for log bubble point (BP) ratio and corresponding normal distribution: The normalized distribution histogram of the logarithms of all average-corrected test BP ratios is plotted against the value of the log ratio and is shown by the blue bars. The normal distribution with the same mean and standard deviation (sd) is superimposed (red line).

Cumulative probability for log bubble point (BP) ratio and corresponding normal distribution: The cumulative probability of occurrence of a given value of log average test BP ratios plotted against the value of the log ratio (blue dots), superimposed on a normal distribution of the same mean and standard deviation (red line).
Tests on the Hypothesis That the Corrected BP Ratio is Equal to 1.
The summary statistics in Table I indicate a tight distribution centered around a mean value of 1, and the confirmatory hypothesis tests showed no evidence that the average corrected BP ratio differs from 1. A one-sample two-sided t-test with a null hypothesis ratio = 1 yielded p = 0.77; the nonparametric Wilcoxon test yielded p = 0.45. Both p values are far greater than the usual threshold value for statistical significance of p < 0.05.
Membrane Type Effects.
Means and 95% confidence intervals by membrane type are reported in Table III.
Means, Standard Deviations, and Confidence Intervals of Bubble Point (BP) Ratios by Membrane Typea
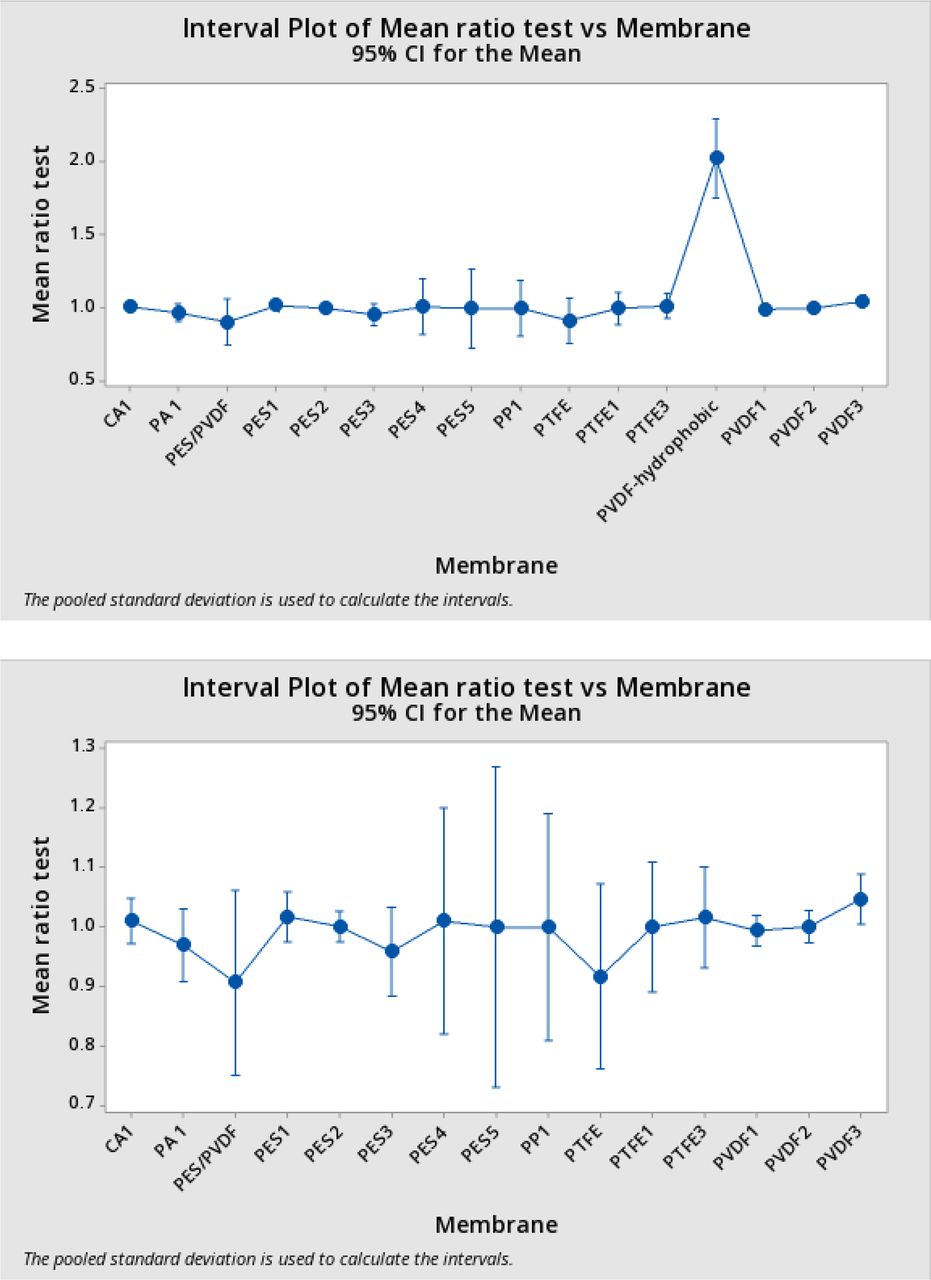
The means of the BP ratios for all membrane types were essentially 1. Those ratios with differences from 1 also exhibited low values of n. There was little evidence of any impact from the membrane type. One-way ANOVA yielded a p value of 0.72 (the single test for PVDF-hydrophobic was excluded here as it had a remarkably disproportionate influence on the ANOVA, in fact yielding p < 0.05 if included). Any differences were relatively small in percent terms, as shown in Table IV.
Comparison of Individual Membrane Type Means to Overall Meana
The results in Table IV are shown graphically in Figure 6, upper panel. Note that the single data point for a hydrophobic PVDF membrane is anomalous. The high BP ratios calculated for this BCT have been attributed to an incorrectly determined correction factor, although this could not be confirmed. Therefore, the data for “PVDF – Hydrophobic” was excluded from the ANOVA. Figure 6, lower panel, shows the result with PVDF-Hydrophobic omitted.

Mean test ratio by membrane type with 95% confidence intervals: The means of the average test bubble point ratios for each membrane type (from Table IV) are plotted against the membrane type, with bars showing the 95% confidence limits of a normal distribution of the same mean and standard deviation. The upper panel includes the single test using the hydrophobic polyvinylidene fluoride filter; in the lower panel this test is omitted.
Product Type Effects.
Means and 95% confidence intervals by product type are reported in Table V.
Means, Standard Deviations, and Confidence Intervals of BP Ratios by Product Type.a
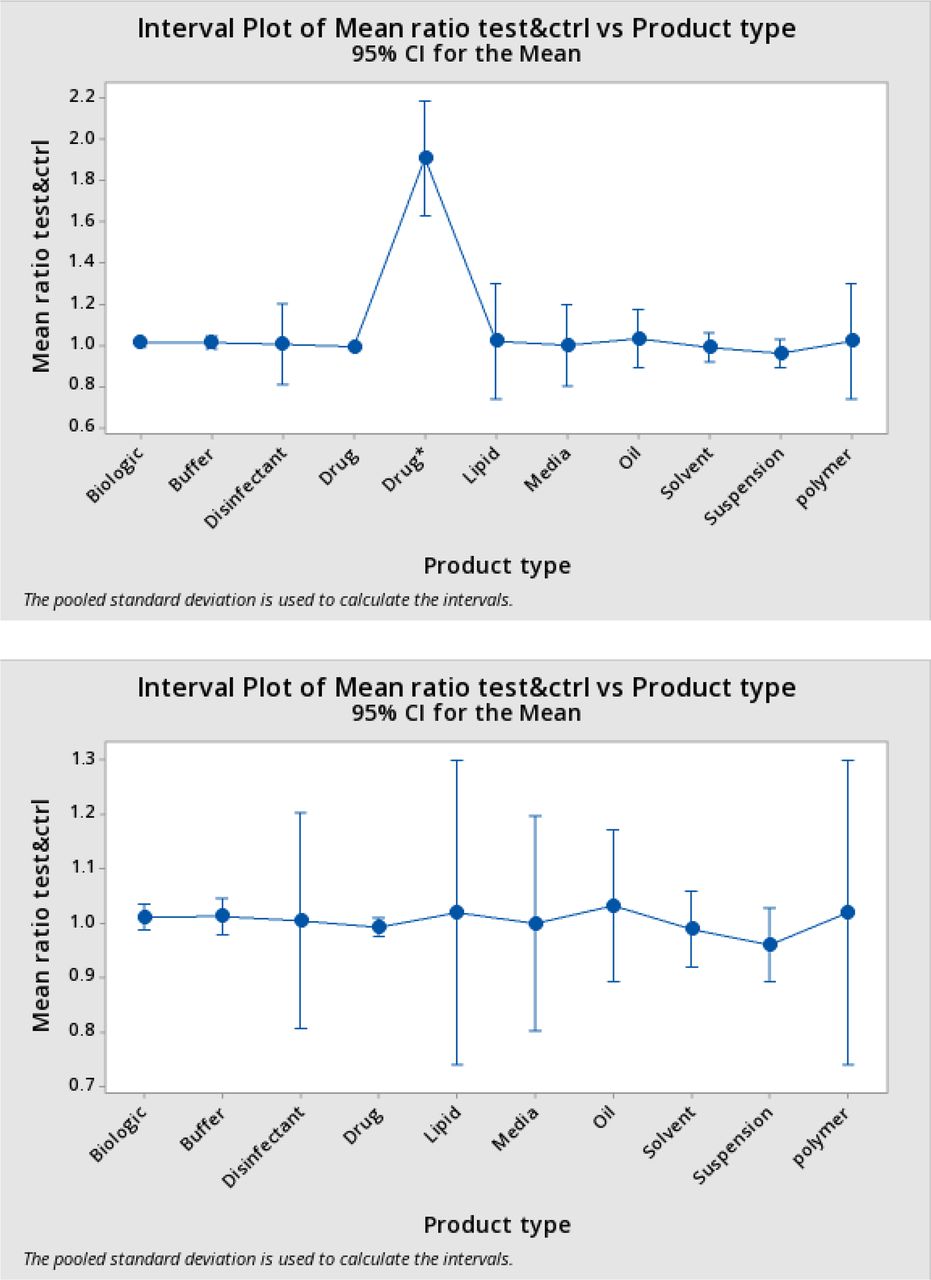
The means of all product types were essentially 1. There was little evidence for systematic variation of the BP ratio by product type. One-way ANOVA yielded a p value of 0.91. Again, the single test for PVDF-hydrophobic (which is a member of the product class “Drug,” but is treated separately in Table V) was excluded here as it had a remarkably disproportionate influence on the ANOVA, in fact yielding p < 0.05 if included.
The data in Table V are shown graphically in Figure 7. The upper panel shows the results with the PVDF-Hydrophobic data point included; the lower panel shows the results excluding the PVDF-Hydrophobic data point.

Mean test ratio by product type with 95% confidence intervals: The means of the average test bubble point ratios for each product type (from Table V) are plotted against the product type, with bars showing the 95% confidence limits of a normal distribution of the same mean and standard deviation. The upper panel includes the single test using the hydrophobic polyvinylidene fluoride filter included; in the lower panel this test is omitted.
It is possible that there could be interactions between membrane type and product type. That is, some membrane types could be more or less subject to BP elevation than other membranes only when filtering a particular product type. However, there were insufficient data to analyze for interactions between membrane type and product type. Table VI shows the matrix of available BCTs by membrane type and product type. There are many combinations of membrane and product type with no data at all, whereas others are overrepresented.
Numbers of Tests by Membrane and Product Typea
Definition of Outliers
Although most of the data fell into a few intervals just above and below 1.0, a few BP ratios were relatively far above 1. In spite of the lack of normality, ratios > the mean + 3.00 standard deviations (“mean + 3sd”) can be considered outliers. This value (mean + 3sd) for the entire data set is 1.43. The numbers of outliers, and the mean, sd, and mean + 3sd for the entire data set, for 0.2 μm filters only, and for 0.45 μm filters only, are shown in Table VII.
Means, Standard Deviations (sd), and Test for Outliers for Average Bubble Point (BP) Ratios (Mean + 3sd)a
The mean and sd for all filters considered as individual values (rather than using the means for each test) were 1.00 and 0.18. For fully independent measurements, the standard deviation of the mean should be related to the standard deviation of the individual measurements by n0.5 (because n = 4 for most tests, this is a factor of 2). Thus, a sd of 0.29 would be predicted for independent data points. The lower sd observed for the individual filter ratios was consistent with the ratios within each test being related.
There was a total of five average BP ratios (0.97% of 518 total) with values > global (all filters) mean + 3sd. There were six (out of 512) sets of test filters with an average BP ratio > mean + 3sd for all test filters (1.16% of 0.2 μm filters), and four (out of 506) 0.45 μm control filter tests (0.79% of 0.45 μm filters) with a BP ratio > mean + 3sd of the control filters.
For normally distributed data (with mean 1.00 and sd 0.14), only 0.13% of the filters would be expected to exhibit a BP ratio > the mean + 3sd. BP ratios > the mean + 3sd for the entire data set can be termed “outliers”, but this does not imply a probability because the data are not normally distributed. Within this data set, probability was better reflected by percentile (i.e., the percent of the data with a BP ratio at or below the value in question, as shown in Table II and plotted in Figure 2). BCT with average ratios > the mean + 3sd make up 0.97% of the data for all filters, with >99% of the data at or below the mean + 3sd.
A more functional definition of an outlier would be the lowest BP ratio that presents a risk of masking. The elevation in BP that could produce masking is addressed following.
Discussion
It is pertinent to discuss the interpretation of the BP ratio, characterize the overall mean BP ratio and the majority of test sets, potential sources of BP ratio variability, characterization of outliers, to identify potential risk factors and assess potential for masking, and consider implication for production BP testing.
Interpretation of the BP Ratio
A decrease in posttest BP versus pretest BP, meaning a BP ratio of <1.00, indicates a further decrease in surface tension or contact angle between the solution and the filter membrane (beyond that encompassed by the empirically determined correction factor). An increase in posttest BP versus pretest BP, meaning a BP ratio of >1.00, may mean an increase in surface tension or contact angle (beyond that encompassed by the empirically determined correction factor) or plugging of pores by bacteria, by product impurities, or by deposition (e.g., by adsorption or aggregation) of product solutes. Increases in BP (a BP ratio >1.00) were evaluated for risk of defect masking.
Absence of Effect on Mean BP Ratio and on the Majority of Tests
The mean of the average corrected BP ratios for the entire data set was 1.002, indicating that on average neither product filtration nor bacterial loading during the BCT had an impact on the corrected posttest BP. The mean for all test filter average BP ratios was 1.005, and the mean for all 0.45 μm filters was 0.996. The distribution of the data is reflected in its standard deviation (sd). The sd of the entire data set (averages of four filters per test) was 0.15, the sd for all 0.45 μm filters was 0.21, and the sd for all 0.2 μm filters was 0.14 (Table I).
The data were not normally distributed. Neither omission of the outliers nor use of the relative difference in BP (instead of the ratio) impacted the results nor produced a normally distributed data set. This may be because of the heterogeneity of the data—the data set included 16 different membrane types and a wide variety of products and buffers. Factors affecting variability of the data are discussed under that heading following.
Regardless of the cause of the variability, the aggregate data were not characterized by elevation of the corrected posttest BP. The mean of the average BP ratios for all filters was 1.00, and the sd was 0.15 (coefficient of variation of 15%). Over 99% of the average BP ratios were within 3 sd of the mean (≤1.43).
Sources of Variability in the BP Ratios
The purpose of this study was to determine whether the filtration process could cause changes in the BP sufficient to “mask” a defect in a filter. Our data set included filters exposed to a variety of products, buffers, and intermediates that provided a representative cross section of filter applications. We expect that this data set should capture variation in the BP ratio that is owing to differences in the material filtered and in the filtration process.
The data included at least two additional sources of variation not necessarily related to the filtration process. The information needed to control for these sources of variation was not included in the scope of the study (i.e., the information was not requested and therefore not abstracted from the original BCT records) and is therefore not available.
First, a variety of filter membranes were represented. For any given process fluid, the effect of the filtration process may be different for different membranes. The membrane type was known for all test filters in the study, but the identity of the 0.45 μm control filter (with respect to the membrane type) was not included in the data that were collected. Because the data set as a whole already included such a wide variety of membrane types, the lack of information on the control filter membranes does not change the interpretation of the data or the conclusions drawn.
When the test filter data were sorted by membrane type, a mean and sd could be calculated for each, but the numbers of observations were much smaller than for the entire data set and the sds were greater. The smaller numbers of observations and greater sds made meaningful comparisons among filter types difficult (see Table III). For this reason, we elected to consider only the aggregate data.
A second source of variation was the fluid in which the posttest BP was conducted. For 223 of the 531 separate BCT records, the posttest BP was conducted using the same fluid as the pretest BP. For the remaining 308 BCTs, the posttest BP used the fluid in which the BCT was performed (i.e., different from the fluid for the pretest BP). In all but three of the tests using the challenge fluid, a correction factor had been determined independently for the product being studied (“product-wet BP”). If such a factor was available, it was used to adjust the posttest BP as described in the Methods section. However, some BCTs may have been performed in a surrogate rather than in an actual product, and this information (whether or not a surrogate was used) was not captured in the data set. In three cases where a posttest BP was conducted in the challenge fluid, no correction factor was available. However, because most correction factors were close to 1, it was unlikely that discrepancies in the correction factor had a significant impact on the overall results.
Characterization of Outliers
Out of 518 average BP ratio data points, there were five outliers with a BP ratio >1.43 (mean + 3 sd for all average BP ratios). The question arises whether the outliers were a result of random variation of the BP ratio or rather constitute a separate population (i.e., that some specific characteristic of the product or the BCT sets some or all of the outliers apart from the filters with ratios close to 1.00).
It was tempting to attribute to the outliers some specific cause (i.e., other than random variation) that was not operative for the remainder of the data. Because the data were not normally distributed, the distance of a given data point from the mean was not compelling evidence for (a) separate event(s) to explain the outliers. Some or all outliers may represent some phenomenon (such as plugging) that is present in all cases but acting to a lesser extent (i.e., entirely owing to random variation).
This is not unexpected for a data set derived from bacterial retention testing, where a higher than normal extent of plugging and other effects on filter membranes can be expected because of the bacterial load on the membrane. Regardless, whatever effect was producing the BP elevation in the outlying tests must be operative to a much larger extent in the outliers.
Some of the outliers appeared to have specific causes beyond random variation. In at least three cases, there was some question about the applicability of the correction factor, which was much <1.00, and in at least one other case, filter plugging sufficient to produce flow decay was noted. But it is also likely that all filters in the data set were plugged to varying degrees because of the nature of the BCT.
The five outliers beyond the mean + 3 sd determined using the mean and sd for all filters, comprising 24 individual filter BP ratios, are examined in detail in Table VIII. The last column of Table VIII lists any test characteristics that could be identified that might account for an elevated BP ratio.
Outliers Using Mean and Standard Deviation for All Filtersa
Table VIII also shows that it was common for multiple filters from a given BCT to be affected, which also supports a test-specific or product-specific effect. In this respect, the increase in BP ratio appears to be fluid-specific, with two or more test and control disks for a single BCT exhibiting an elevated BP ratio. Filters with PVDF membrane were disproportionately represented in Table VIII. Tests of PVDF membranes make up all 20 of the test filter ratios among the outliers, whereas tests of PVDF filters constitute 774 of the 1571 test filter ratios overall or 49.3%.
In at least three cases (Test sets 43, 44, and 508; comprising 9 × 0.2 μm ratios and 3 × 0.45 μm ratios), the correction factor was unusually low. The elevated ratios in these tests may be owing to a correction factor that does not apply to the conditions of the test (see following). This accounts for 1 of the 5 outlier sets and 4 of the 20 individual filter outliers.
In at least one additional case (Test set 472; comprising 3 × 0.2 μm ratios and 1 × 0.45 μm ratios), plugging of the filter was documented during the test (potential filter plugging was also associated with Tests 43 and 44). This accounts for an additional 1 of the 5 outlier sets and an additional 4 of the 20 outlier filters.
Thus, a total of two of the five outlier sets can be attributed to specific anomalies noted during the tests, either surfactant properties resulting in a correction factor of uncertain validity, or filter plugging, or both.
In one set of tests (43 and 44) a surfactant that depressed the BP (leading to a correction factor much lower than 1.00) was known to have been present, and a low correction factor (product-wet BP greatly decreased relative to water-wet BP) was also exhibited in Test set 508 (as well as sets 103 and 491, which also exhibited less severely elevated BP ratios). Correction factors (product-wet BP ratios) for products with surfactants can be difficult to determine effectively because the amount of surfactant at the membrane surface can vary with conditions (amount of fluid filtered, temperature, and possibly other product residues or contaminants removed by the filter including bacteria). This case makes up one of the outlier sets (four outlier filters).
Two of the 5 outlier sets (40%) involved biological products, whereas filters wet with biologic products comprise only 136 out of 512 (27%) BP ratios. This is consistent with an increased likelihood of plugging the filter when filtering biological products (8).
Risk Factors for Elevated BP Ratio
Identification of specific risk factors common to the set of outliers was hampered by incomplete information about the process fluids, because many details about the fluids were proprietary and not collected as part of the data set. The following can be identified as risk factors from the previous discussion:
Biologicals were overrepresented among the outliers, possibly because of a propensity to foul membranes.
Filter plugging appeared to be a risk factor—the outliers contained at least one fluid where filter plugging (flow decay) was documented during the test.
A BP correction factor significantly <1 (i.e., a product-wet BP significantly less than the water-wet BP, as determined during filter validation studies).
Uncertainty or variability in the product-wet BP, as determined during filter validation studies).
Presence of a surfactant. Although the presence of a surfactant was not specifically identified in outlier product descriptions, surfactants frequently result in a low BP correction factor and in variability of correction factors depending on throughput.
Note that not all risk factors for elevated BP ratio present a risk of masking. The risk factors for elevated BP ratio that are related to uncertainty or variability of the correction factor were not related to filter plugging or physical masking of filter flaws, but nevertheless must be corrected to obtain a meaningful integrity test result.
Assessing the Potential for Masking
For the purposes of this discussion, “masking” is defined as a false passing BP result (a passing integrity test result obtained on a filter containing an otherwise detectable defect), resulting from elevation of the BP owing to filter plugging by product or bacteria.
The BP increase sufficient to raise the BP of a 0.45 μm filter to the minimum BP of the corresponding 0.2 μm filter can be considered the minimum effect that could mask a defect (i.e., “masking” of 0.45 μm pores to make a 0.45 μm filter produce an integrity test result of a 0.2 μm filter). A defect, by definition, should be larger than the filter pores themselves. As the filter defects occurring during filter manufacture and use and then detected by the BP integrity test are generally much larger than the pores of a 0.45 μm filter, this should be a sensitive criterion for masking.
The BPs of 0.45 μm and 0.2 μm filters vary among membrane types and manufacturers. We used the minimum BP specification of each membrane to control for this variation.
For each membrane type, the minimum BP specification of a 0.45 μm filter can be multiplied by the BP ratio (posttest/pretest) observed during BCTs to determine the likelihood that it could be mistaken for a 0.2 μm filter. Of the sixteen (16) membrane types identified in the BCT data, a minimum BP specification for both the 0.2 μm filter membrane and a corresponding 0.45 μm membrane (i.e., designated by the manufacturer as the same membrane type), was available for 10 of the 11 hydrophilic 0.2 μm membranes. No 0.45 μm filters corresponding to the 5 × 0.2 μm hydrophobic filters and one of the 0.2 μm filters identified in this study were commercially available.
We calculated the ratio of the minimum BP of a 0.2 μm filter to the minimum BP of the corresponding 0.45 μm filter and determined where it falls in the BCT BP ratio distribution. The result of this analysis is shown in Table IX. Only 10 of the 16 membrane types for which BCT data are included are included in Table IX, because no corresponding 0.45 μm membrane could be identified for PES4 or for the five hydrophobic 0.2 μm membranes included in the data set.
Percentile Probability for 0.45 μm Minimum Bubble Point (BP) Increase to the 0.2 μm Minimum BPa
Among the medium types for which both a 0.45 μm and 0.2 μm minimum BP specification were available, the ratio of the 0.2 μm minimum BP specification to the 0.45 μm minimum BP specification varied from 1.33 to 5.8, and fell between 2.3 and 33.5 sds away from the mean BP ratio observed for all filters in the BCT data. This value is shown in the “# SD” column of Table IX. The percent of the data set falling above this ratio (i.e., the likelihood that any ratio in the data set is above this ratio) is shown in the last column of Table IX. Using the lowest ratio of a 0.2 μm minimum BP to the corresponding 0.45 minimum BP (1.33), 98.4% of the BCT data are below this ratio (from Table II).
A BP ratio ≥1.33 meets the criterion of raising the BP of a 0.45 μm filter to the minimum BP of a 0.2 μm filter, for the membrane type with the smallest difference between the 0.45 and 0.2 μm minimum BPs.
Under the conditions of a BCT, only 8 out of 518 (about 1.5%) of the BP ratios (all filters) were high enough to raise the BP of a 0.45 μm filter to the minimum BP of a 0.2 μm filter, even for the membrane type with the smallest BP difference between the 0.45 and 0.2 μm minimum BPs. This means that for the great majority of filtration processes, it is unlikely that a post-use BP in a production environment could be elevated by an amount that would make a 0.45 μm filter appear to be a 0.2 μm filter, which may be considered a model for masking of defects.
Implications for Production Integrity Testing
Even under the extreme conditions represented by bacterial retention testing, both cases of elevation of the posttest BP beyond 3 sd from the mean, and cases of elevation of the posttest BP to a point where a 0.45 μm filter could meet the minimum BP of a 0.2 μm filter (i.e., “masking” of the 0.45 μm pores), were rare events. By this criterion, only around 0%–1.5% of the BP ratios (0–8 test sets) presented a risk of masking (depending on the 0.45 μm and 0.2 μm minimum BP specifications being considered, per Table IX).
Each pharmaceutical manufacturer typically conducts a BCT during validation of each sterilizing filtration. Review of the pre- and posttest BP data from the validation testing will provide a BP ratio characteristic of the product, which can be used to assess the risk of masking for the filter type in use by comparing the observed average BP ratio to the cumulative probability (percentile) values in Table II, or by using a comparison to a 0.45 μm/0.2 μm BP ratio as shown in Table IX. Thus, conditions leading to potential masking can be identified from BP data collected during routine filter validation testing.
It is important to consider the nature of the data set compared to production filter use. In a BCT, the filtration conditions are exaggerated—typically the filtration pressure or flow rate is maintained continuously1 at or above the maximum permitted in production, for a duration just greater than the maximum permitted in production. In addition, extremely large numbers of bacteria have impinged on the filter, up to ∼5 cfu/μm2, which does not cause formation of a monolayer on the surface, but rather affects the pores on the surface and within the first few micrometers of the membrane depth (5).
Therefore, the distribution of BP ratios (corrected post-use BP to pre-use BP) for a production process is expected to be very different from the distribution observed in this study. If data including both pre- and post-BP tests conducted on the same filter are available in production operations, compilation of that data in the same manner as shown in Table IX would provide a much better determination of the likelihood of plugging than this data set collected from BCT BPs. If the BP ratio observed in a BCT is elevated, a BP ratio observed in production may still indicate that there is no risk of masking.
These two sets of data, the BP ratio observed during the BCT conducted on each product as a part of routine filter validation, and the BP ratio observed under actual production conditions, can be used to assess the risk of potential masking of filter defects during the production filtration. We propose that, based on the difference between the minimum BP of a 0.45 μm membrane and that of a 0.2 μm membrane, BP ratios <1.33 do not pose a risk of masking filter defects.
Risk Factors for Masking/Interference with the Post-Use Integrity Test
Risk factors identified in this study include filter plugging and a correction factor significantly <1.00 (coinciding with surfactant properties of the solution—including some stabilizers such as polysorbates). Both biological products and PVDF membranes were disproportionately represented among the outliers.
Verifying the suitability of a BP correction factor (“product-wet BP”) under actual production conditions after it has been determined at laboratory scale can mitigate or eliminate the impact of an incorrect correction factor and is recommended. Proper sizing of the filter (or prefiltration) to prevent premature plugging can be expected to mitigate or eliminate the risk of masking because of filter plugging.
Use of the Cumulative Distribution to Assess the Observed BCT Corrected BP Ratios
This article includes a large data set (see Appendix Table S-I) by which a filter user can benchmark the corrected average BP ratio experimentally determined during any given BCT. By placing the experimentally determined average-corrected BP ratio on the cumulative distribution curve shown in Figure 2 (or using the tabular equivalent in Table II), the filter user can obtain a percentile ranking, or fraction of the data falling below the observed corrected BP ratio, which can be used to assess the risk of potential masking.
The filter user can also compare their observed BP ratio to the ratio of the minimum specifications of 0.2 and 0.45 μm membranes as shown in Table IX, which also gives the percentile ranking of various values of the average-corrected BP ratio.
Based on the ratios of 0.45 and 0.2 μm BPs shown in Table IX and the distribution of BP ratios, we propose that an average-corrected BP of <1.33 (98.4 to 98.5 percentile in Table II, Table IX, and Figure 2), presents little risk of masking.
Conclusions
The mean BP ratio during BCT was 1, indicating that overall elevation of the BP after filtration did not occur during BCTs. The distribution of the data was narrow, and cases of elevated BPs were not common. Over 98% of all filters exhibited a BP ratio <1.33, and a BP ratio above this value may be regarded as an indicator of potential masking.
In some cases where the BP ratio was elevated significantly (two of the five outliers >1.43), the increase could be attributed to filter plugging, an inappropriate correction factor, or both. A filtration process that proceeds to the point of significant flow decay should be considered a risk for BP elevation. Process fluids with surfactant properties may also present a risk of BP elevation, and both biological products and filtrations with PVDF membranes appear to be overrepresented among the BCTs exhibiting BP elevation.
The conditions during a BCT are extreme, and a severe worst case for production conditions. A lower frequency of BP elevation in production operations is expected. Therefore, if elevation of the BP is observed during the BCT, it would be premature to conclude that there is a masking risk until the BP ratio determined during the BCT on a laboratory scale can be confirmed under production conditions, using prefiltration and postfiltration tests conducted on the same filter.
We conclude that BP elevation with potential for masking a filter defect is very rare, even under the conditions of partial filter plugging that are present during the BCT. The potential for masking can be assessed using the BP data collected during routine filter validation testing. If the BP ratio obtained during lab scale validation testing is elevated, a potential for masking a defect may exist. If little or no elevation of the BP is observed during BCT validation, there is little risk of masking.
We propose an average BP ratio of ≥1.33 (1.33 being the lowest ratio between a 0.2 and 0.45 μm minimum BP) as an “elevated” BP ratio. Where BP ratios during the BCT exceed this value, the BP ratio and the absence of filter plugging should be confirmed under production conditions. Alternatively, the cumulative probability data in Table II can be used to rank the filter user’s process against the large data set represented by this study. If the production BPs or observed filter plugging confirm a potential for masking, mitigation such as implementation of PUPSIT is indicated. However, if BP ratios during the BCT are <1.33, we propose that there is little risk of masking of defects during production.
Conflict of Interest Declaration
The authors declare that they have no competing interests.
Acknowledgments
The authors formed a multicompany consortium comprising 50+ subject matter experts (SMEs) from 25 biopharmaceutical manufacturing companies and filter suppliers. The experts are experienced in sterile filtration and the authors drew upon their collective experiences, current company practices, consultations with stakeholders and colleagues, and a review of current regulatory guidelines.
Appendix
Appendix: Supplementary Data⇓
Complete Data Seta
Footnotes
↵1 Filter validation can be performed using intermittent flow. In that case, the pressure or flow rate are maintained at above production maximum for the duration of flow.
- © PDA, Inc. 2020


