
Abstract
The pharmaceutical industry is currently being confronted with new and complex challenges regarding the aseptic filling of parenterals, especially monoclonal antibodies, particularly for fill volumes <200 µL, which have become increasingly important with the increasing and continued development of intravitreal drugs and highly concentrated formulations. Not only does low-volume filling pose challenges to aseptic manufacturing, but the development of suitable in-process control to ensure reliable and robust filling processes for low-volume conditions has also been difficult. In particular, fill volumes <200 µL exceed limits of accuracy and robustness for the well-established method of gravimetric fill-volume control. Therefore, the present study aimed to evaluate and test novel sensors, which may allow the accurate and precise 100% contact-free measurement of drug-product formulations, with respect to filling volumes. These sensors were designed to be less influenced by inevitable noise factors, such as unidirectional airflow and vibrations. We designed the study using five different sensor concepts, to screen and identify suitable alternatives to gravimetric fill-volume control. The examined sensor concepts were based on airflow, capacitive pressure, light obscuration. and capacitive measurements. Our results demonstrated that all of the tested sensor types worked in the desired low-volume range of 10–150 µL and showed remarkable results, in terms of accuracy and precision, when compared with a high-precision gravimetric balance. A sensor based on capacitance measurement was identified as the most promising candidate for future sensor implementation into an aseptic filling line. This sensor design proved to be superior in terms of both sensitivity and precision compared with the other tested sensors. We concluded that this technology may allow the pharmaceutical industry to overcome existing challenges with respect to the reliable measurement of aseptic fill volumes <200 µL. This technology has the potential to fundamentally change how the pharmaceutical industry verifies fill volumes by facilitating 100% in-process control, even at high machine speeds.
1. Introduction
The low-volume filling of parenterals, including monoclonal antibody formulations such as Lucentis and Eylea, is of increasing future importance within the pharmaceutical industry (1, 2). Because of the high demand for intravitreal ocular treatments for diseases including age-related macular degeneration and diabetic macular edema, the development of suitable aseptic filling processes is of extraordinary importance (3). The typical administration volumes used for intravitreal applications range between 50 and 100 µL (4), and the typical fill volume used for intravitreal drug products is 150–250 µL because existing filling systems currently struggle to deliver lower fill volumes with acceptable accuracy and precision (5). The therapist who delivers the treatment is expected to downdose the higher fill volume to the recommended therapeutic dose.
A complete filling line consists of multiple compartments, which each serve a distinct purpose within the entire aseptic manufacturing process (i.e., washing machine, heat tunnel, and crimping station) (6). In addition to the necessity of a suitable filling system that is capable of handling fill volumes <200 µL, the specification and assurance of the in-process fill-volume control must also be assessed (7). Various methods are currently available that have been designed specifically for liquid handling, and these methods differ in terms of accuracy, speed, hygiene, and costs.
1.1. Mass Flow Measurement
Mass flow measurement is based on the Coriolis force principle (8). The liquid is conveyed forward, through two vibrating pipes, and the Coriolis force acts on the pair of pipes, generating a phase shift in the vibrations. This phase shift allows the mass of the liquid passing through the pipes to be calculated, facilitating fill-volume determination. Coriolis meters are very accurate (9); however, because the flow meter must be installed before the point of fill and is, therefore, susceptible to the variabilities that occur after the control point established by the flow meter, the use of this method has not been broadly established in the industry. In addition, the effort required to maintain and clean a flow sensor is much higher than that for other methods. Because the flow meter comes into direct contact with the drug product, it must be subjected to a validated cleaning and sterilization process. During maintenance, the flow meter must be fully removed from the filling line and then reintegrated when maintenance has been completed.
1.2. Gravimetric Measurement
The current state-of-the-art method is the gravimetric measurement, which represents the most precise method available and is suitable for virtually any liquid. Here, the fill volume is controlled by a gravimetric balance, typically a load cell (8). During aseptic vial filling, the vials are weighed when empty, and the tare weight is measured. Then the vial is transported beneath a filling needle, filled, and transported to a second balance, where the gross weight is measured. To determine the fill volume, the net weight is multiplied by the density of the drug product formulation. This fill-volume analysis process represents a well-established and common practice in the pharmaceutical industry that is applied to the aseptic filling of volumes >200 µL. Unfortunately, gravimetric in-process control (IPC) poses multiple new challenges when applied to fill volumes <200 µL, which are common for highly concentrated drug product formulations and formulations designed for intravitreal administrations.
Challenge 1: Unidirectional Airflow
In an aseptic fill-finish environment, the drug product formulations are usually filled in isolators to protect both the drug product and humans from direct contact and potential contamination. Isolators are supplied with air quality regulators, according to ISO 5 specifications, that facilitate the uncompromised, continuous isolation of the isolator interior from the external environment. To minimize airborne particles in the supplied air, high efficiency particulate air filters are installed and the particle load in the isolator is minimized by the use of unidirectional airflow (UDAF) (0.45 m/s ± 20%) (10). The UDAF and its variability directly influence the gravimetric measurement of the fill volume by creating a vertical variable force vector on the load cell.
Challenge 2: Influences by Vibrations
As filling equipment improved and container sizes increased, the production rate of the systems also increased. Some large filling lines that are currently in operation consist of different manufacturing modules with a length of several meters. As the sizes of the filling lines and the numbers of moving parts (i.e., robotic arms and roller bands) increase, the frequency of influencing factors that may affect the process, such as vibrations, also increases. Vibration can be a major problem during aseptic filling; therefore, isolators are bolted to the floor to secure them more permanently. To minimize the influence of vibration on gravimetric IPCs to the greatest extent possible, the load cells are decoupled from the machine as strictly as possible (11). However, filling lines are known to transmit vibrations to gravimetric IPC systems. Some suppliers of IPC systems, such as Wipotec, have developed and offered a system that attempts to compensate for vibrations during the operation of the filling line. Active vibration compensation (AVC) technology uses intelligent algorithms to ensure precise gravimetric measurements. AVC technology focuses on vibrations lower than 10 Hz, which are the primary vibrations that affect the measurement signal. Vibration frequencies above 10 Hz are compensated by a low-pass filter (12). When attempting fill volumes <200 µL, the vibrations from the filling line, together with the laminar airflow, play pivotal roles during gravimetric IPC processes. These effects have reduced impacts for fill volumes ≥1 mL because the signal-to-noise ratio is large enough for these effects to be negligible. However, for fill volumes ≤200 µL, these influences cannot be neglected.
To guarantee label claims regarding volumes and efficacy, pharmaceutical manufacturers must increase vial fill volumes to ensure that the recommended dose can be administered to the patient and the loss of drug product that occurs during administration (e.g., hold-up volume and dead volume in the syringe) is properly compensated. Additionally, variabilities that may occur during the filling process must also be accounted for. Because of the existence of various influencing factors, including UDAF and vibrations, that can directly influence gravimetric IPC systems during aseptic filling processes, the delivery of a robust process for the IPC of fill volumes <200 µL remains a challenge for the pharmaceutical industry. Deviations caused by UDAF and vibrations often exceed the acceptance criteria for fill-volume accuracy, which requires the submission of appropriate justifications to health and regulatory authorities. USP General Chapter <1151> Pharmaceutical Dosage Forms provides excess volume recommendations for mobile and viscous liquids for a wide range of fill volumes, noting that the excess volumes recommended are usually sufficient to permit the withdrawal and administration of the labeled drug product volumes (13).
This study aimed to assess different sensor technologies for the continuous nongravimetric determination of fill volumes for application with a very accurate, low-volume filling system (linear peristaltic pump) (14). The target volume range was set to 15–100 µL, which reflects a typical range for an average single intravitreal injection dose (1, 2).
2. Materials and Methods
For each sensor type, a prototype installation was constructed and added to an existing peristaltic dispensing system. The performances of the different sensors were investigated individually. Each sensor signal was analog/digital (A/D)-converted and stored. An XPE105 balance (Mettler Toledo) combined with gravimetric software (GraviDrop, BioFluidix GmbH, Freiburg, Germany) was used during all dispensing experiments to facilitate comparisons between the sensor signals and the gravimetric reference measurements. All dispensing experiments were performed using distilled water as a model solution. Distilled water was found to reflect most viscosities for therapeutic monoclonal antibody formulations designed for intravenous use at protein concentrations <100 mg/mL. The formulation viscosity is dependent on the protein concentration and was found to be <3 cP for protein concentration <100 mg/mL (15). For all data analyses, the mass density of the distilled water was assumed to be  ; thus, 1 µlH20 = 1 mg. The gravimetric measurement results were, thus, directly converted from milligrams into microliters.
2.1. Experimental Setup
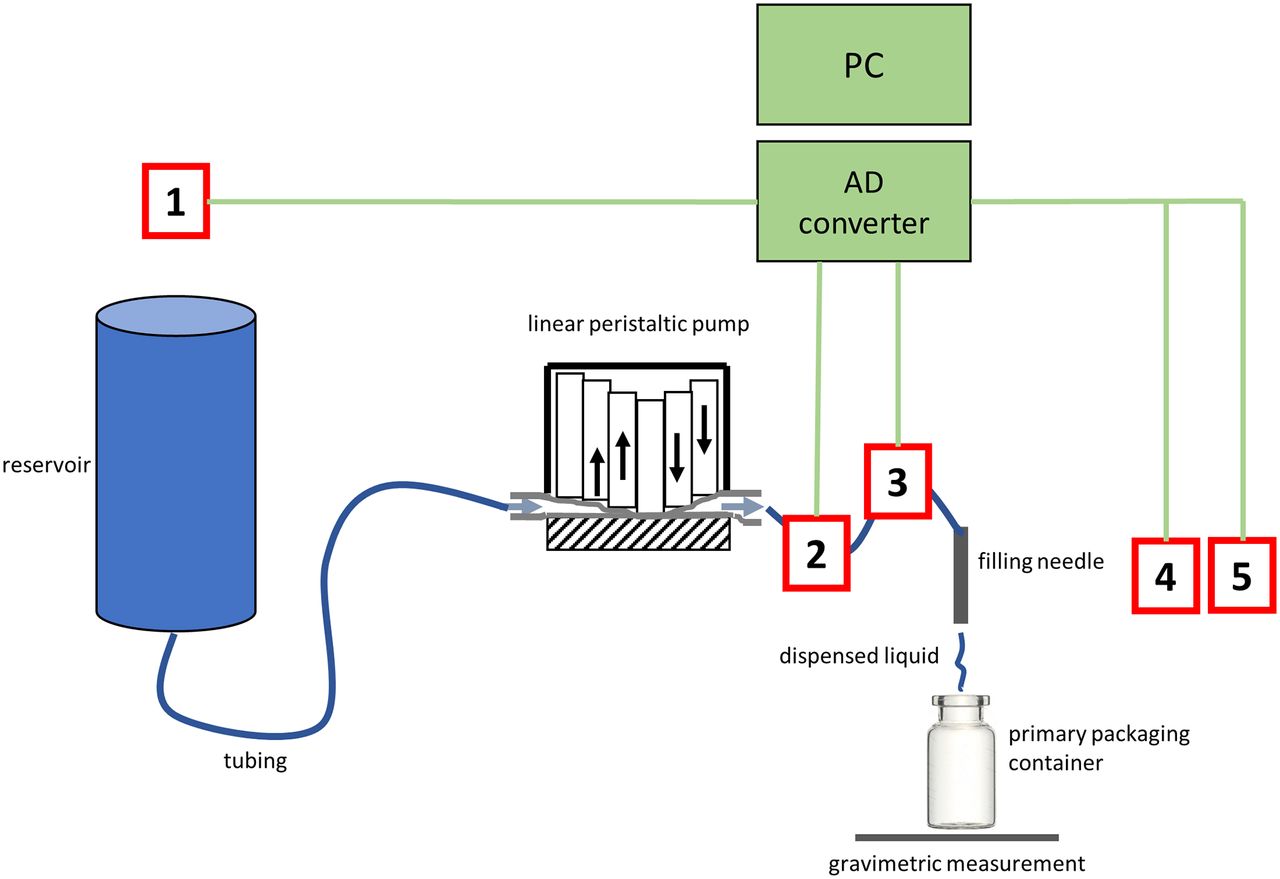
The experimental setup used for this study and the location of each investigated sensor is described in Figure 1.

Schematic overview of the experimental setup. The system electronics are displayed in green, the tested sensors are shown in red, and the filling pathway is shown in blue. Five different sensors were tested: (1) airflow into the reservoir, (2) capacitive pressure sensor (differential and relative), (3) MEMS sensor (differential and relative), (4) optical sensor, and (5) capacitive sensor. The positions of the sensors indicate their positions relative to the filling system. The airflow sensor (1) was at the reservoir, outside of the filling line. The pressure sensors (2 and 3) were in-line with the filling system, connected to the tubing. The optical and capacitive sensors (4 and 5) were outside of the filling system, at the filling needle orifice.
2.2. Sensor Principles
The working principle of each sensor is described below.
2.2.1. Airflow Sensor:
The airflow sensor uses thermal mass flow to measure air displaced because of to the venting of the reservoir during the dispensing process. A central heating element warms the adjacent air, which is monitored by two neighboring thermocouples (Table I, Airflow, a). As shown in Table I, Airflow b, the gas flow shifts the thermal distribution in the direction of the airflow, resulting in a decreasing temperature on the upwind side and an increasing temperature on the downwind side. This change in temperature difference can be measured and transformed into an electrical signal, which corresponds to the airflow.
The sensor housing contains an inlet, a dampener, the sensor itself, and an outlet to the reservoir. To assess the dispensing volume, the airflow sensor is connected to the reservoir. Each dispensing event causes the fluid level to drop within the reservoir, causing air to flow into the reservoir. The volume of the air that flows into the reservoir is identical to the dispensed fluidic volume. During postprocessing, the integration of the airflow over time can be used to retrieve the air volume. Air flows through the inlet, the dampener, and the thermal mass flow sensor and flows out through the outlet into the reservoir (and vice versa). The dampener is used to reduce the influence of turbulence. The electronics convert the measured temperatures and the temperature difference into electrical potential, which is recorded by the A/D converter board for analyses.
Matrix Overview of All Investigated Sensorsa
2.2.2. Capacitive Pressure Sensor:
The sensor principle of the BioFluidix’ capacitive pressure sensor makes use of a specifically designed silicone tube, which is placed inside of two semicircular metal plates, forming a capacitor (see Table I, capacitive pressure, a). This sensor is installed between the dispensing system and the filling needle, as a part of the fluid path. Increases in pressure within the silicone tube cause the tube to expand, resulting in an increase in the liquid within the expanded volume (b). This increase in liquid, which represents an increase in permittivity, changes the capacitance of the measuring cell, which subsequently causes a pressure increase. Specifically designed electronics allow for the highly sensitive detection of small changes in capacitance and can transfer these capacitance values into readable electrical voltage levels (16, 17).
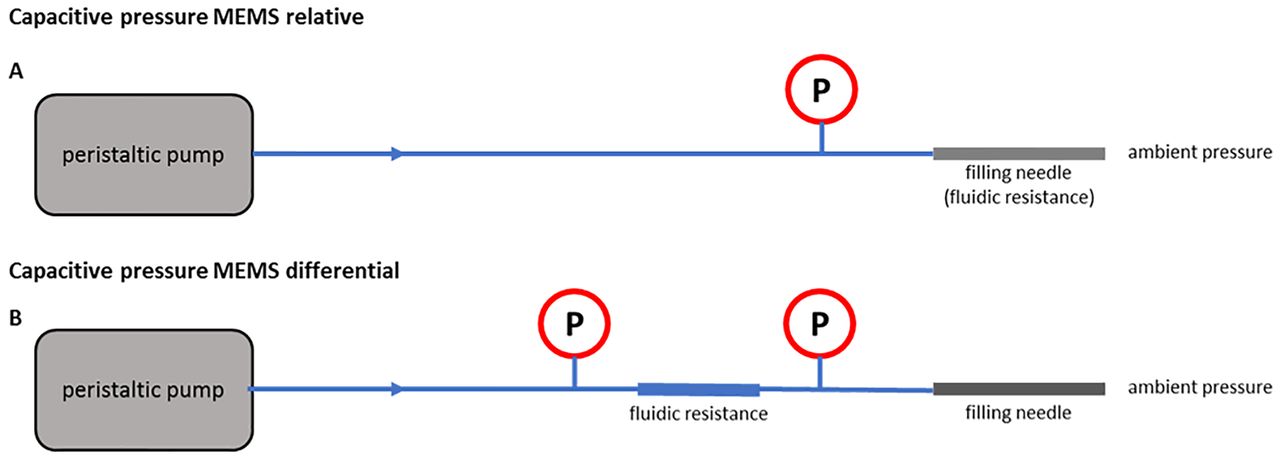
To measure the dispensed volume, two different measurement setups can be applied (Figure 2). The first setup takes advantage of the pressure increase relative to the ambient pressure, using a single pressure sensor that is placed between the peristaltic pump and the dispensing needle (Figure 2A). In this setup, the dispensing needle itself provides the fluidic resistance (rneedle ≪ rtubing), which causes the pressure to increase during filling. This pressure increase is proportional to the volumetric flow through the dispensing needle, according to the Hagen-Poiseuille law, which describes the pressure increase that occurs when a Newtonian fluid flows through a cylinder (premise: laminar flow). To select a suitable pressure sensor, the expected pressure increase over the dispensing needle can be estimated using the Hagen-Poiseuille formula. The inner diameter, r, of the dispensing needle was measured as 300 µm. The length, L, of the needle was 145 mm. The average flow rate of the pump was roughly 50 µl per 200 ms; thus the flow value (Q) = 250 µl/s. The dynamic viscosity, η, of water is 1.0 mPa·s. According to the Hagen-Poiseuille equation, the expected pressure increase can be calculated as:
 (1)
(1)

Experimental Setup for the capacitive pressure sensor. Schematic drawing showing the setup installation of one and two capacitive pressure sensors, measuring relative (A) and differential (B) pressure increases over a fluidic resistance. The relative system utilizes the filling needle to provide fluidic resistance and compares the increase in pressure in the fluid line with the ambient pressure, and the pressure change can be used to determine the fluidic volume based on the Hagen-Poiseuille formula. The differential system uses the differential pressures measured by two different sensors placed on either side of an additional fluidic resistance element.
Because the peristaltic pump used for this experiment does not provide a perfect, constant, fluidic flow, pressure peaks beyond and below this estimated pressure value were also considered for the selection of a suitable pressure sensor type and pressure range. The pressure signal was analyzed by a base level calculation of the sensor signal, followed by an integration of the measurement sensor signal after base level subtraction.
The second setup (Figure 2B) relies on the differential pressure measured between two pressure sensors, one before and one after an element that applies additional fluidic resistance (a stainless-steel pipe) between the peristaltic pump and the dispensing needle. The additional fluidic resistance was chosen to be comparable to the fluidic resistance of the dispensing needle. The differential pressure between the two sensors was derived by subtracting the pressure values and is proportional to the fluidic flow through the added fluidic resistance element. The dispensed volume can be derived from an integration of the flow over time, which is comparable to the relative pressure setup.
2.2.3. MEMS Sensor:
The MPXV pressure sensors from Freescale Semiconductor use the piezoresistive effect and are made of a monolithic silicon material. The sensor die is protected by a synthetic rubber coat to avoid condensation. The sensors are designed for a wide range of applications. The output signal is an analog voltage, which is proportional to the applied pressure, in the range of 0 to 5 V. Table I, MEMS shows a sectional view of the MPXV5050 sensor with a pressure range from 0 to 500 mbar (18). Similar to the capacitive pressure sensor, two possible setups can be used to measure either the relative pressure (Figure 3A) over the dispensing needle or the differential pressure (Figure 3B) on either end of an additional fluidic resistance element. In contrast with the capacitive pressure sensor, the pressure sensors cannot be placed inline but, instead, require the installation of a T-junction within the fluidic path. The introduction of a T-junction causes a minimal volume fraction of the dispensed volume to deviate from the direct path to the filling needle and instead flow into the T-junction, compressing a tiny air bubble located in front of the pressure sensor. The deformation energy in the compressed air bubble is released back into the liquid at the end of the fill, resulting in a completely relaxed system.
Experimental Setup for the MEMS Sensor. Schematic drawing of the relative (A) and differential (B) pressure setups using MEMS pressure sensors. The relative system utilizes the filling needle to provide fluidic resistance and compares the increase in pressure in the fluid line with the ambient pressure, and the pressure change can be used to determine the fluidic volume based on the Hagen-Poiseuille formula. The differential system uses the differential pressures measured by two different sensors placed on either side of an additional fluidic resistance element.
The relative pressure setup (Figure 3A) takes advantage of the pressure increase over the dispensing needle relative to the ambient pressure, caused by the fluidic flow through the needle. The differential pressure setup (Figure 3B) measures the pressure before and after an additional fluidic resistance element. As described in detail for the capacitive pressure sensor, the resulting pressure difference is directly related to fluidic flow, according to the Hagen-Poiseuille law. (eq 1).
2.2.4. Optical Sensor:
The optical sensor principle tested in this study uses an infrared light-emitting diode (LED) and an infrared-sensitive optical receiver (Table I, optical sensor) (19). The photons sent by the LED are detected by the receiver. Droplets or jets that pass between the LED and the receiver typically reduce the grade of optical transmission; thus, the light intensity on the receiver side is reduced by absorption, reflection, and dispersion effects, and the light intensity measured at the receiver can then be transformed into an electrical signal. Absorption occurs when a fluid, such as a semitransparent ink, absorbs or partially absorbs the light radiation that passes through the medium, increasing its temperature but reducing transmission. The absorption effects on a dark ink are stronger than those on distilled water. Reflection occurs on surfaces with different refraction indices. The reflected component of the light will typically be redirected and will not reach the receiver, resulting in reduced transmission. Dispersion scatters the light, following the laws of optical lenses. All three mechanisms reduce the intensity of light that reaches the receiver (20). For transparent fluids, such as water, the primary light intensity reduction mechanisms occur because of reflection and dispersion on the side of the fluid column. A wide fluid column with a large cross section results in a relatively large area of reflected and dispersed light, which results in a stronger reduction in light transmission compared with a thinner fluid column with a smaller cross section. After calibration against orthogonal methods (e.g., weighing), the intensity of the received light and the resulting sensor signal can be correlated with the dispensed volume, especially when integrated over time. To use this sensor in an industrial environment, stable background illumination levels are required.
2.2.5. Capacitive Sensor:
The capacitive sensor makes use of a single capacitor, with the same design as described earlier for the capacitive pressure sensors, as shown in Table I (17). However, this sensor does not measure pressure, and no silicone tube is placed within the capacitor plates. Instead, the fluid column moves through the capacitor, causing changes in capacitance by altering the dielectric properties of the air space between the capacitor plates (21, 22). The change in capacitance is, therefore, related to the cross-sectional size of the fluid column, as larger cross sections will alter the dielectric properties of the air space more strongly than smaller cross sections. To fix the position of the dispensing needle relative to the capacitive sensor, the sensor was attached to a concentric mounting plate, with a guiding hole. The diameter of the guiding hole was carefully fitted to the diameter of the dispensing needle tip and should prevent any liquid from sprinkling onto the capacitor plates. The detection principle of the dispensed volume is based on the detuning of a high-pass filter. When liquid is dispensed through the electric field of the capacitor, its value changes for the time of flight; therefore, the frequency characteristic of the filter shifts depending on the geometry of the dispensed liquid and its material-specific dielectric constant (16, 17).
2.3. Gravimetric Regression Method
The GraviDrop software is designed to achieve a more precise method for measuring liquids in the submicro- and nanoliter range, based on a method that takes the evaporation and fluctuations of a microbalance into account. The software makes use of a novel gravimetric measurement technique, which measures the weight for a certain measurement time, consisting of the dispensing event and a post dispensing settlement time. The dispensed volume is derived from the difference in weight before and after the dispensing event, taking into account the evaporation effects that occur during dispensing. Additionally, an uncertainty factor delivers information regarding the accuracy and equivalency of evaporation effects and other influences. This novel method relies on the linear regression analysis of continuously monitored gravimetric results and, therefore, is referred to as the “gravimetric regression method (GRM)” (23).
2.4. Measurement Process
The measurement process was started by the GraviDrop software. When the software was ready, it triggered a fill by the filling system. The trigger electronic board was a customized microelectronic board that receives serial commands from the GraviDrop software, via USB, and sends a trigger signal to the filling system. The fill controller software was customized to detect incoming triggers from the trigger electronics, to wait for a delay time of approximately 50 ms, and then to begin the filling event, which caused the peristaltic pump to actively dispense liquid into the measuring cylinder on the balance. The liquid flow in the system caused the investigated sensor to generate a corresponding sensor signal, which was simultaneously A/D converted, at sampling frequencies between 1 and 5 kHz. The sensor signal was stored in a CSV file by Meilhouse Reader software. After a programmed time interval, the gravimetric result was recorded by the GraviDrop software, and the gravimetric data were added to the CSV file containing the sensor signal. Each dispensing process created an individual CSV file. Typically, one run contained 24 dispensing repetitions with stable parameter settings (24). The amount of dispensing repetitions was chosen to account for small deviations in the measurement setup as well as temperature fluctuations during measurement.
3. Results
We investigated the applicability of different sensor types for the aseptic filling of volumes <200μL as well as the influence of unidirectional air flow on gravimetric fill weight accuracy.
3.1. The Influence of Unidirectional Airflow
Figure 4 illustrates the influence of UDAF on the gravimetric measurements, after a calibration weight of 50 mg was placed onto fifty 2-mL vials to guarantee a continuous weight by eliminating influencing factors, such as the possible evaporation of a drug product solution. The dotted lines indicate the upper and lower limits of ±7% which is used as an accuracy limit for gravimetric IPC for fill volumes <100 µL. With the UDAF in full operation, 12 out of 50 vials were outside of the accuracy range and would be discarded, resulting in a 24% loss. When the UDAF was off, the loss of out-of-range vials was reduced to 4 out of 50 vials (8%), which still represents a significant magnitude. However, this experiment could only reduce the impacts of the UDAF. All other environmental disturbances remained constant (e.g., microvibrations), which could introduce variations. This was found to be the root cause as to why the median of the no UDAF data set was not equal to 50 mg of the calibration weight. Overall, the study showed that the influence of UDAF on a gravimetric scale cannot be neglected.

Influence of laminar airflow on a gravimetric scale (Mettler Toledo WM124-W22) for a commercial filling unit. Fifty individual 2 mL vials were tested, with and without unidirectional airflow (UDAF). The vial passed a tare scale, a 50 mg calibration weight was placed onto the vial, and the vial was further transported to the gross scale, where the weight difference was measured. The scales were calibrated using a 20 g stainless-steel weight (Mettler Toledo, OIML E2, Item number 158,437) and used in the 2 mL vial format, according to standard production routine. Dotted lines indicate the upper and lower fill accuracy limits (±7%). Data points are shown as box plots, based on the median values.
3.2. Sensor Results
The overall aim of the study was to investigate potential technologies that could be applied to industrial filling processes, to enable aseptic filling with a level of precision that would allow the complete elimination of necessary downdosing processes during the administration of treatment. Because the typical administration volume of intravitreal treatments is 50 µL, we strictly focused our study on this volume, accounting for a <10 µL dead space in a prefilled syringe. Therefore, the data point of the highest importance, in terms of therapeutic dosing, was the 60 µL target fill volumes, which is within the range of all tested sensors.
The sensors tested in this study can be grouped into three individual categories, based on application similarities: (1) indirect measurement sensors, (2) pressure-based sensors, and (3) sensors located at the orifice of the filling needle. Pressure based sensors (capacitive pressure and MEMS) are installed in the liquid path, and their signals are based on the liquid flow toward the filling needle. The sensors that are installed at the orifice of the filling needle (direct capacitive and optical) measure the amount of liquid that is actually dispensed through the filling needle. The third measurement technique (airflow) measures the physical effects occurring at the fluid reservoir. All of the sensor results, as well as the working principle of each sensor, are presented in Table I.
For each investigated sensor, a dispensing volume in the range of 10–100 µL was investigated. Each dispensing series consisted of multiple runs, depending on the investigated sensor type. Each run represented 24 dispensing repetitions, with unchanged, consistent filling parameters. Initially, the sensor performance was compared directly to the gravimetric measurement, which represents the current state-of-the-art method. The weight of each filling event was used to determine accuracy and precision. The accuracy of one run was calculated as the deviation between the recorded sensor signal and the gravimetric value. The precision of one run was calculated as the standard deviation of the sensor signals. All sensors showed an individual signal and had to be postprocessed by integration. Thus, after linear regression to the integration results, the outcomes were the calibrated sensor results, in microliters.
Based on this calibration, a comparison between the sensor results and the gravimetric results was feasible. Each graph shows the sensor results, on the y axis, plotted against the gravimetric measurements, on the x axis. If the sensor data and the gravimetric data matched perfectly, all data points would be located on the biangular section. For more detailed comparisons of the data, the means and standard deviations for all sensor and gravimetric results were calculated. The accuracy and precision data for a dispensed volume of approximately 60 µL (resulting from six peristaltic cycles) were compared for the final evaluation of the different sensors.
Indirect Measurement Sensor
3.2.1. Airflow sensor:
The airflow sensor is capable of measuring small amounts of any gas (air in this case) that vents to the reservoir. The results demonstrated that the application of this sensor concept could be used quantitatively to measure dispensed volumes. After data sampling and data processing, the airflow could be correlated with the dispensed volume, independent of fluid properties. The sensor performance graph in Table I shows the correlation between airflow sensor measurements and gravimetric results, based on nine runs and dispensed volumes ranging from 30 to 100 µL. The accuracy and precision for a representative volume of 60 µL were measured and shown to be +3.4% and ± 1.1%, respectively, which was considered to be a promising performance.
Pressure-Based Sensors
3.2.2. Capacitive Pressure Sensors:
Four individual runs were performed using the relative pressure setup based on the capacitive sensor. The dispensed volumes ranged from 10 to 85 µL. The accuracy of the sensor signal was 0%, relative to the gravimetric results for a representative volume of 60 µL. A value of ±2.9% calculated for the precision of this sensor reflects its very high performance. The differential setup, shown in Figure 2B, was also tested but showed no improvement in sensor performance (data not shown).
The test results for the relative pressure setup using the MPXV5050 MEMS sensor covered a dispensing range from 9.7 to 96.7 µL. For a 60 µL volume, the sensor showed a remarkable deviation relative to the gravimetric measurement of 0.0% and a precision of ± 0.6%, which was the best performance for all pressure-based sensor setups. Comparable with the capacitive pressure sensor, the differential pressure setup using two MEMS sensors showed no benefit over the relative setup (Figure 3) (data not shown).
Sensors Located at the Orifice of the Filling Needle
3.2.3. Optical Sensor:
The optical sensor was installed underneath the filling needle and measured (100% contact-free) the fluid directly as it was dispensed from the needle. For this measurement, airflow and pressure conditions do not need to be considered. The sensor performance graph in Table I shows the calibrated results of the optical sensor relative to the gravimetrical measurements. Eight different runs were performed, covering a volume range from 11.6 to 95.7 µL. The investigated volume of 60 µL showed a deviation of −0.1% relative to the gravimetric results and a precision of ±1.1%.
3.2.4. Capacitive Sensor:
The strengths of the capacitive sensor were comparable to those for the optical sensor approach. The sensor capacitor was installed directly below the filling needle and measured the dispensed liquid by measuring the direct change in the sensor’s capacitance, which was caused by the liquid’s permittivity. The sensor was tested over a volume range of 12.3–97.9 µL. The results for the representative volume of 60 µL showed an accuracy of −0.3% and a precision of ± 0.3% relative to the gravimetric results.
4. Discussion
To compare the performances among all tested sensor types, the estimated accuracy and precision values for a fill volume of 60 µL were calculated relative to the gravimetric measurements, as shown in Table I. This volume was chosen as the reference value for the desired fill volume during the manufacturing process because intravitreal injections are often administered at 50 µL doses; therefore, a 60 µL fill volume represents the hypothetical manufactured volume used for a prefilled syringe, including the required overfill volume. Each data point was measured with n = 24 repeated dispensing events to account for small deviations (e.g., temperature fluctuations) during the measurement.
The indirect measurement sensor (airflow) showed good accuracy and precision over the whole volume range tested. The measurement of airflow into the reservoir could serve as an effective concept because of the independence from fluid properties and a high degree of accessibility. However, an airflow sensor installed at the reservoir has the greatest distance from the filling needle. Therefore, this method bears the risk of false-positive volume detections because of influences such as leakages and UDAF, which could lead to falsely filled primary packaging containers. The accuracy and precision of the airflow sensor for a 60 µL volume revealed promising sensor performance (Table I). However, the performance of this sensor was less promising compared with the results for the other sensor types. However, the advantages of this noninvasive measurement method and its independence from fluid properties could be of potential interest for further development.
The examination of the pressure-based sensors demonstrated that the relative measurement method, which uses a single pressure sensor, was easier to implement and performed better than the differential measurement, which requires a second pressure sensor and an additional fluidic resistance element. Similar findings were observed for both the capacitive pressure sensor and the MEMS sensor. The reduced performance observed for the differential method was unsurprising because of the requirement for two sensors, increasing the risk of individual errors associated with each sensor, which could potentially result in increased measurement errors. Thus, the additional installation of the second sensor was unnecessary if the dispensing needle can provide fluidic resistance. When comparing the MEMS sensor with the capacitive pressure sensor, the MEMS sensor revealed the best measurement performance. This sensor is commercially available at a comparably low cost. Additional investigations have shown that the MEMS sensor is capable of detecting errors and failure modes, which could represent an interesting feature for improved process control. However, the implementation of any sensor into the fluidic path remains a key challenge because of the requirements associated with medical and aseptic procedures (i.e., cleaning in place/sterilization in place, temperature, and high pressures), and both pressure-based systems examined in this study are incompatible with industry-standard sterilization procedures. Another potential weakness of this sensor type is its sensitivity, regarding air bubbles in the fluid. This weakness could be overcome by intelligent signal analysis, which could also be used for further failure detection.
The primary advantage of sensors that are installed at the filling needle orifice (optical sensor and direct capacitive sensor) is that the dispensed liquid volume is directly measured. If spilling, dripping, and off-targeting can be avoided, the dispensed volume will be delivered into the primary packaging container and successfully detected by the installed sensors, resulting in a low risk of either false-positive or false-negative results. Both of the sensors tested in this study showed promising results in terms of accuracy and precision and should be explored for further development and future implementation. Both sensors promoted contact-free measurement, with 100% IPC for every single container. The optical sensor may be sensitive to the transparency and color of the dispensed fluid, which must be tested in future investigations. Furthermore, the optical sensor signal can be directly influenced by a variety of fluid properties, including color, turbidity, velocity, shape, and the position of the sensor, which could limit the application of this sensor type. Therefore, a calibration step against orthogonal methods remains necessary.
The capacitive sensor showed the best performance and was, therefore, considered to be the most promising for further development and future integration into an aseptic filling line. The impressive accuracy and precision of the capacitive sensor, in combination with the 100% contact-free measurement of every single fill, was a promising outcome of the study. However, some hurdles must still be cleared during development. The capacitive sensor remains in the development stage and was used as a prototype during this study. The sensor is susceptible to the permittivity of the dispensed liquid, and the velocity of the liquid cannot yet be measured. Both the sensor and the corresponding electronics would require further development before implementation is possible.
An important factor for the successful implementation of a novel IPC sensor is the sensor read time and the alignment of the sensor reads with high-speed filling rates. A typical filling time on high-speed filling machines is approximately 700 ms. During gravimetric IPC, the measurement can only start after the actual filling step is complete. Scales require settling time, measurement time, and time for the final communication with the programmable logic controller. Conceptually, the presented IPC systems work based on the data processing (integration) of sensor signals generated during the filling process. All data is readily available at the end of the fill, and no stabilization or post-fill measurement time is necessary, making the studied technologies comparably fast, which may represent a large advantage during high-speed aseptic filling. The calculations are thought to take approximately 1 ms. Nevertheless, there is the need to implement a feedback loop between the IPC sensor and the filling system to allow corrective actions to account for deviates from the target fill volume.
Because every sensor type has specific advantages and disadvantages (Table II), the combination of several sensor technologies could merge the advantages of the individual sensor types. One possible option for a suitable setup could be to use a capacitive sensor near the filling needle orifice, to detect the dispensed fluid, whereas the MEMS sensor is used to monitor process stability and the identification of possible interferences, such as bubble formation, needle clogging, and leakage/major spill detection Furthermore, the addition of a third sensor (e.g., airflow) could provide information regarding the whole filling pathway, ranging from the start (reservoir) to the center (tubing between the pump and the filling needle) to the end (filling needle). The use of additional sensors in different regions of the filling pathway could also assist with troubleshooting situations by automatically recognizing specific patterns based on performance algorithms. Additionally, the influence of different fluid properties remains to be investigated in future studies. Highly concentrated protein formulations designed for subcutaneous applications have shown the potential for non-native aggregation, which contributes to higher viscosities (25⇓–27). Among the sensors tested in this study, both of the sensors placed at the filling needle orifice should be independent of fluid viscosity; however, these sensors do require calibration for fluid velocity. Calibration and recalibration activities may be a finicky and time-consuming step during routine manufacturing. Therefore, additional testing of different protein formulations will be necessary to fully investigate the extent of calibration activities needed.
Summary of the Advantages and Limitations of All Tested Sensors
In summary, the capacitive sensor was the most promising sensor technology, in terms of accuracy and precision, for the determination of fill volumes in the desired volume range of <200 µL. The MEMS pressure sensor, using the relative pressure method, and the optical sensor also showed potential for further development.
Conflict of Interest Declaration
The authors declare that they have no competing interests.
- © PDA, Inc. 2020


