
Abstract
It is generally acknowledged that quantitation in extractables and leachables (E&L) can be variably reproducible and accurate, depending on the quantitation approach taken. This is especially true for “simple” quantitation, which is the practice of estimating an analyte's concentration based on its response relative to that of an internal standard that has been added to the sample in a known amount. Simple quantitation is prone to error and variation as it is based on the largely false premise that the response factors for all extractables, leachables, and internal standard candidates are the same. It has been proposed that this uncertainty (inaccuracy and variation) be accounted for by adjusting two key parameters in E&L assessment, the reported concentrations themselves and the analytical evaluation threshold (AET) via an uncertainty factor (UF). This paper examines quantitation variation and discusses the means of establishing and utilizing the UF to adjust the AET to lower values and to adjust reported concentrations to higher values, enabling an impact assessment performed with this data to be more protective of patient safety. Although adjustment of the AET lower with the UF is supported, flaws in the concept of using the UF to adjust reported concentrations upward are considered, and it is recommended that the UF not be used in this manner. Rather, E&L quantitation should be based on compound-specific relative response factors, collected and collated in an E&L database.
- Extractables
- Leachables
- Analytical evaluation threshold
- Quantitation
- Uncertainty factor
- Safety risk assessment
Introduction
When pharmaceutical drug products (DPs) are packaged in a container-closure system (CCS), the DP and the CCS will chemically interact. Similarly, a medical device interacts with a patient, either directly or indirectly, during its clinical use. One important interaction is leaching, wherein substances (called leachables) originally present in the CCS diffuse into the DP (or substances originally present in the medical device migrate into the patient). Corresponding to leachables are extractables, which are substances that are present in the CCS or medical device and which could be leached (i.e., are potential leachables).
The purpose of an extractables/leachables assessment is to establish either those extractables that could leach by performing a controlled extraction study on the CCS or to establish those leachables that have leached by performing a migration study. In either case, the extract, the DP or the contact medium between a medical device and the patient is screened for organic extractables or leachables using chromatographic methods to discover, identify, and quantify these substances. Once the substances have been identified and quantified, this information is interpreted in the context of the effect that the substances could have on DP or medical device quality and/or patient safety.
Although quantitation during screening is an essential component of the proper assessment of extractables and leachables (E&L), quantitation in E&L screening is not without its challenges. Quantitation approaches and processes used in screening vary widely, and it is therefore no surprise that so-called quantitative screening results vary widely and generally miss the mark in terms of accuracy.
The purpose of this paper is to consider the following three aspects of E&L quantitation:
adjusting the analytical evaluation threshold (AET) for analytical variation;
adjusting reported concentrations for analytical variation; and
variation in quantitation.
This paper relies heavily on the existence of a database of response factors (RFs) for the population of extractables/leachables. Although the topic of what constitutes a proper and robust RF database is relevant, it is outside the scope of this paper. Rather, this paper makes the assumption that the database is sufficiently large (in terms of the numbers of compounds in the database) and diverse (in terms of the functional types of compounds in the database) that it effectively mirrors the response characteristics of the entire general population of organic extractables.
Adjusting the AET for Analytical Variation
This section of the commentary addresses the concept and use of the analytical evaluation threshold (AET) and considers how to properly use an uncertainty factor to adjust the AET for response variation.
Introduction
An important issue in E&L screening is “how low do you go?” That is, one interpretation of the requirements for reporting E&L is that “you must identify and quantify all substances that are detectable”, which typically means all peaks with a signal to noise ratio greater than 3 as the general definition of the detection limit. In certain circumstances (such as aggressive extraction of a chemically complex CCS), this may mean that the number of peaks that need to be reported is large and the difficulty in terms of securing identities for all peaks is significant. In such circumstances it may be challenging, if not impossible, to accomplish the necessary task.
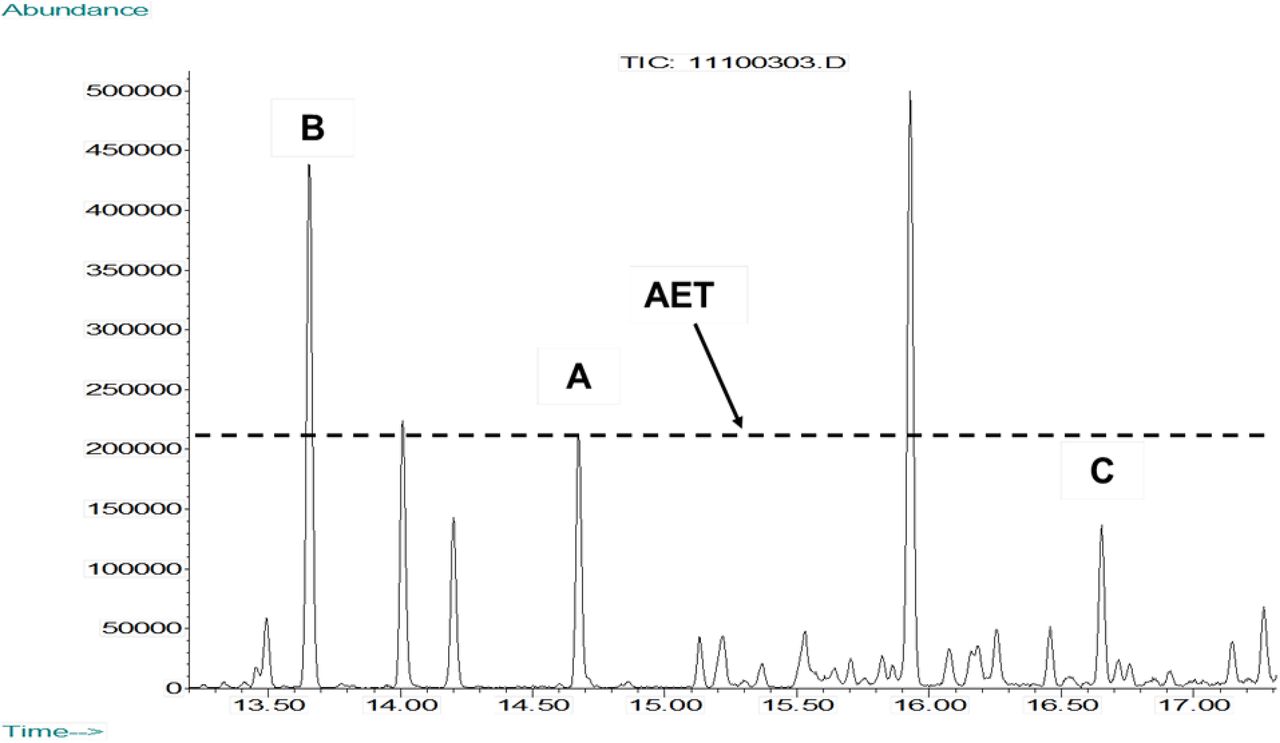
To this end, the concept of the AET was developed by an Extractables and Leachables Working Group of the Product Quality Research Institute (PQRI) to facilitate the toxicological safety assessment of E&L. The AET is defined as the “threshold below which the analyst need not identify or quantify leachables or extractables or report them for potential toxicological assessment” (1). Practically, the AET is interpreted as shown in Figure 1; chromatographic peaks whose response is greater than or equal to the AET must be reported for toxicological safety assessment (meaning they must be identified and quantified), whereas peaks whose response is less than the AET do not need to be reported (meaning that they do not need to be identified and further quantified) as their adverse effect on patient safety is accepted to be negligible.

Representation of the analytical evaluation threshold (AET). Peak A corresponds to an internal standard present in the test sample at a concentration equal to the AET. Thus, a horizontal AET line can be drawn across the chromatogram using the apex of A as the reference point. Peaks whose response apex falls above such a line (e.g., peak B) are present in the sample at levels above the AET and the compound responsible for peak B should be identified and quantified to enable its toxicological assessment. Peaks whose response fall below the line (e.g., peak C) are present in the sample at levels below the AET and can be toxicologically assessed as safe without identification or quantification. Although the concept of the AET is illustrated via peak heights, it is also applicable for peak areas as well.
In essence, the AET is a “protective” threshold in the sense that compounds above the AET are required to be toxicologically assessed, thereby protecting patient safety.
When the concept of the AET was developed, it was recognized that there are sources of uncertainty in the quantitation methods used by chromatographic screening methods. That is, although it is highly desirable that the response factors of the chromatographic methods be the same for the entire population of organic extractables/leachables, the practical reality is that the analytical response factors across compounds vary, sometimes significantly. The implication of this variation is that the AET becomes potentially unprotective. For example, compounds with low RFs could appear to be below the AET based on response, when in fact their concentration is greater than the AET. This means that these low-responding compounds would not be reported for assessment, even though there is a chance that they might be safety-impacting. In such cases, the AET is not protective for these potentially harmful, low-responding substances.
This lack of protection suggests that the AET should be adjusted so that it can be protective for low-responding substances. In fact, the original PQRI recommendation for the AET was that the final AET be an adjustment of an initial (or estimated) AET, with that adjustment being designed to account for analytical uncertainty (RF variation). The specific AET recommendation was “The Working Group proposes and recommends that analytical uncertainty in the Estimated AET be defined as one (1) %Relative Standard Deviation in an appropriately constituted and acquired Response Factor database OR a factor of 50% of the Estimated AET, whichever is greater”. Mathematically, this correction to the final AET can be expressed as (2⇓–4)
 where
where
fAET = final AET
eAET = initial (or estimated) AET
UF = the uncertainty factor
In the case of an RF database, the uncertainty factor (UF) has the following value:
 where RSD is the relative standard deviation of the response factor database. As one can see from eq 2, the calculated UF becomes untenable in the case where the RSD approaches 1 (i.e., the standard deviation [STD] approaches the mean). This behavior reinforces the concept that correction of the AET using the UF is challenging when the RSD is large. In the more general case, the value of UF is 2.
The purpose of this part of the paper is to consider the AET adjustment in terms of its scientific basis and practical implementation.
Discussion
Two aspects of response factors are relevant when considering an adjustment to the AET, the mean of a response factor dataset and the variation in the response factors in the dataset, reflected, for example, in the dataset's standard deviation. Each is considered in greater detail as follows.
Discussion Based on a Normal Distribution of RFs:
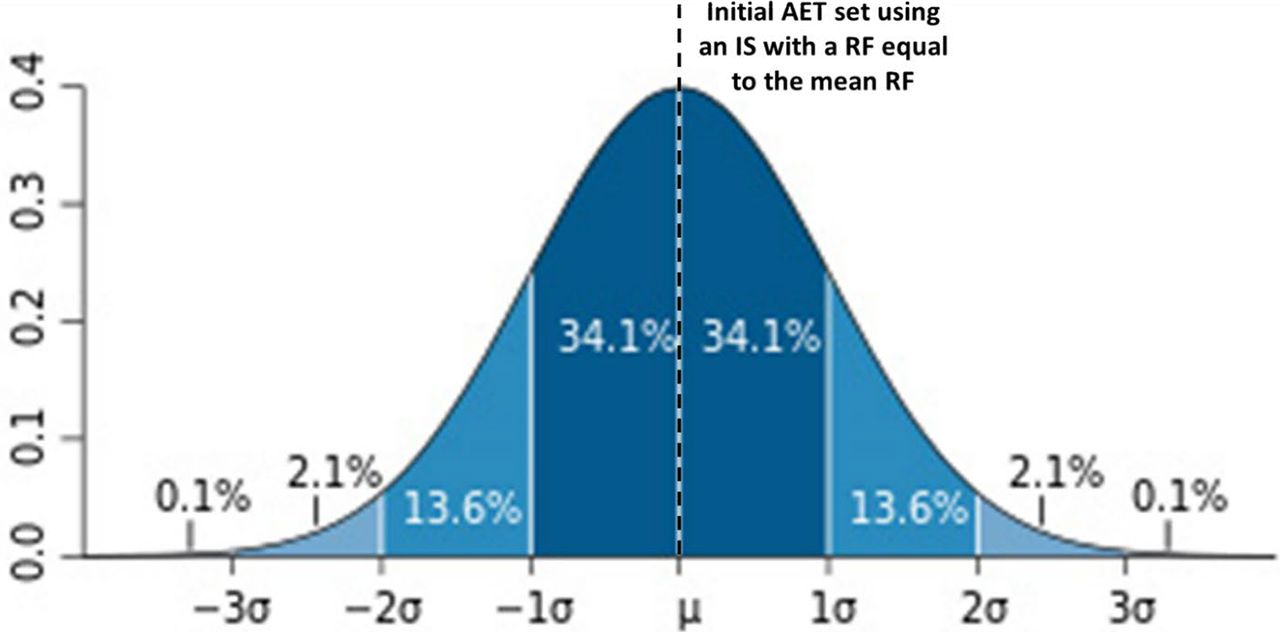
Consider the situation shown in Figure 2, where the RFs for all extractables or leachables exhibit a normal distribution and the AET is established based on an internal standard (IS) whose RF falls somewhere within the distribution of the RFs for all E&L. Depending on where the RF of the IS falls, the AET either becomes more or less protective (i.e., it is either protective for a greater number of compounds or protective for a lesser number of compounds). For example, if the IS has a RF exactly at the distribution's mean, then the initial or estimated AET will be protective for the 50% of the population whose RFs are equal to or greater than the RF of the IS. Conversely, the AET may not be protective for the 50% of the population whose RFs are less than the mean. As being protective for only 50% of the compounds likely is not adequate, this establishes either the need to:
properly choose the IS; or
perform a final AET adjustment to address variation in RFs.

Illustration of the “protective power” of the analytical evaluation threshold (AET). If the AET is established by an internal standard whose response factor is equal to the mean of the response factor distribution among all extractables and leachables, then the AET is “protective” only for those substances whose response factors are greater than or equal to the mean (50% protective).
Properly Establishing the IS:
Generally, the IS used in chromatographic screening is chosen based on chromatographic and practical factors (sensitivity, selectivity, availability in high purity, stability, use in other fields such as environmental) and not in terms of its position in the distribution of the universe of RFs. Thus, its position in the universe of RFs is almost an accidental afterthought. However, as shown in Figure 2, failing to account for the IS RF's position in the population can have consequences in terms of the AET's protective power. When the AET is based on an IS with a RF equal to the population mean, the AET is only protective for 50% of the compounds.
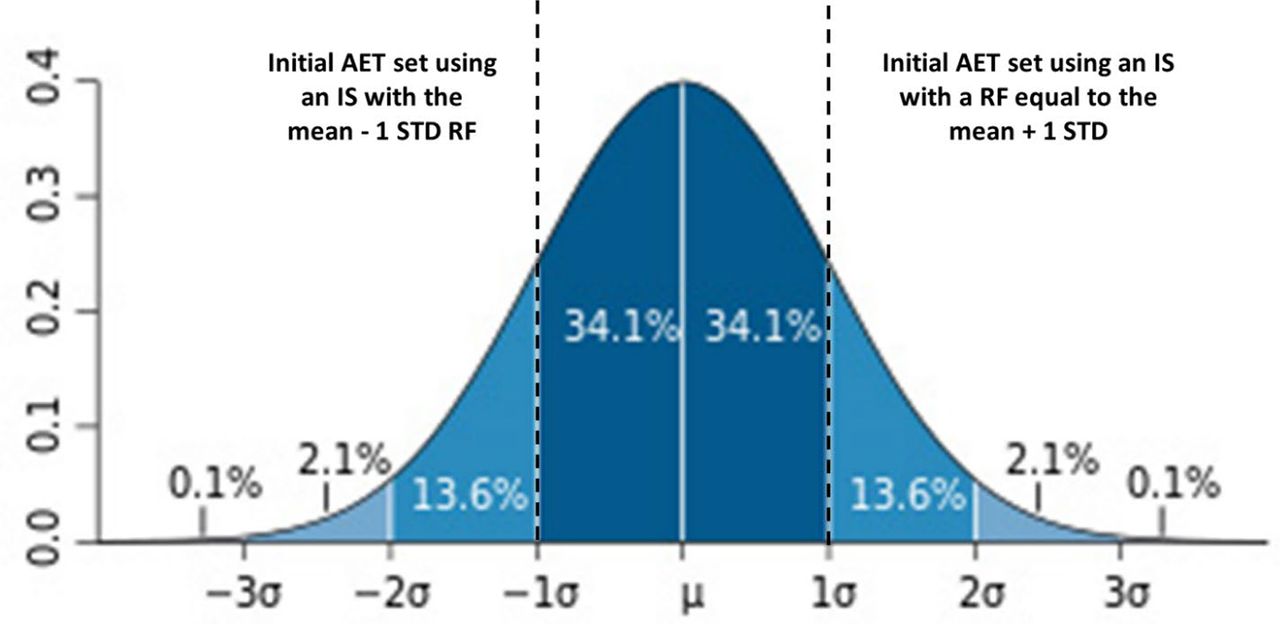
We see; therefore, that we can affect the AET's protective power by our choice of IS. This concept is illustrated in Figure 3. If we pick, for example, an IS with a lower RF (specifically, mean – 1 STD), we can increase the AET's protective power, in this case to 84.1% (i.e., 84.1% of the substances are covered by an AET set with an IS whose response factor is mean – 1 STD). However, if the IS were such that it has a higher response factor (specifically, mean + 1 STD), then we have decreased the AET's protective power, in this case to 15.8% (i.e., 15.8% of the substances are covered by an AET set with an IS whose response factor is mean + 1 STD).

Illustration of the “protective power” of the analytical evaluation threshold (AET) based on various internal standard response factors. If the AET is established by an internal standard whose response factor is equal to the mean + 1 standard deviation (STD) of the response factor distribution among all extractables and leachables, then the AET is “protective” only for 15.8% of the compounds in the database. However, if the AET is established by an internal standard whose response factor is equal to the mean −1 STD of the response factor distribution among all extractables and leachables, then the AET is “protective” for 84.1% of the compounds in the database.
The practical implication of this analysis is that if one has a database of RFs, then one can use that database to establish and justify an initial AET that potentially needs no uncertainty adjustment. Specifically, if the AET is set with an IS whose RF is mean – 1 STD, then the AET is sufficiently protective without adjustment as it accounts for 84.1% of all compounds in the database (and presumably in the general population of extractables).
In this way, the proper value of the RF of the IS is established. The identity of the proper IS is established by querying the database and finding that compound that has the right RF and that has the other characteristics of a good IS as noted previously. Thus, the E&L database should also include RF data for potential internal standards.
Adjusting the AET:
The conclusion of the previous paragraph notwithstanding, the protective power of the AET implemented with an IS with any RF can be increased by adjusting the AET to account for the variation in RFs via eqs 1 and 2. Figures 4⇓–6 illustrate the effect that using an UF calculated using eq 2 to adjust the initial AET will have on the protective power of the adjusted final AET.

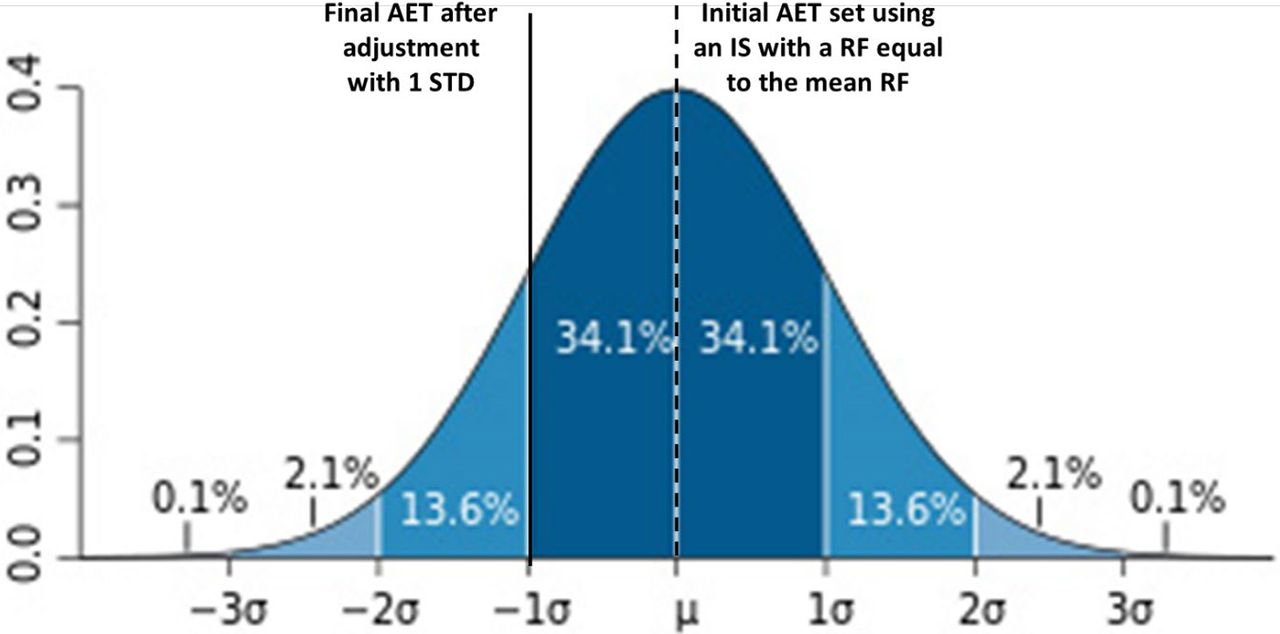
Adjusting an initial analytical evaluation threshold (AET) set with a response factor equal to the population mean. Adjustment via an uncertainty factor equal to 1/(1 − relative standard deviation) increases the “protective power” of the final AET from 50% to 84.1% of the population of extractables and leachables.

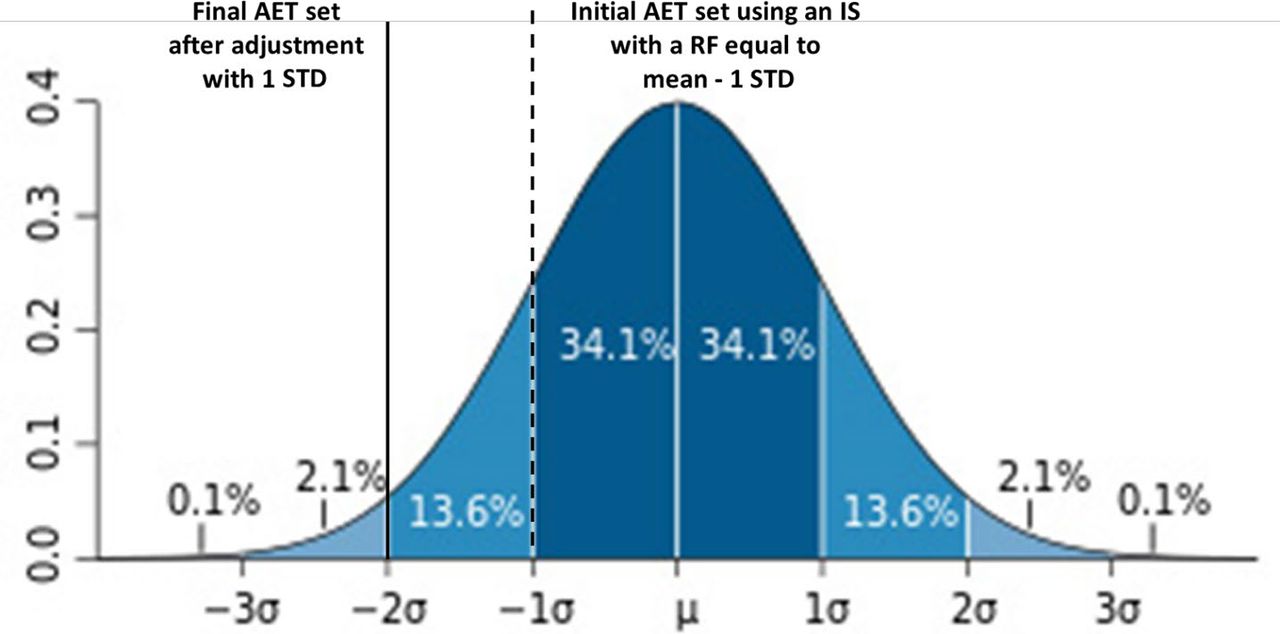
Adjusting an initial analytical evaluation threshold (AET) set with a response factor equal to the population mean–1 standard deviation. Adjustment via an uncertainty factor equal to 1/(1 − relative standard deviation) increases the “protective power” of the final AET from 84.1% to 97.7% of the population of extractables and leachables.

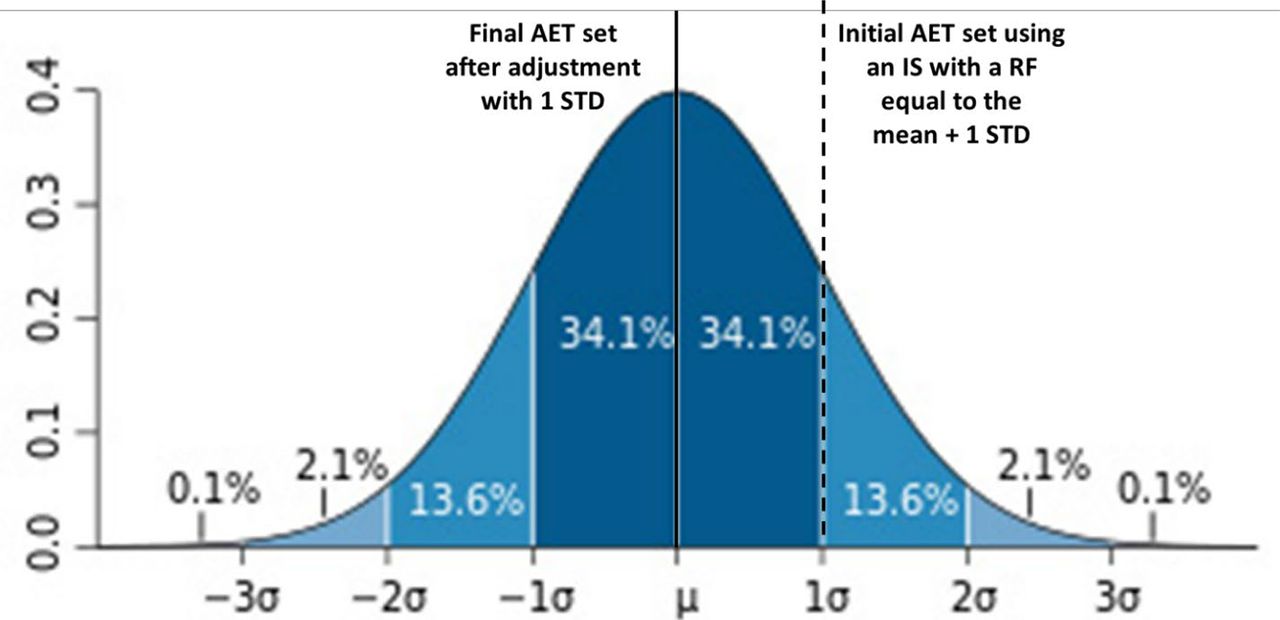
Adjusting an initial analytical evaluation threshold (AET) set with a response factor equal to the population mean + 1 standard deviation. Adjustment via an uncertainty factor equal to 1/(1 − relative standard deviation) increases the “protective power” of the final AET from 15.7% to 50% of the population of extractables and leachables.
An Example Using a Database of Response Factors for Gas Chromatography with Mass Spectrometric Detection:
A term that is substantially equivalent to the RF is relative response factor, RRF, where the RRF is the ratio of the RFs, compound versus IS:

Thus, the RRF is essentially a compound's RF “normalized” versus the IS's RF. Trends exhibited in the RF will also be exhibited in the RRF.
Table I represents the content of a recently published database (5) of RRF values for E&L screening by gas chromatography with mass spectrometric detection (GC/MS) that was produced by Nelson Labs (hereafter referred to as “the Database”). Considering this information, the RSD for the Database is calculated as the STD/mean = 0.425/0.645 = 0.659 (all data). For this data, 1−RSD = 1 − 0.659 = 0.341 = UF. This would mean that one would divide the AET by a factor of 1/0.341 = 2.93 to get the final AET and that all peaks above this final AET would have to be identified and reported for toxicological safety assessment. It is noted that this distribution is specific to the analytical methods and processes used by this laboratory.
Distribution of Relative Response Factors (RRFs)a Related to Semivolatile Compounds in the Nelson Database for GC/MSb
The UF is somewhat smaller if one considers the database minus the compounds with the really low and likely insufficient RFs, taken as UF < 0.1 (the numbers in parentheses in Table I). This is justified if one takes the position that compounds with a really low RF (≤0.1) should not be reported by the method and should be addressed by another method where the compounds have a higher RF. This is the case as there is likely to be greater uncertainty in the RFs if the RFs themselves are low. Using this data, RSD = 0.407/0.687 = 0.592, 1 − RSD = 0.408 and UF becomes 2.45.
It is noted that in both cases, the UF is larger than “a factor of 2” that is the “default UF” recommended by the PQRI (1). This means that a UF of 2 is not sufficiently protective.
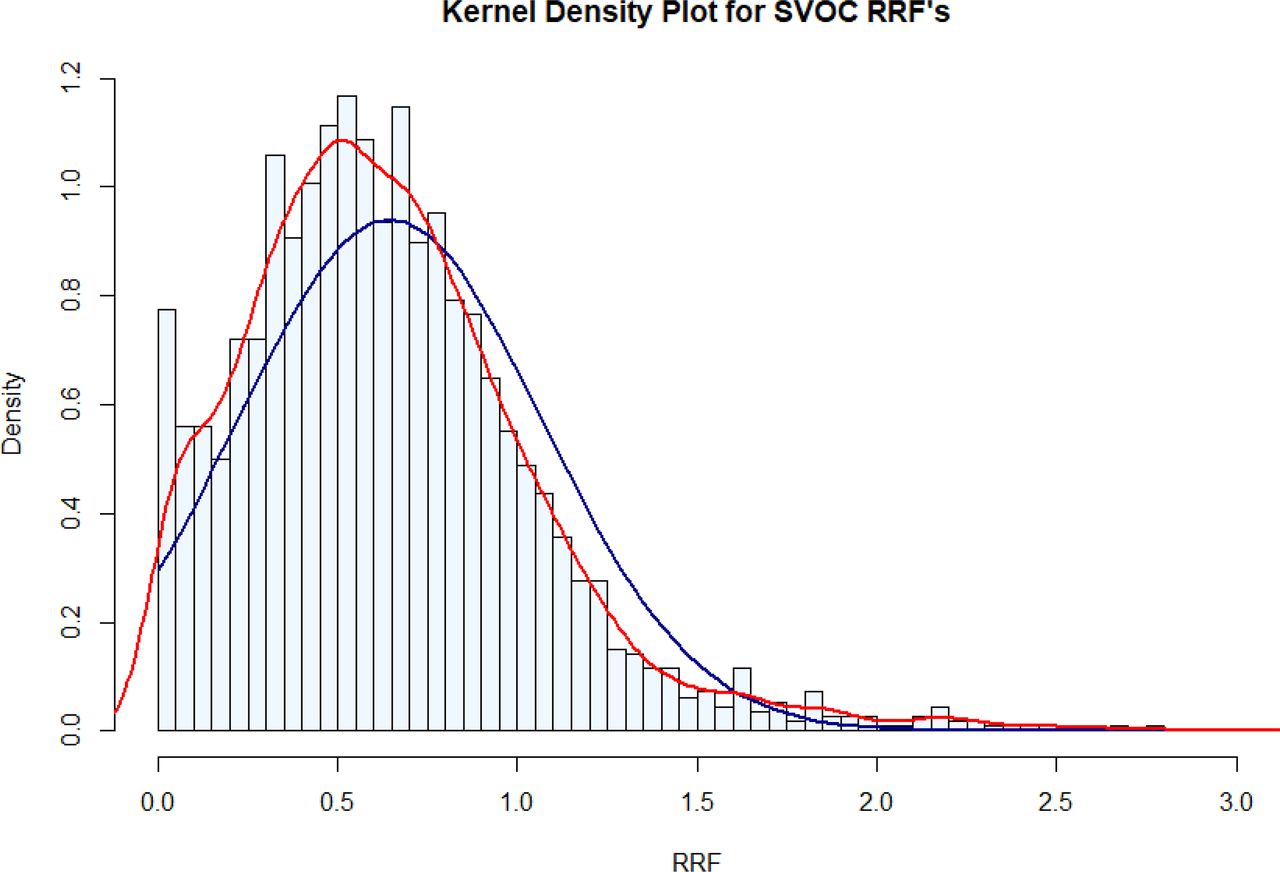
Figures 2⇑⇑⇑–6 address the case where the RF (or RRF) values were characterized by a normal distribution. As noted in Figure 7, the distribution of RRF values in the Database is not strictly normal and is skewed toward lower RRF values. Nevertheless, the normal distribution is an acceptable approximation of the character of the Database and the observations made previously for the normally distributed data would be qualitatively relevant to the compounds and information in the Database.

Frequency distribution of relative response factors (RRFs) from the Database. The individual histograms and the red curve represent the actual experimental data, whereas the blue shapes represent a normal distribution with the population mean and standard deviation. The distribution is skewed low, meaning that there are more compounds with lower RRFs than there are compounds with higher RRFs. The RRF values are obtained with 2-fluorobiphenyl as the internal standard.
Conclusion
Making the AET sufficiently protective to account for potentially harmful extractables or leachables requires that the derivation of the AET be carefully considered. The AET's protective power can be increased by either selecting an IS to represent the AET whose RF is lower than the mean RF for a population of extractables, leachables, and potential ISs or by adjusting the AET lower with a UF that is statistically derived from the RF database. Selecting an IS whose RF is the population mean minus the population STD will be sufficiently protective as it will account for 84.1% of the E&L in the database. Although adjusting the AET down by a UF factor of 1/(1 − RSD) will make the AET more protective, the degree of protection provided by the AET will depend on the position of the response of the IS used to represent the AET in the RF distribution. The combination of choosing the IS as a compound whose RF equals mean − 1 STD and adjusting the AET down by a UF equal to 1/(1 − RSD) will produce an AET that is protective for 97.7% of all compounds in the RF database. It is noted that this discussion is based on a database whose distribution of RF values is normal.
Analysis of a published database of GC/MS RFs (the Database) has demonstrated that the conventional assignment of UF = 2 underestimates the uncertainty in RFs for this analytical method (and thus is not sufficiently protective), as a UF closer to 3 is calculated based on statistical analysis of the RFs in the database.
Furthermore, it is noted that this assessment considers GC/MS data, whose RFs are generally recognized as being relatively constant, compound to compound. It is anticipated that the value of the UF, and therefore the lowering of the AET resulting from application of the UF, would be more significant for an analytical method such as liquid chromatography with mass spectrometric detection (LC/MS), where it is generally accepted that the response variation between compounds is much greater. This is the case largely because the ionization process and detector operating conditions used with GC/MS (electron ionization, EI, and 70 eV) have generally been standardized across instruments and among practitioners, whereas the ionization processes and detector operating conditions used with LC/MS vary significantly across instruments and practitioners.
Adjusting Reported Concentrations for Analytical Variation
When an analyte's concentration is estimated by comparing its response to that of an internal standard, the accuracy of the estimated concentration depends on the response factor of the analyte versus that of the internal standard. The use of an uncertainty factor to account for response factor differences between analytes and an internal standard is discussed as follows.
Introduction
Knowing the concentration of an extractable is essential, as it is the combination of the extractable's concentration and the daily delivered dose that establishes the patient's exposure to leachables or extractables as probable leachables. In target analysis, E&L are quantified via calibration curves that are generated for each targeted analyte(s). This is possible as generally the number of targets is few and the targets are, after all, known. However, in screening analysis, where the population of potential compounds is large and the compound's identities are generally not known, it is obvious that it is impractical to generate calibration curves for each member of the population.
Rather, the concentrations of E&L in screening can be estimated using RFs. A commonly applied approach is to establish a RF for a single IS and then apply that response to all the discovered extractables or leachables Such an approach is termed simple quantitation in this paper. Although this approach has been called semiquantitative in other sources, so doing provides a sense of confidence in the process that is not justified. Specifically, semiquantitative implies “almost quantitative” or “nearly quantitative” or that the concentration in question is close to being correct. In fact, it is the major tenet of this paper that concentrations obtained by simple quantitation are frequently nowhere close to being correct and thus that the term semiquantitative is better reserved for a more reliable quantitation practice.
The issue with respect to simple quantitation is that it is well-known that the RFs for IS candidates and extractables/leachables vary, potentially widely, from compound to compound. Application of the IS RF to a compound that responds better than the IS will mean that the compound's concentration will be overestimated, whereas application of the response factor to a compound that responds worse than the IS will mean that the compound's concentration will be underestimated. Underestimation is particularly unfortunate in impact assessment (e.g., toxicological safety assessment) as an assessment based on an underestimated concentration will underestimate the impact. Considering safety, assessing an underestimated extractable or leachable could lead to the conclusion that the substance has no meaningful adverse impact on safety when in fact the opposite is possible.
To reduce the occurrence and risk of underestimation, it has been proposed that all estimated concentrations obtained via an IS RF be adjusted upward via the same UF that is used to adjust the AET. The following discussion considers the merits of such a proposal.
Discussion
Consider the situation shown in Figure 2 in which the distribution of RFs is normal and the IS is a compound whose RF is the mean (and median) of the distribution. In this case, the 50% of the compounds that have a RF greater than that of the IS (the right side of the curve) will not be underestimated; in fact, the higher the compound's RF, the more its concentration will be overestimated. Thus, no IS adjustment is needed for these compounds and if they are adjusted, their overestimation will only be exacerbated. Although such a conservative approach may insure patient safety, it ignores the downside that overestimation magnified by RF corrections potentially means that perfectly safe products either do not get to the market (because their risk is overassessed) or getting them to the market is delayed and more costly as unnecessary testing may be required to undo an erroneous assessment.
Now consider the impact of a one STD adjustment on those compounds that will be underestimated (the left side of the curve). A one STD adjustment will mean that those compounds that fall in the part of the distribution between the mean and the mean − 1 STD will have an adjusted concentration that is greater than or equal to their true concentration. Thus 34.1% of the entire population, and 34.1/50 = 68.2% of the compounds that would benefit from adjustment will be adjusted sufficiently. For the remainder of the compounds that would benefit from adjustment, even with the adjustment, their adjusted estimated concentrations will be below their true concentrations (which is 15.8% of the entire population and 31.8% of the population that would benefit from adjustment).
So, let us recap what an adjustment via the UF will accomplish:
For the 50% of the compounds that are OK (that is, whose reported concentrations are already equal to or greater than their true concentrations), adjustment increases their extent of overestimation.
Of the 50% of the compounds that would benefit from adjustment, 68.2% of them (34.1% of the entire population) would be sufficiently adjusted that their adjusted estimated concentration would be greater than or equal to their true concentration.
Of the 50% of the compounds that would benefit from adjustment, 31.8% of them (15.8% of the entire population) would be insufficiently adjusted and their adjusted estimated concentration would still be less than their true concentration.
To this author, this situation suggests that the one STD concentration adjustment does not accomplish its objective.
This is especially true when there exists a better way to correct for compound-to-compound response variation, which is to use the compound's own RF to quantify it. After all, the RFs are in the database so why don't we use them? In essence this means that each individual compound is individually adjusted for its difference in response versus the IS via its RRF, and that the adjusted concentration will equal the true concentration, within experimental error, provided that a reference standard is available.
Although the UF adjustment could be considered to be a generic or average adjustment, the RRF adjustment is a customized adjustment that further reduces overprotection.
A question that remains when using either approach is how to quantify unidentified compounds, which obviously will have unspecified RFs. In the UF approach, the concentrations of the unidentified compounds are estimated using the IS RF and then adjusted up with the UF. In the RRF approach, the concentration could be estimated using the mean RRF and the same UF adjustment. In the case shown in Figure 2, this would produce the same outcome, as the RF of the IS is the mean of the RFs for the entire population. In those more common circumstances where the RF of the IS is not the population mean, then using the mean RF could be more or less protective, depending on the relationship of the mean and IS RFs. If the mean RF were greater than the IS RF, then use of the IS RF and the UF correction would be more protective. If the mean RF were less than the IS RF, then use of the mean RF and the UF would be less protective. Thus, the proper answer to the question “what should I do about unknowns?” depends on the relative relationship between the response of the IS and the population's mean response.
Conclusion
Given the known variation in RFs among all compounds in an extractables/leachables database, one can argue that some type of adjustment to the estimated concentrations obtained using an IS RF is necessary and appropriate to be properly protective. However, a “standard” adjustment via a UF based on one STD applied to all estimated concentrations does not accomplish this objective as it (a) exacerbates the overestimation of compounds with higher response factors than the IS and (b) does not sufficiently adjust a significant fraction of the poorer responding compounds that would benefit from such an adjustment. On the other hand, the recommended, and “custom”, approach is to use each compound's individual RRF, which in essence provides an adjustment that is tailored to each individual compound.
If one is compelled (or tempted) to try to quantify unidentified compounds, then the proper approach depends on the relative relationship between the RF of the IS and the population's mean RF:
If the IS RF is less than the population mean RF, then the unidentified compounds could have their concentrations estimated using the IS RF adjusted with the UF, as this would be more protective.
If the IS RF is greater than the population mean RF, then the unidentified compounds could have their concentrations estimated using the mean RF adjusted with the UF, as this would be more protective.
Furthermore, it is noted that this assessment considers GC/MS data, whose RFs are generally recognized as being relatively constant, compound to compound. It is anticipated that the value of the UF, and therefore the raising of the reported concentration resulting from application of the UF, will be more significant for an analytical method such as LC/MS, where it is generally accepted that the response variation between compounds is much greater.
When advocating for a RF database, it is only fair to recognize the practical challenges associated with the development and upkeep of such a database. Cost and manpower investments aside, the issue of procuring a proper reference compound is significant and daunting. Although extractables are often well-known and well-characterized chemical entities, which may be commercially available with sufficiently high purity to serve as reference materials, many extractables are structurally complex and rarely encountered outside of E&L studies. Reference standards for such extractables must be generated, purified, and certified, which can be both a scientific and practical challenge.
Moreover, although it is not implicitly stated herein, it is assumed that the database used to establish the UF is a comprehensive database, meaning that the database is sufficiently large and sufficiently diverse that it adequately represents the entire population of potential E&L. However, establishing objective criteria for the size and diversity (composition) of such a comprehensive database remains a task for, and not an accomplishment of, the E&L scientific community.
Variation in Quantitation
There is an ongoing discussion among practitioners of E&L concerning variation. There is some evidence, largely anecdotal, that E&L screening results are inadequately accurate and reproducible, lab to lab, to support rigorous impact assessment. At face value this seems improbable, given the pride the E&L community expresses in terms of its devotion to “good science”. However, the assertion merits closer, more logical, examination. If one seeks to minimize variation in any process, the approach to do so is through standardization. Standard methods, resulting from rigorous development and optimization and properly implemented, produce reproducible outcomes. Different methods that are not individually optimized to suppress variation and that are implemented without adequate control can only lead to highly variable results. However, routinely performed E&L operations, such as extraction and extract analysis, are rarely standardized across and between E&L laboratories and are generally not optimized and routinely assessed (via system suitability) to reduce or manage variation. At a high level, all practitioners employ GC/MS to address volatile and semivolatile organic substances. Furthermore, the methods are similar as it is logical that different laboratories would come to a similar solution to the same problem. However, the method operating details are not the same and it is reasonable to expect that this will lead to increased variation. The choice of IS is not the same from lab to lab and as we have seen previously, this surely will result in lab-to-lab variation in quantitative results. Although the screening methods are optimized for certain parameters, it is rare that reduction of variation is an optimization parameter that is intentionally addressed. Moreover, although most labs use system suitability testing to ensure methods are properly implemented at the time of use, it is rare that the system suitability tests include a consideration of response variation.
Lastly, this does not consider sources of variation that strictly speaking are not analytical in nature, such as variation in the generation and treatment of extracts and variation in laboratory operations (such as how and when the IS is added to the extract).
Although it is certainly unfair and inaccurate to suggest that there is complete chaos in terms of quantitation during screening, it is fair to say that variation is rarely properly addressed and controlled. It is thus proper to consider what can be done in the short term to do a better job and to maintain confidence in E&L results. It is clear what cannot be accomplished, which is the complete standardization of methods. The status quo, where every organization or researcher essentially can go their own way, means that in fact everybody has gone their own way and the cumulative penalty for having to switch from current methods to a new standardized method is too great. The cost (and the outcry) if every E&L testing lab were required to give up their invested intellectual property (experience and databases) and switch to a new method would be considerable. Moreover, there is some question as to which organization has the authority and ability to devise, optimize, and qualify the new standard method. Thus, it is naïve to think that full standardization will happen in the short term.
However, there is room for more strategic standardization. For example, what if it was required that everybody used RRF quantitation supported by a proper database? So doing would surely decrease lab to lab variation. Still too much of a stretch? Well, how about “everybody uses the same internal standard?” What about “everybody uses a standard system suitability test that includes a consideration of response variation?” What about “everybody agrees to use the same UF for AET adjustment and concentration estimate adjustment” (if the latter is even a good thing to do)? What about everyone agrees to a group of compounds that are not covered by a certain method because their response is simply too small by the method in question? Although not the best overall fix, surely the impact of these individual fixes combined would be a considerable reduction in quantitation variation, which would surely appease the naysayers who suggest, only partially in jest, that “I would get more reproducible screening quantitations if I threw darts at a dart board”.
This analysis of quantitation variation in screening is quite superficial and is not the in-depth, statistics- and quality-practice-based analysis that this topic requires and that would produce the best outcome of lowest possible variation. For example, although this manuscript utilizes the RSD as a relatively simple means of adjusting the AET, one could envision other statistical and mathematical functions that might address RF variation and its effect on the AET in a more rigorous manner. Nevertheless, this analysis suggests certain actions that, if taken, could reduce variation. It remains to be seen whether the industry will accept the challenge of changing the word “if” in the previous sentence to “when”, thereby acknowledging its responsibility to practice the best available science.
Conflict of Interest Declaration
The author declares that he has no competing or conflicting interests, noting his relationship with Nelson Labs, a provider of extractables and leachables testing and consulting services.
Acknowledgments
I would like to acknowledge the review and thoughtful comments provided by Piet Christiaens, Jean-Marie Beusen, Philippe Verlinde, and Jan Baeten of Nelson Labs. Furthermore, I thank Nelson Labs for its willingness to share its internal database for the purpose of elevating the level of good science practiced by dedicated analytical scientists the world over for the benefit of patients and users of pharmaceutical products. I gratefully acknowledge the shared insights, opinions, practices, and concerns of colleagues, too numerous to name here, that supported the conviction that the points raised in this paper are relevant, timely, impactful, appropriate, and necessary.
- © PDA, Inc. 2020


