
Abstract
Single-use systems find increasing application downstream of final filters in the production of antibody, vaccine, gene, and cell therapy drug products. For such critical applications, particulate matter attached to the interior (product-contacting) surfaces of the single-use system could potentially be released and contaminate the drug product. Risk reduction requires methods that reliably detect particulate matter on the inside of single-use systems. Here we describe the results from the development and validation of a manual visual inspection method for the detection of particulate matter inside transparent single-use systems. Test kits consisted of single-use systems (2 D bags, tubing lines, and bag/tubing assemblies) internally seeded with test particles (black, clear, or fiber) ranging from 100 to 2000 µm in size. A designed experiment determined the optimal light intensity, inspection time, and time between inspector breaks required to maximize the probability of detection (POD) for particles. POD > 70% for black and clear particles started at particle sizes exceeding 400 to 1000 µm depending on the single-use system type and size, but the POD for 2000 µm fibers was marginal to poor. Thus, for single-use systems, the particle size to achieve POD > 70% shifted to significantly larger sizes than the 150–250 µm particle size typically detectable in drug products. Overall, the POD decreased as the bag size or tubing line length increased. An attribute gage repeatability and reproducibility study using three inspectors validated the inspection method for reliable detection of black and clear particles ≥ 1000 µm in size over the entire size range of single-use assemblies and tubing lines examined. Fibers of length 1000 and 2000 µm were not reliably detected. The results highlighted the challenges in reliably detecting particulate matter in a visual inspection of the interior surfaces of single-use systems.
- Single-use systems
- Visual inspection
- Particulate matter
- Probability of detection
- Method development
- Method validation
Motivation
The visual inspection of drug products for the presence of particulate matter is challenging and complex; however, the pioneering work of Knapp (1) provided a solid scientific and statistical basis for the development of robust inspection procedures. Recently, the compendial standard USP <790> (2) gave a statistical basis to the concept of “essentially free” of particulate matter found in previous compendial standards, and USP <1790> (3) provided significant guidance on how to develop visual inspection methods for particulate matter in parenteral drug products. Although these standards were specifically written for final drug products, the development of visual inspection methods for materials used upstream of the drug product, such as final containers and processing equipment, also benefit from the application of similar principles.
Single-use systems (SUSs) find increasing use in the manufacturing of biopharmaceuticals. SUSs are configurations of biopharmaceutical process equipment primarily composed of plastic materials, which provide advantages in manufacturing flexibility but also present new challenges compared with multiuse stainless-steel equipment. Typically, multiuse stainless-steel equipment is cleaned by the biopharmaceutical manufacturer before use, whereas SUSs arrive at the biopharmaceutical manufacturer sealed and sterilized and are not typically cleaned or rinsed before implementation. Consequently, for processes based upon SUSs, the cleanliness with respect to particulate matter is “outsourced” to the SUS manufacturer.
Certainly, in the application of SUSs downstream of the last filtration step in a biopharmaceutical manufacturing process (e.g., final filling of antibodies and some vaccine and cell therapy production processes), there is significant risk that particulate matter attached to the interior fluid-contacting surfaces of the SUS could detach and end up in the final drug product. Particulate matter present in SUSs applied upstream of sterile filters represent a much lower risk scenario, because particles >0.2 µm are filtered out of the process fluid, as highlighted in recent guidelines (4).
After a multiuse stainless-steel system is cleaned, a visual inspection of the interior surfaces is not always feasible, so a total organic content analysis is often used to test for interior surface cleanliness. On the other hand, the primary components in most SUSs, bioprocess bags and tubing lines, often have some level of transparency, which allows visualization of the interior fluid-contacting surfaces. Typically, the SUS manufacturer visually inspects a SUS before shipping, and the biopharmaceutical manufacturer visually inspects a SUS before implementation.
Because particulate matter in transparent final drug products is often detected in a manual visual inspection with a high probability starting at around 100–150 µm in particle size (3), often the expectation is that similar particle sizes should be detectable in a visual inspection of the interior surfaces of SUSs. To test this hypothesis, in the method development and validation study presented here, we investigated the impact of SUS parameters and visual inspection parameters on the probability of detection of particulate matter in SUSs. Test kits were created by carefully inserting particles of different types and sizes into the interior of single-use bioprocess bags, tubing lines, and assemblies (bag plus a tubing line). Thus, the test particles were potentially mobile particles, not embedded in or firmly attached to the SUS surfaces. Conforming (without test particle) and nonconforming (with test particle) bags and tubing lines were manually inspected using a conventional SUS inspection set up: illumination via light table (white light illumination from below) and detection via the unaided human eyes of trained and qualified inspectors.
The work described here was divided into two separate investigations: method development and method validation. For the method development investigation, the emphasis was on the process, and the visual inspection parameters studied were illumination intensity, inspection timing, and time between inspector breaks in a design of experiments (DOE) approach. In order to fully test these parameters, a realistic range of test articles was created, varying particle size (100–2000 µm), particle type (black, clear, and fiber), SUS bag size (50 mL to 50 L), and SUS tubing line length (1–4 m). Inspections were carried out by a single experienced inspector. Determination of optimal inspection process conditions was the primary goal, with the secondary goal of finding overall trends in particle detection as a function of particle size, SUS size, and SUS type.
The optimal visual inspection parameters found in the method development investigation were applied in a method validation investigation to validate the visual inspection inspectors and process. A test kit containing tubing lines and SUS assemblies was inspected by three well-trained inspectors. An attribute gage repeatability and reproducibility (R&R) study approach validated the repeatability and reproducibility of the particle detectability in this manual visual inspection process.
Materials and Methods
In order to evaluate particle detectability within SUS, two test kits were carefully prepared by inserting black, clear and fiberous particles of known size into SUS bags, tubing lines and assemblies. The first test kit was applied in a method development study, a design of experiments to determine optimal visual inspection conditions. The second test kit was applied in the valdiation of the visual inspection method.
Preparation of Test Kits
Three categories of test particles were created: black, clear, and fiber. Black (opaque) test particles were created by knife abrasion of black cable ties (polyamide), a material of construction for SUSs (cable ties often secure connections in SUS assemblies). Clear (transparent) test particles were created by knife abrasion of SUS film material (ethylene vinyl acetate polymer, a material of construction for SUS bioprocessing bags), or by cutting silicone tubing with a scissors. Fiber (dark colored) test particles were collected by extracting textiles with water and subsequently filtering the extract onto membrane filters. Textile fibers are often found in single-use bags (5). The test particles were classified under a microscope according to the largest dimension of the particle (maximum diameter for the irregular shaped black and clear particles, or length of the fiber). The particles were sorted into six size classes (100, 200, 300, 500, 1000, and 2000 µm) for each of the three particle types (black, clear, and fiber).
For this study, the SUS bags tested were Sartorius Flexboy 2 D bioprocess bags made with ethylene vinyl acetate film, and the tubing lines tested were composed of silicone tubing. For creation of the test kits, the chosen bag, tubing line, or assembly (bag plus a tubing line) was first carefully inspected for the absence of visible particles. The test kits were created in an ISO 7 controlled environment. Particles were transported into the SUS components using a long pipette, which allowed careful transfer and localization of the test particles into the interior of the tubing lines and bags (bags were slightly inflated to facilitate particle placement).
Method Development
The test kit used for the development of the method consisted of test particles inserted into bags of three different volumes (single-side surface areas): 0.05 L (71 cm2), 5 L (961 cm2), and 50 L (4053 cm2). In addition, test particles were inserted into tubing lines with two different total tubing lengths (1050 mm and 4100 mm).
Because of the significant visualization and manipulation challenges in the creation of test articles with 100 µm long fibers, this type/size of particle was removed from the test kit design. To create the test kit, 17 particles (six sizes of black, six sizes of clear, and five sizes of fiber) were inserted into the five different sizes of bags and tubing lines noted previously to create 85 unique test articles. These 85 test articles were replicated once to create a total of 170 test articles, each containing a particle. These 170 noncompliant test articles were matched with 170 compliant test articles (without a particle), to create a test kit consisting of a total of 340 test articles (204 bags and 136 tubing lines).
In the manual visual inspection of the development test kit, controlled illumination was provided by a light table. The bags were first held perpendicular to the light table (light perpendicular to inspector eyes) and inspected relative to a gray background, and then further inspected by laying the bag on the light table (transmitted light). The tubing lines were laid directly onto the light table and inspected in transmitted light. Particle detection occurred via the unaided eyes of a trained and qualified inspector with many years of inspection experience.
An experimental design was carried out to determine the optimal inspection conditions. Light intensity (Lux) was varied from 800 to 1900 to 3000 lx. These light levels were somewhat lower than required by USP < 790> (minimum 2000–3750 lx) (2) because the SUS inspection occurs both in parallel (in transmission) and perpendicular to the light source. In addition, the inspection time was varied from 10 to 35 to 60 s, and the total continuous inspection time (time until break) was varied from 1 to 2 to 3 h. The entire test kit was inspected 11 times according to the experimental design shown in Table I.
Design of Experiments Applied to the Method Development Test Kit
Method Validation
Based on the poor particle detectability for small particles and fibers found in the method development investigation (see the Results section following), the smallest black and clear particles (100 and 200 µm) along with the shortest fibers (300 and 500 µm) were removed from the method validation investigation. The set of test particles thus consisted of a total of 10 particle types/sizes: four sizes of black or clear particles (300, 500, 1000, and 2000 µm), and two sizes of fibers (1000 and 2000 µm).
For method validation, the set of SUSs consisted of four lengths of tubing line (750, 1600, 3800, and 5250 mm) and six different single-use assemblies for a total of 10 different types/sizes of SUSs. The single-use assemblies consisted of a single bag (0.05, 0.25, 5, 10, 20, and 50 L) with an attached tubing line 650–3500 mm long.
Test articles containing particles were created by inserting nine of the test particle types/sizes (without the 300 µm clear particle) into 750 mm tubing lines, nine of the test particle types/sizes (without the 300 µm black particle) into 1600 mm tubing lines, and nine of the test particle types/sizes (without the 300 µm clear particle) into the largest single-use assemblies (50 L bag plus tubing line), for a total of 27 unique test articles. The full set of 10 test particle types/sizes were inserted into the remaining tubing lines (3800 and 5250 mm) and single-use assemblies (0.05, 0.25, 5, 10, and 20 L bags with attached tubing line) to create an additional 70 unique test articles. Thus, a total of 97 nonconforming test articles, each containing a particle, were created.
The complimentary 173 compliant test articles (without a particle) consisted of the full set of the 10 different SUS types/sizes noted previously, with on average ∼17 replicates of each type/size. These 173 test articles were matched with the 97 noncompliant test articles to create a test kit consisting of a total of 270 test articles (108 tubing lines and 162 assemblies).
In the manual visual inspection of the validation test kit, the optimized conditions found in the development investigation (see Results following) were applied: 1900 Lux illumination, 35 s inspection time, and 2 h inspection until break. As in the method development, visual inspection was done with the light perpendicular to the inspector, along with transmitted light. The validation investigation was carried out by three trained and qualified inspectors with between 5 and 28 years of inspection experience. The inspectors were not informed of the nature of the investigation to minimize bias. In total, the test kit was inspected three times by each inspector with a randomized presentation of the test articles for each inspection run. The inspection runs were spaced over a 9-day period.
For the analysis of an analytical method based upon an attribute (a subjective rating based upon human judgment), the measurement system analysis tool typically applied is an attribute gage R&R analysis. The visual inspection process for particles in a SUS requires an inspector to make a judgment on whether a SUS is conforming (no particle) or nonconforming (a particle is detected). A reliable visual inspection process will not only have a particle probability of detection (POD) >70% (1) but also high repeatability (an inspector achieves the same result for multiple inspections of the same SUS) and high reproducibility (multiple inspectors achieve the same result for an inspection of the same SUS). We applied Minitab software for a statistical analysis of the results of the method validation investigation. The analysis determined the percent accuracy relative to the standard for nonconforming SUSs (the probability that the inspector detected a particle), repeatability and reproducibility of the inspection method among the three inspectors, along with determination of misclassifications (conforming found nonconforming).
Results and Discussion
The results from the method development study determined the optimal inspection condtions, and the results from the method validation study determined the lower limits of particle type and particle size for which particles are reproducibly detected within the interior surfaces of the set of SUSs examined here. Both studies determined the trends in particle detectability as a function of particle type, particle size, and type of SUS.
Method Development
From a statistical analysis of the DOE, the optimal conditions were found at 1900 lx illumination, 35 or 60 s inspection time, and a maximum 2 h continuous inspection until break. The statistical analysis clearly indicated that inspection time was by far the most significant factor within the design experiment parameters studied, with significantly poorer particle detection found when the inspection time was 10 s.
The method development test kit consisted of two replicate test articles for each possible combination of SUS component type/size, test particle type, and test particle size. For the entire test kit, over the 11 inspection runs of the experimental design, the average POD for all particle types/sizes was 48%. To illustrate the overall trends, POD results for all SUS component sizes in the test kit were binned to calculate an average POD, which is plotted versus particle type and particle size in Figures 1 and 2. Inversely, POD results for all particle types and sizes were binned to calculate an average POD, which is tabulated versus SUS component size in Table II.

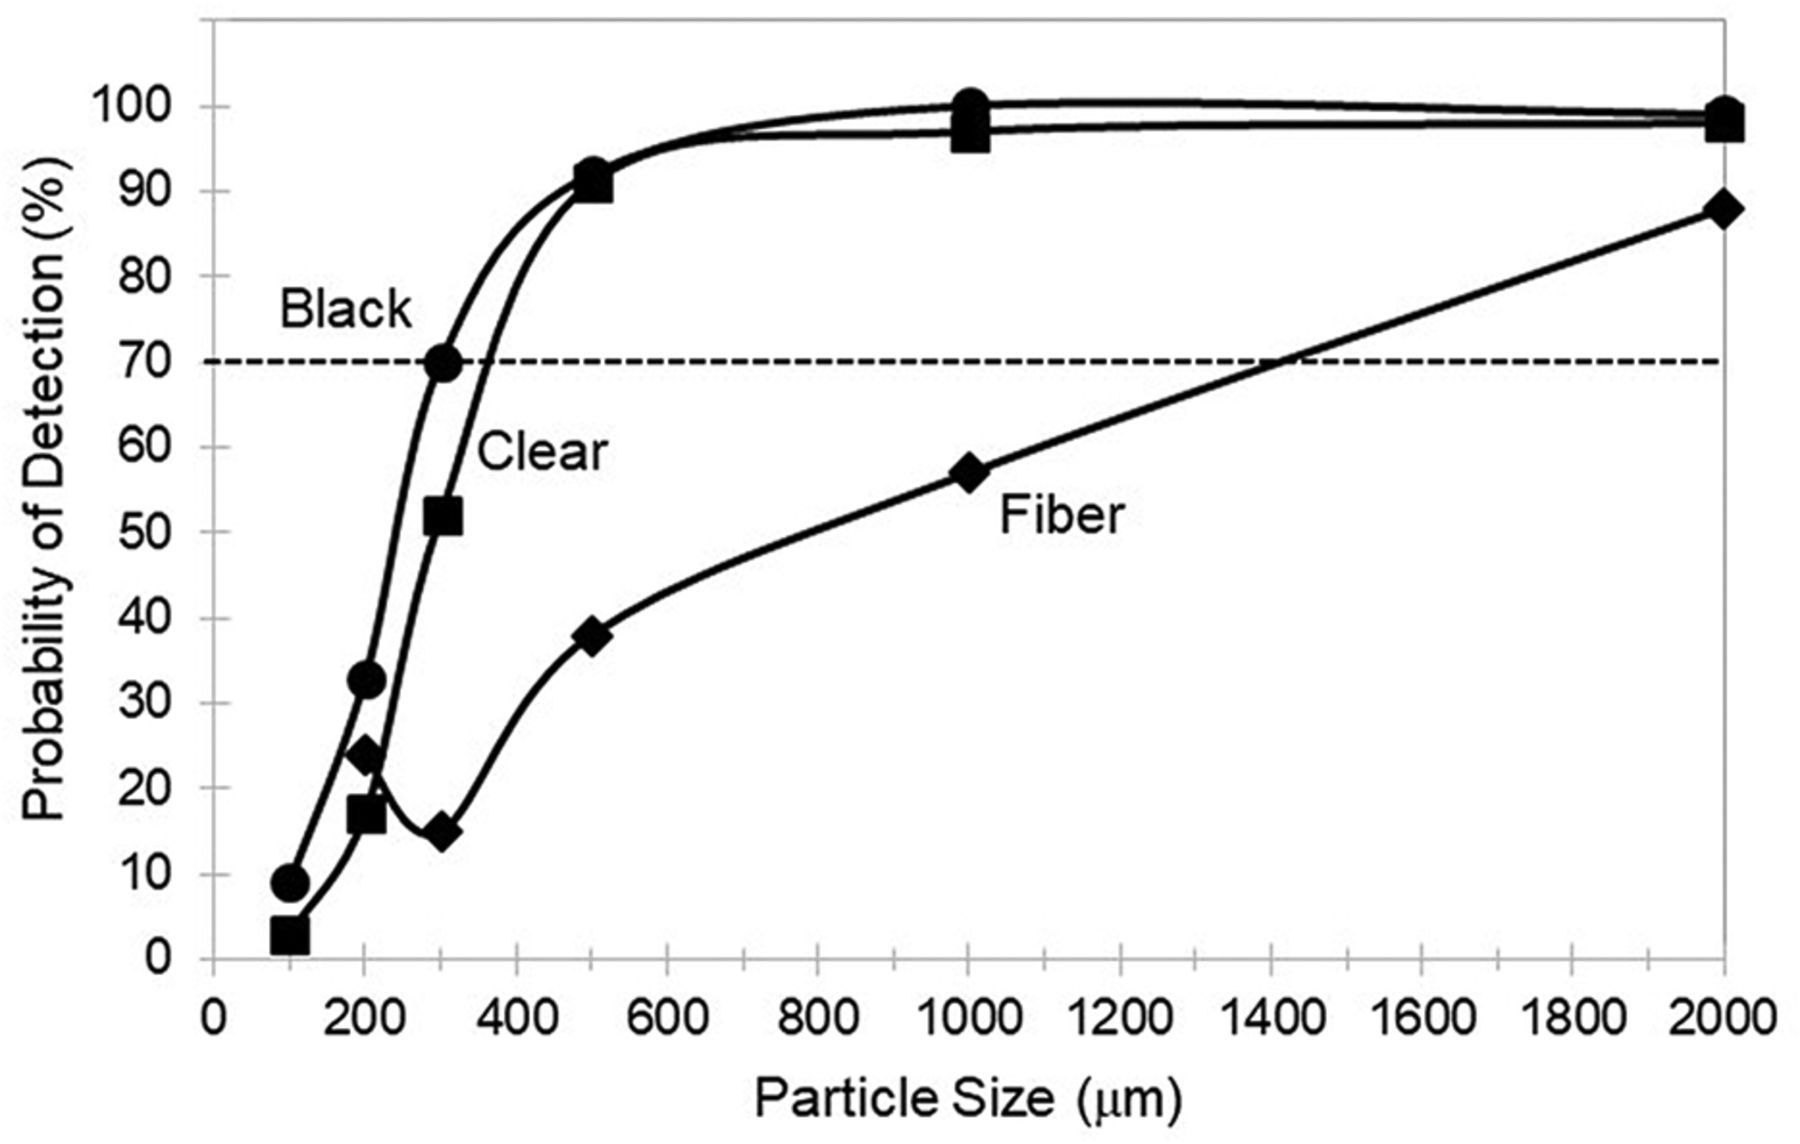
Average probability of detection of a particle (black, clear, and fiber) as a function of particle size for all sizes of single-use bags (development test kit).

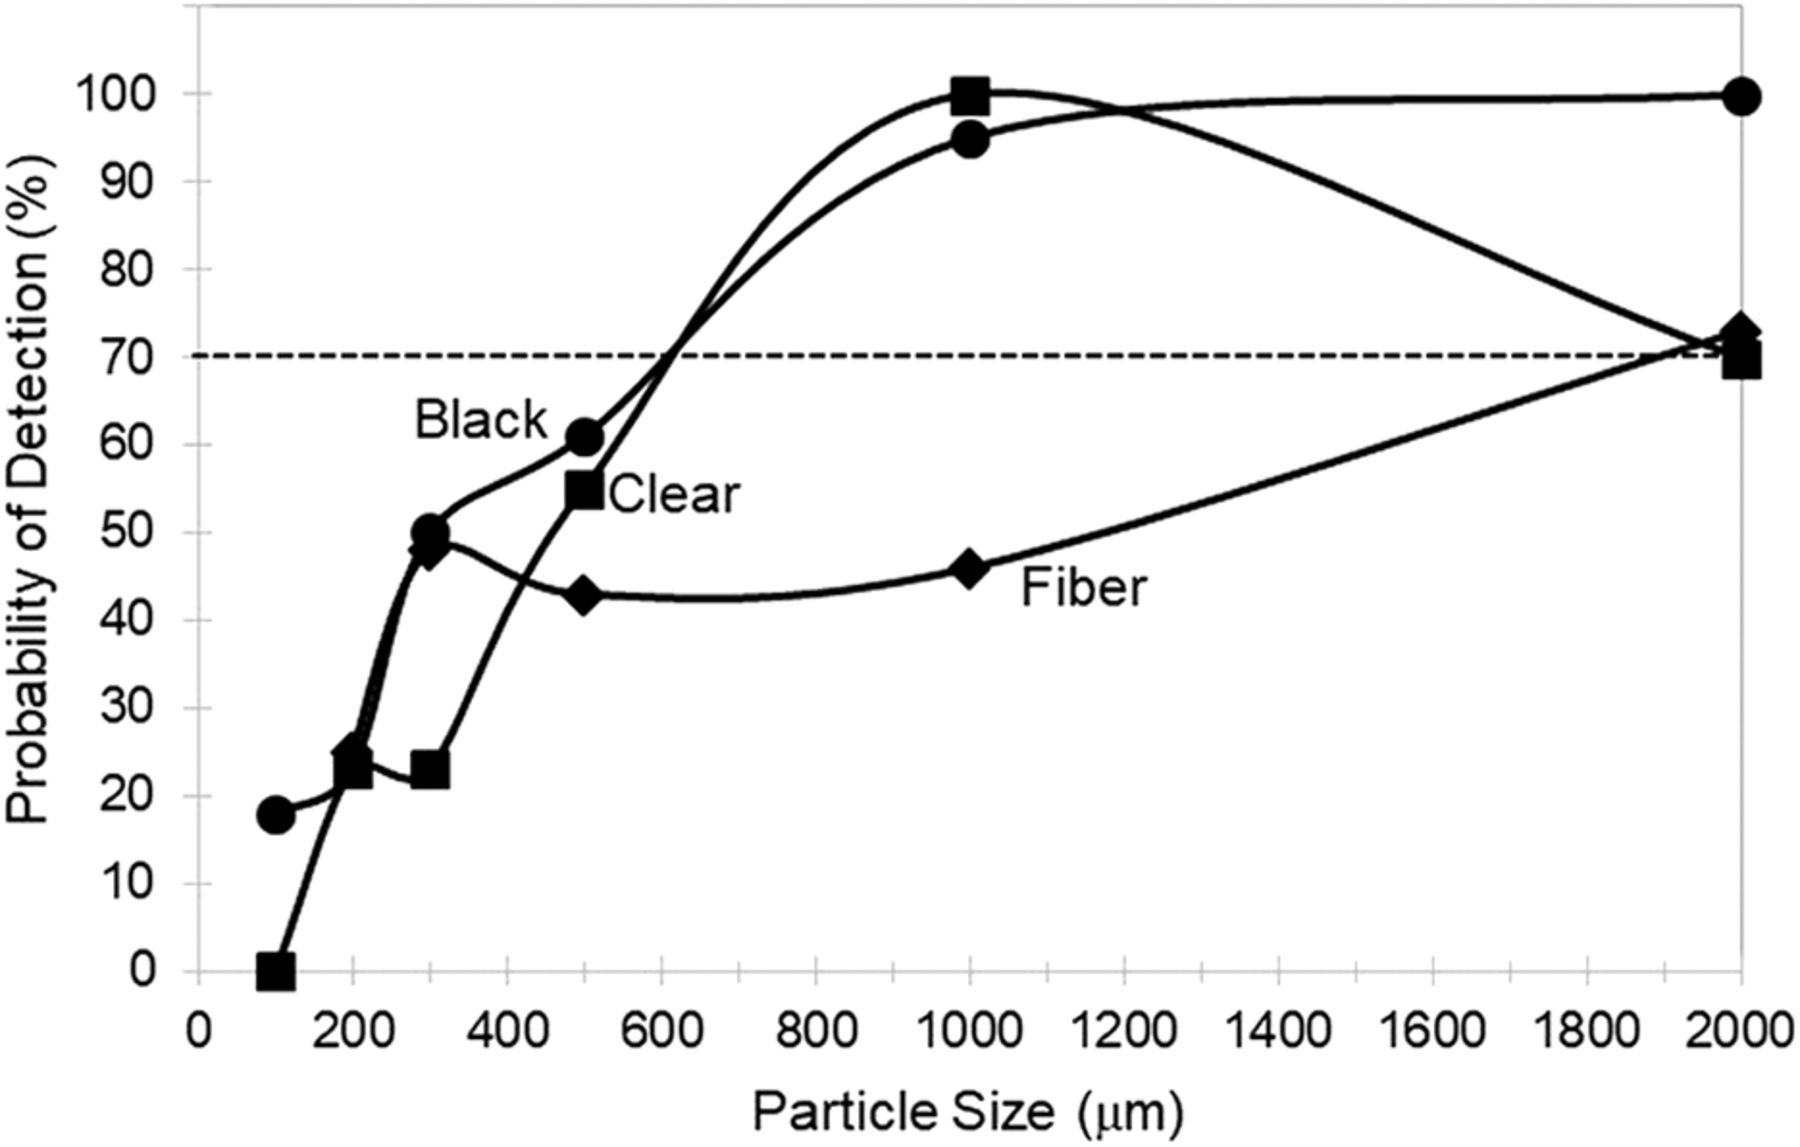
Average probability of detection of a particle (black, clear, and fiber) as a function of particle size for all lengths of tubing lines (development test kit).
Average Probability of Detection for All Types and Sizes of Particles (Black, Clear, and Fiber) as a Function of SUS Component Size (Development Test Kit)
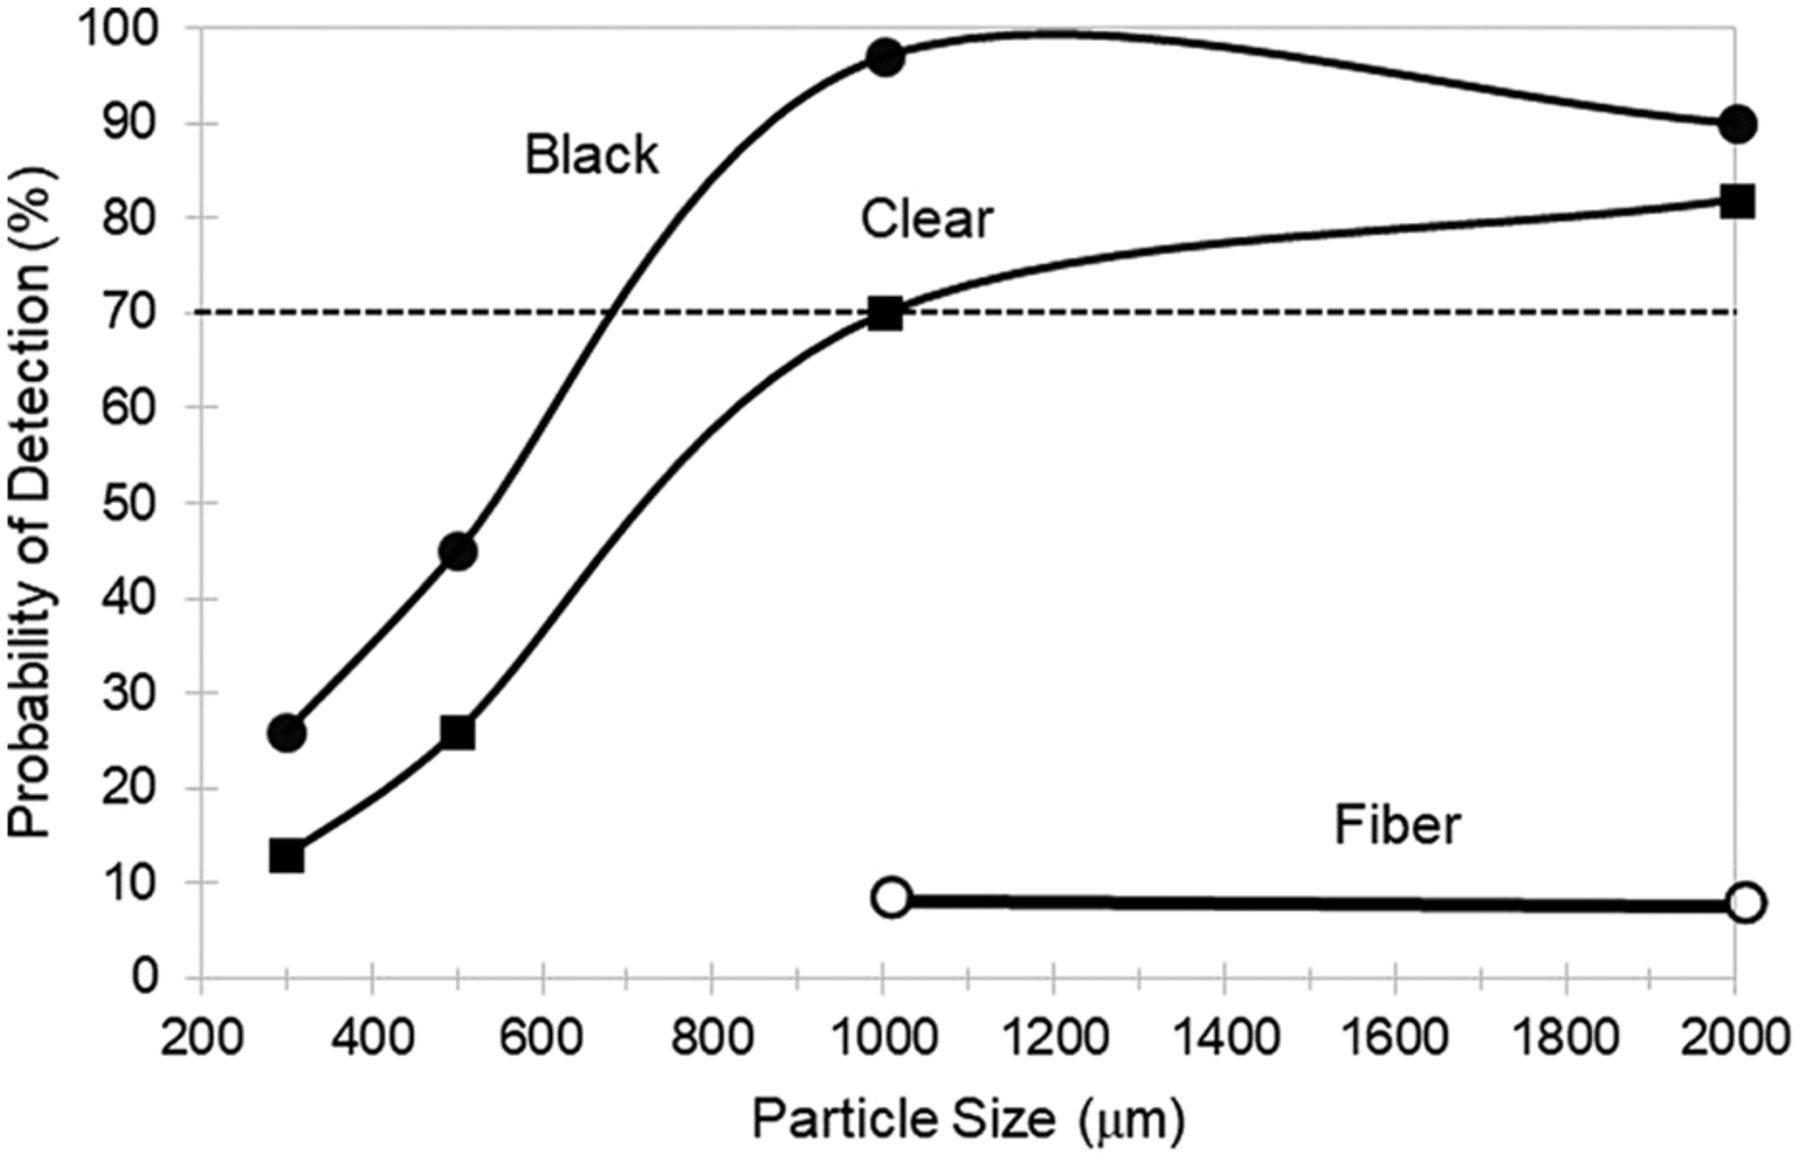
The average POD for all three bag sizes in the test kit are shown in Figure 1 as a function of particle size and particle type (black, clear, and fiber). Generally, a POD > 70% is required for adequate detectability in a visual inspection process (1). In bags, POD > 70% for black and clear particles starts at ∼400 µm in size; however, POD > 70% for fibers first starts at a fiber length of ∼1500 µm.
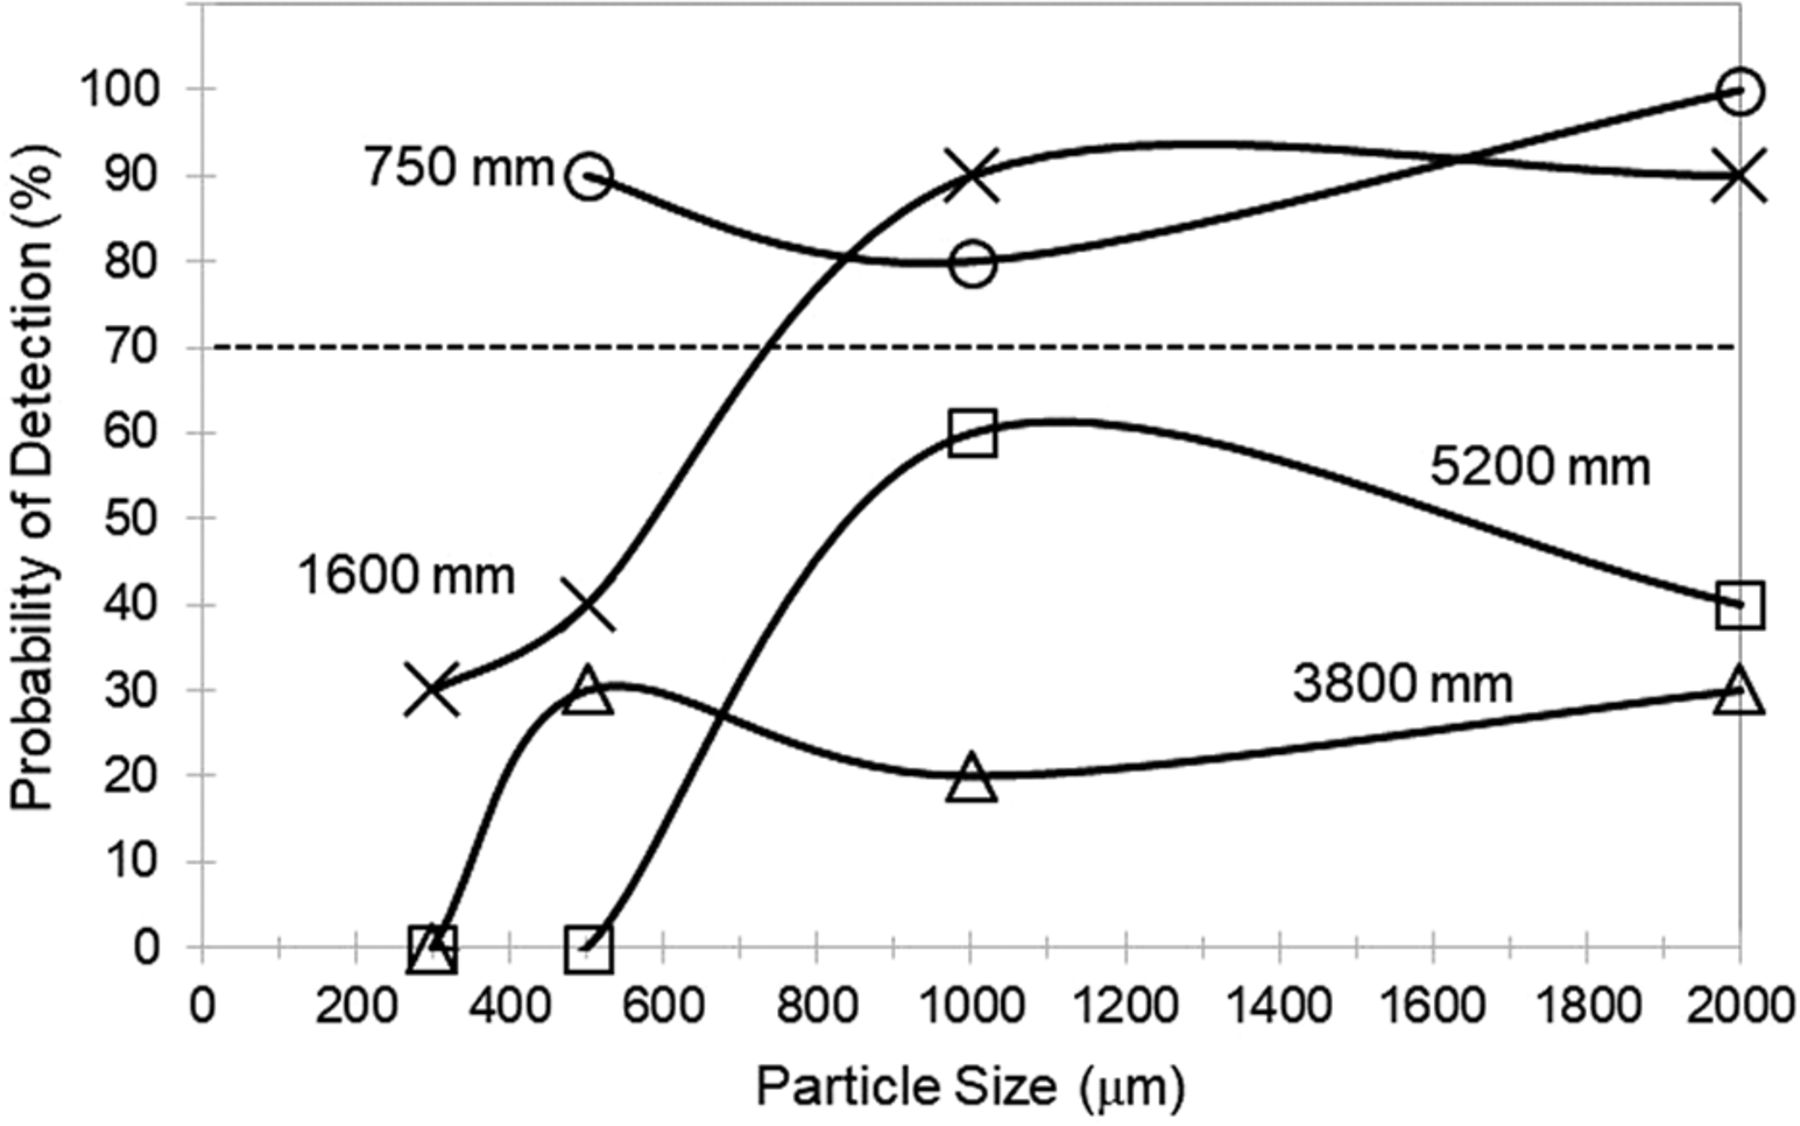
The average POD for both tubing line lengths in the test kit are shown as a function of particle size and particle type (black, clear, and fiber) in Figure 2. For tubing lines, a POD > 70% first occurs at substantially larger particle sizes than that found for bags. In tubing lines, POD > 70% for black and clear particles starts at ∼700 µm in size, and POD > 70% for fibers first starts at ∼2000 µm in size.
The general observation that POD increases with increasing particle size (Figures 1 and 2) is a result expected when developing a visual inspection method (1). Also expected was that the black and clear particles exhibited higher POD than equivalent size (length) fibers. The textile fiber test particles were of high aspect ratio and thus exhibited a smaller cross-section and less detectability than the lower aspect ratio black and clear test particles.
POD > 70% for black and clear particles in bags started at ∼400 µm but in tubing lines started at ∼700 µm. Thus, the particle sizes reliably detected inside SUSs were significantly larger than the 150–250 µm size range typically detected with POD > 70% in drug products (3). To the eye, the silicone tubing appears qualitatively less transparent than the bag film material, perhaps because of material thickness and haze or because of light reflection in cylindrical tubing. Note that because the three bag sizes studied were composed of two relatively small bags (0.05 L and 5 L) and only one large bag (50 L), the average POD for all bags as shown in Figure 1 and discussed previously was biased toward smaller size bags.
Table II tabulates the average POD for all particle types and sizes as a function of bag surface area and tubing line length. The average POD decreased as bag size (surface area) was increased, and strongly decreased as tubing line length was increased. The average PODs tabulated in Table II were low overall because this POD average included data for the POD data for small particles and for fibers. In summary, as the size of the SUS component increased, the particle detectability decreased in a manual visual inspection under fixed conditions.
Method Validation
The types and sizes of SUSs in the validation test kit differed from those in the development test kit. The validation kit contained four lengths of tubing lines (750–5200 mm) covering a broader range of tubing line length compared with the two lengths of tubing line (1050 and 4100 mm) in the development test kit. In addition, the validation test kit contained SUS assemblies (bag plus a tubing line) that were larger and more complex than the simpler SUS bags contained in the development kit.
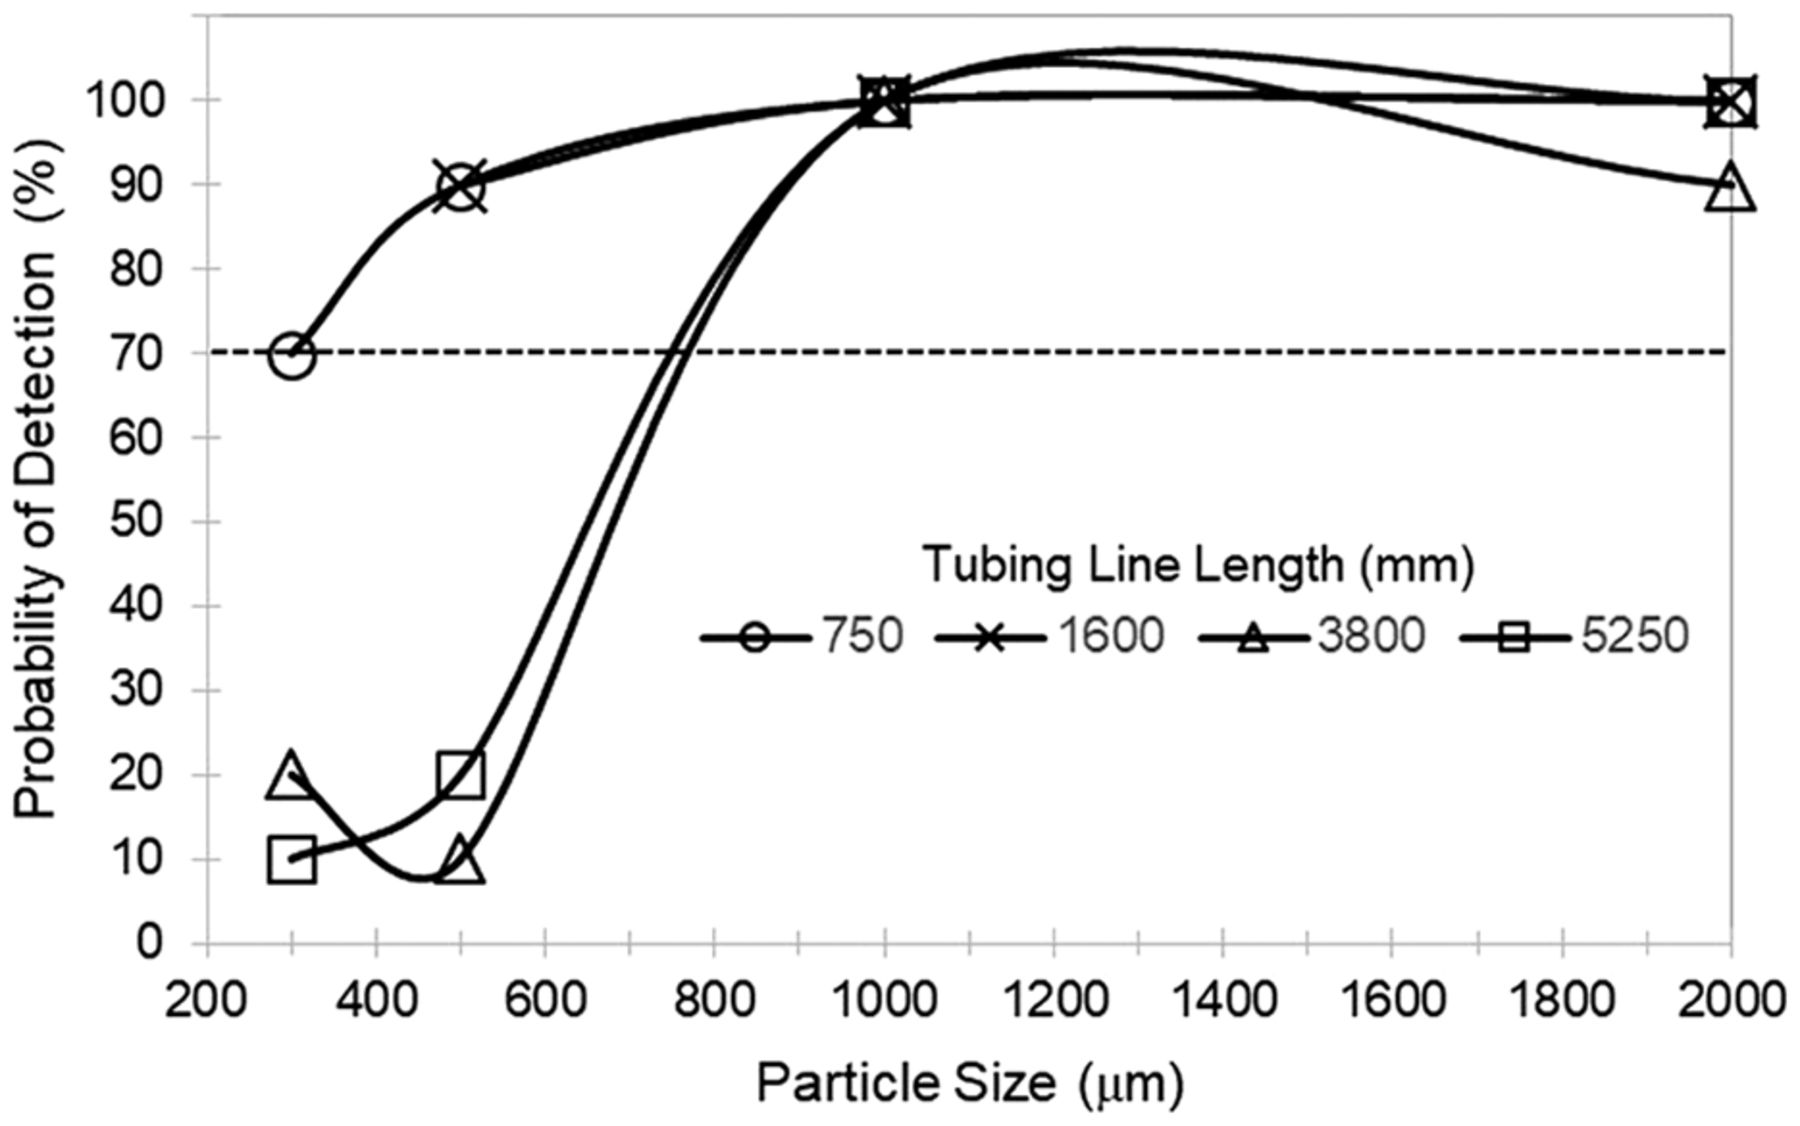
The POD results for tubing lines showed systematic trends as shown in Figures 3 and 4. For the shortest tubing line (750 mm), POD > 70% for black and clear particles started at ∼500 µm in particle size. However, as the tubing line was increased to 1600 mm long, the POD > 70% remained at 500 µm for black particles but shifted up to ∼800 µm for clear particles. For the longest tubing lines (3800 and 5200 mm), the POD > 70% for black particles shifted up to ∼800 µm, and clear particles showed poor POD (<70%) up to and including 2000 µm in size. Not shown in Figures 3 and 4: for all lengths of tubing line, fibers of 1000 µm and 2000 µm length were poorly detectable (POD ranged from 0 to 60%). In summary, as the length of the tubing line increased, the particle detectability (black > clear ≫ fiber) systematically decreased.

Probability of detection of a black particle as a function of particle size for tubing lines of varying length (validation test kit).

Probability of detection of a clear particle as a function of particle size for tubing lines of varying length (validation test kit).
The validation test kit for assemblies contained only a fraction of all the possible combinations of bag size, tubing line length, particle type, and particle size. Thus, the average POD binned over all sizes of assemblies is reported in Figure 5 as a function of particle type and size. POD > 70% for black particles started at ∼700 µm, and for clear particles started at ∼1100 µm. Fibers up to and including 2000 µm long remained poorly detectable. Upon comparison with the results for bags alone, addition of a tubing line shifted the POD > 70% for black and clear particles up to significantly larger particle sizes (compare Figures 1 and 5).

Average probability of detection of a particle (black, clear, and fiber) as a function of particle size for all sizes of single-use assemblies (bag plus a tubing line) (validation test kit).
The inspection results from the validation test kit using three inspectors were analyzed using an attribute gage R&R statistical analysis. The analysis yielded the repeatability for each inspector and the reproducibility relative to the standard for the three inspectors. The gage R&R indicated no statistically significant differences within the results for the various sizes of assemblies and tubing lines, so the results for all SUSs were binned.
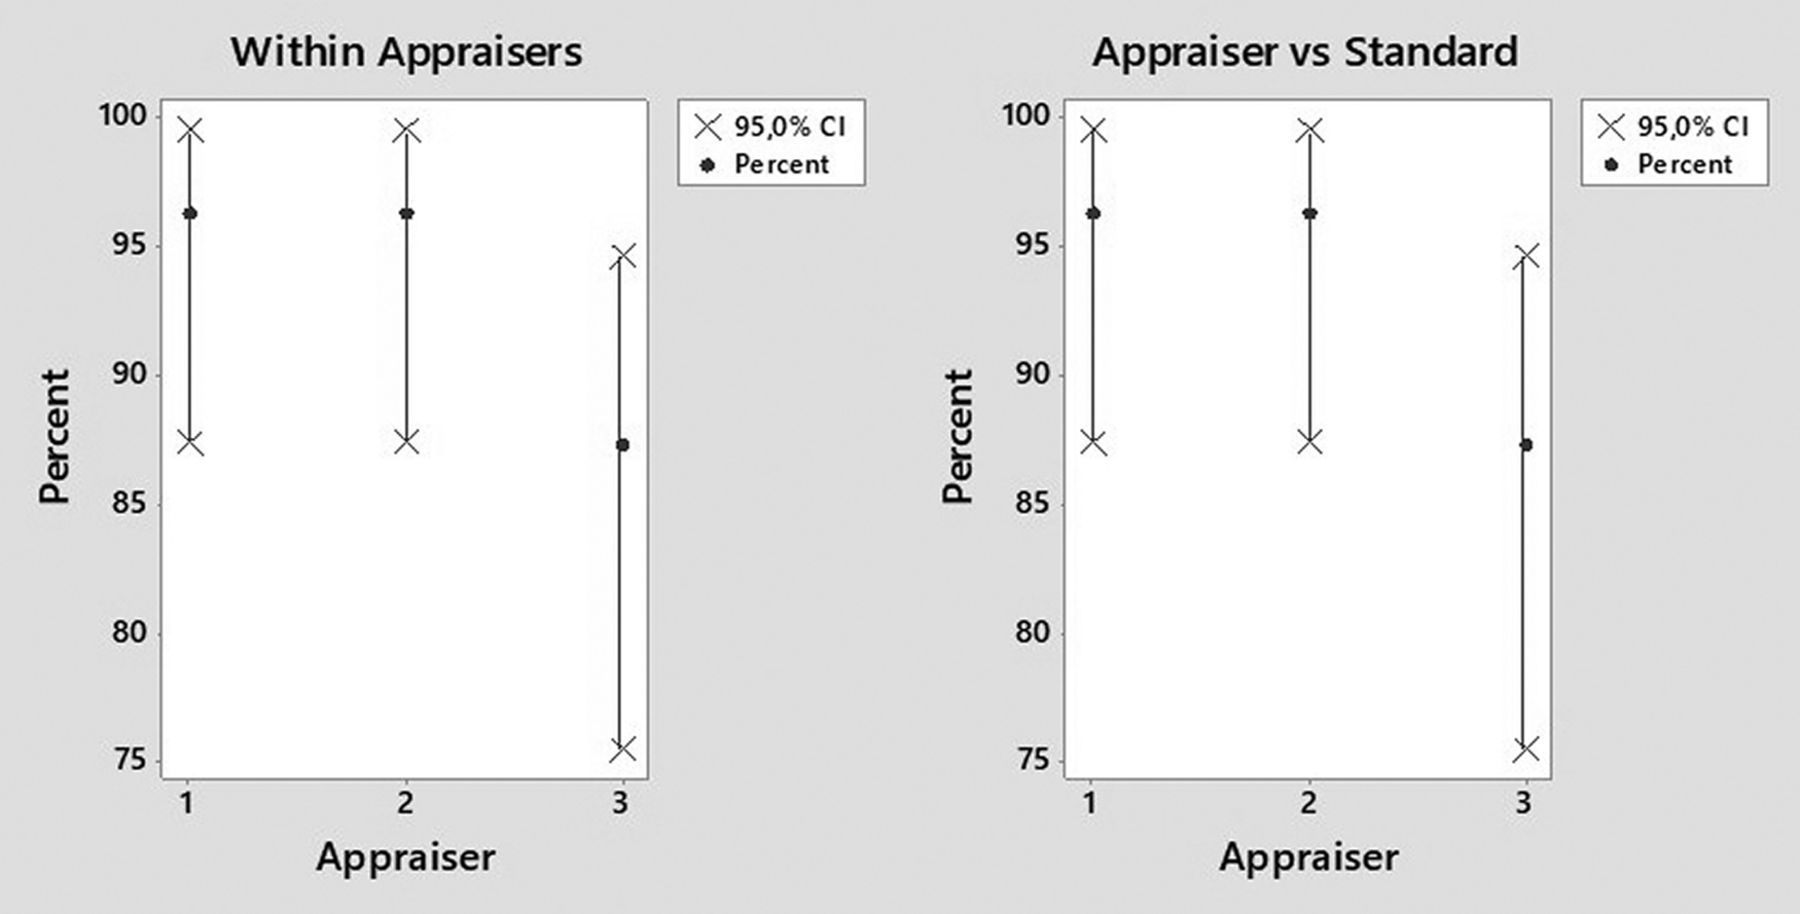
For all SUS types/sizes and all particle types/sizes, the inspection method was repeatable, yielded a 100% accuracy relative to the standard for the detection of conforming SUSs, but only yielded a 50% accuracy relative to the standard for the detection of nonconforming SUSs. A more detailed analysis as a function of particle type/size is summarized in Table III. The visual inspection method for small black and clear particles (300 and 500 µm) or for fibers (1000 and 2000 µm) in SUSs yielded only 11%–50% accuracy relative to the standard for the detection of nonconforming SUSs. However, inspection for black and clear particles of 1000 and 2000 µm size yielded >70% accuracy relative to the standard. Figures 6 and 7 show the repeatability and reproducibility for detection of 1000 and 2000 µm black and clear particles in SUSs. In summary, the gage R&R analysis validated the visual inspection method only for black and clear particles ≥ 1000 µm in size.

Repeatability (left) and reproducibility (right) for three inspectors in the visual inspection of single-use systems for the presence of 1000 and 2000 µm black particles.

Repeatability (left) and reproducibility (right) for three inspectors in the visual inspection of single-use systems for the presence of 1000 and 2000 µm clear particles.
Results from an Attribute Gage Repeatability and Reproducibility Analysis Validating the Performance of the Visual Inspection Method for Black and Clear Particles ≥ 1000 μm in Size
Conclusions
The results of the method development and validation studies described here clearly highlight the challenges associated with the visual inspection for particulate matter on the inside surfaces of SUSs. For all the sizes of single-use assemblies and tubing lines studied here, manual inspection under white light illumination with qualified inspectors was validated only for the detection of black and clear particles ≥ 1000 µm. Black and clear particles < 1000 µm and fibers up to and including 2000 µm long exhibited limited detectability.
It is important to note that this study only focused on the two primary components in single-use systems that often exhibit significant transparency: bioprocess bags and tubing lines. Other components often present in SUSs such as bag/tubing connectors, sterile connectors, and filters are often opaque, and the interior fluid-contacting surfaces are not easily inspected. In addition, many single-use assemblies applied in biopharmaceutical processes are often greater in size and complexity than the bag/tubing line assemblies studied here.
This study showed the significant limitations of manual visual inspection for detection of particles on the interior surfaces of SUSs. In critical applications of SUSs downstream of final filters, particles may detach from the product-contacting surfaces of the SUS and end up in the final drug product. For such SUS applications, clearly manual visual inspection is not entirely sufficient for measurement and control of particle levels in SUSs.
Consequently, the Bio-Process Systems Alliance recommends destructive testing of a sampling of SUSs during development and manufacturing (4). Although SUS manufacturers often rinse the interior surfaces of SUSs and analyze the extract with light obscuration methods, it is important to note that light obscuration does not reliably detect particles in the visible (≥100 µm) size range (4). On the other hand, collecting the particles on a filter membrane and analysis by light microscopy does allow counting and sizing of particles in the visible size range and also facilitates further analysis by chemical and physical identification methods (6).
Conflict of Interest Declaration
The authors declare that they have no competing interests.
Acknowledgements
The authors thank Oumrath Ahmed for carrying out visual inspections.
- © PDA, Inc. 2021


