
Abstract
The assessment of substances that can be extracted (extractables) or leached (leachables) from the materials that come in contact with pharmaceutical products often starts with a general screening of these substances in relevant samples. Although such screening studies may be of a qualitative and semi-quantitative nature, the data they generate are critical in ensuring the suitability of the system(s) used to manufacture, store, and/or administer the product. As such, it is important they are designed using appropriate analytical techniques and methodologies so that representative and reproducible data are obtained. The goal of this commentary is to provide insight into several, but by no means all, good practices for the preparation and analysis of samples in extractable and/or leachable screening studies in order to help ensure representative and reproducible results are ultimately obtained. The specific topics covered are extraction stoichiometry, the importance of verifying method performance, assessing the need for incorporating derivatization in gas chromatography-based analyses, and properly accounting for analytical uncertainty when calculating the analytical evaluation threshold.
1. Introduction
The assessment of substances that can be extracted (extractables) from the various systems used to manufacture, store, and/or administer pharmaceutical products and substances that leach (leachables) from these systems and into the product or its precursor solution(s) during its manufacture, storage, and/or administration often starts with a general screening of these substances in relevant samples. The purpose of this screening is to provide an initial profile of extractable and/or leachable substances from these systems and/or the product, respectively, that can be leveraged to determine the suitability of the system(s) for use with the product to aid in the selection of suitable systems and/or to support the design of subsequent extractable/leachable (E/L) studies.
Unlike targeted analyses, which are developed and validated to meet specific standards (USP (1) or ICH (2), for example), E/L screening methods are not standardized or controlled. This is primarily due to the investigational nature of the work, which requires a degree of flexibility, as well as the evolving nature of the E/L field, which is still not sufficiently harmonized to employ such standards. As a result, most E/L-related directives provide general strategic goals that need to be achieved (that is, packaging components should be constructed of materials that will not leach harmful or undesirable amounts of substances to which a patient will be exposed when being treated with the drug product (3); drug product containers shall not be reactive, additive, or absorptive so as to alter the safety, identity, strength of the product (4)) without providing the specific tactical approaches to achieve these goals. As a consequence, screening methods are developed and implemented on a lab by lab basis using the individual expertise and philosophies of the scientists at each organization.
Although screening studies may be of a qualitative and semiquantitative nature, the data they generate are critical in ensuring that adequate materials are used in the construction of pharmaceutical packaging/delivery systems, systems going into early phase clinical trials are safe for participants in those trials, and/or final drug products are being adequately characterized for substances leached from the system. It is an unfortunate reality, however, that an E/L screening study at multiple labs will, more often than not, yield datasets that are unaligned to at least some degree. Experience suggests that these differences can be attributed to at least four factors: how material samples are extracted (when performing an extractables assessment), how samples are prepared for analysis, the analytical method used for the analysis, and how the data are evaluated.
The goal of this commentary is to provide insight into several, but by no means all, good practices for the preparation and analysis of samples in extractable and/or leachable screening studies to better ensure that representative and reproducible results are ultimately obtained, regardless of the lab generating them. The specific topics to be discussed are extraction stoichiometry, assessing the need for incorporating derivatization in gas chromatography (GC)–based analyses, the importance of verifying method performance, and properly accounting for analytical uncertainty when calculating the analytical evaluation threshold (AET). In each section of this commentary, a discussion of the topic, recommendations associated with the topic's application to screening studies, and potential pitfalls are discussed. To support each topic, data previously published are referenced and/or the results obtained for any data generated for the purposes of this work are presented.
2. Realizing the Impact of Extraction Stoichiometry
In extraction studies, materials are extracted with various media, such as water, water/organic solvent mixtures, or 100% organic solvents, and the extraction is facilitated by various techniques, such as incubation, reflux, or Soxhlet. Selection of the specific media and technique used in the extraction is a function of the desired extractable profile, which can be categorized in many ways (5). For example, refluxing in a strong organic solvent may be used to determine the total amount of nonpolar substances in the material whereas filling an assembled packaging configuration with a dilute alcohol/water solution may be used to obtain an extractable profile representative of a worst-case leachable profile.
The media and extraction procedures are selected based on the profile to be achieved, but the extraction stoichiometry, that is, the ratio of material being extracted to the extraction medium, also plays a critical role in the extraction process. This is because all extractions occur in a biphasic system in which the extractable substance(s) partitions between the material and the extracting medium. The total amount extracted into the medium is a function of the compound's partition coefficient, K, which quantifies its affinity for the two phases, typically by expressing the ratio of the substance between the phases at equilibrium. This value could be based on mass, volume, or surface area.
Because K is a constant for a given system, any change to the proportion of one medium while holding the other constant will result in a change in the total mass extracted. Such a scenario will now be illustrated in a fictitious example. To start, it is necessary to express K as an equilibrium between the concentration of two phases on a mass/mass basis, which is displayed in Eq 1.
 Here, mS is the mass of the extractable in the sample, MS is the mass of the material, mM is the mass of the extractable in the extracting medium, and MM is the mass of the extracting medium.
Using this equation and the values for our fictitious system, which has a K of 1000 for a compound with a total mass of 1000 µg in the stopper, a stopper weight of 2 g, and extraction medium masses of 10 g and 50 g, the predicted total mass of the compound extracted into the medium, represented by x, is shown in Eq 2 and Eq 3:
As can be seen in these calculations, using less extraction solvent would be expected to result in an underextraction of the material when all other factors are equal. Also of note is the concentration of the compound in the medium for each example, which is 0.5 µg/g. This is notable because it illustrates how the extraction of such hydrophobic compounds into a medium is limited by their solubility in that medium. Clearly, using lower proportions of the medium with the goal of increasing the concentration of the substance in that medium is ultimately ineffective.
The preceding example used a K value of 1000, which indicates a strong affinity for the material phase. Such a K value is typical for most polymer-related substances when extracted by an aqueous medium, which is a consequence of the hydrophobic nature of these substances. Nevertheless, it should be understood that as K becomes smaller, which would occur when the compound has an appreciable affinity for the extracting medium, the impact of the proportion of the extraction phase to the sample phase is reduced. This is demonstrated in Eq 4 and Eq 5 using the same variables as the previous example except that the K value is now 0.01, indicative of a compound with a strong affinity for the extraction medium.


As can be seen here, the total amount of the compound in the stopper was effectively extracted using both volumes of solvent. Additionally, and unlike the previous example, the concentration in solution would be increased by using a lower solvent volume (100 µg/mL for 10 g of medium versus 20 µg/g for 50 g of medium).
In a second theoretical example, a previously published study (6) showed that increasing the ratio of surface area to extraction solvent volume, either by reducing the solvent volume or changing the size of the packaging system, results in a proportional reduction in the total extracted amount for compounds with large K values (>10). The authors concluded that using higher ratios of solvent volume to surface area is acceptable and can be scaled, but using lower ratios is not necessarily scalable and thus not representative of the packaging system.
In each of these examples, it was clear that reducing the ratio of extraction volume to amount of material (surface area, mass, or volume) can result in an underextraction of that material (less total mass extracted), with the degree of underextraction being a function of the specific K value for each extracted substance. This will now be further demonstrated using data obtained from two laboratory-based experiments.
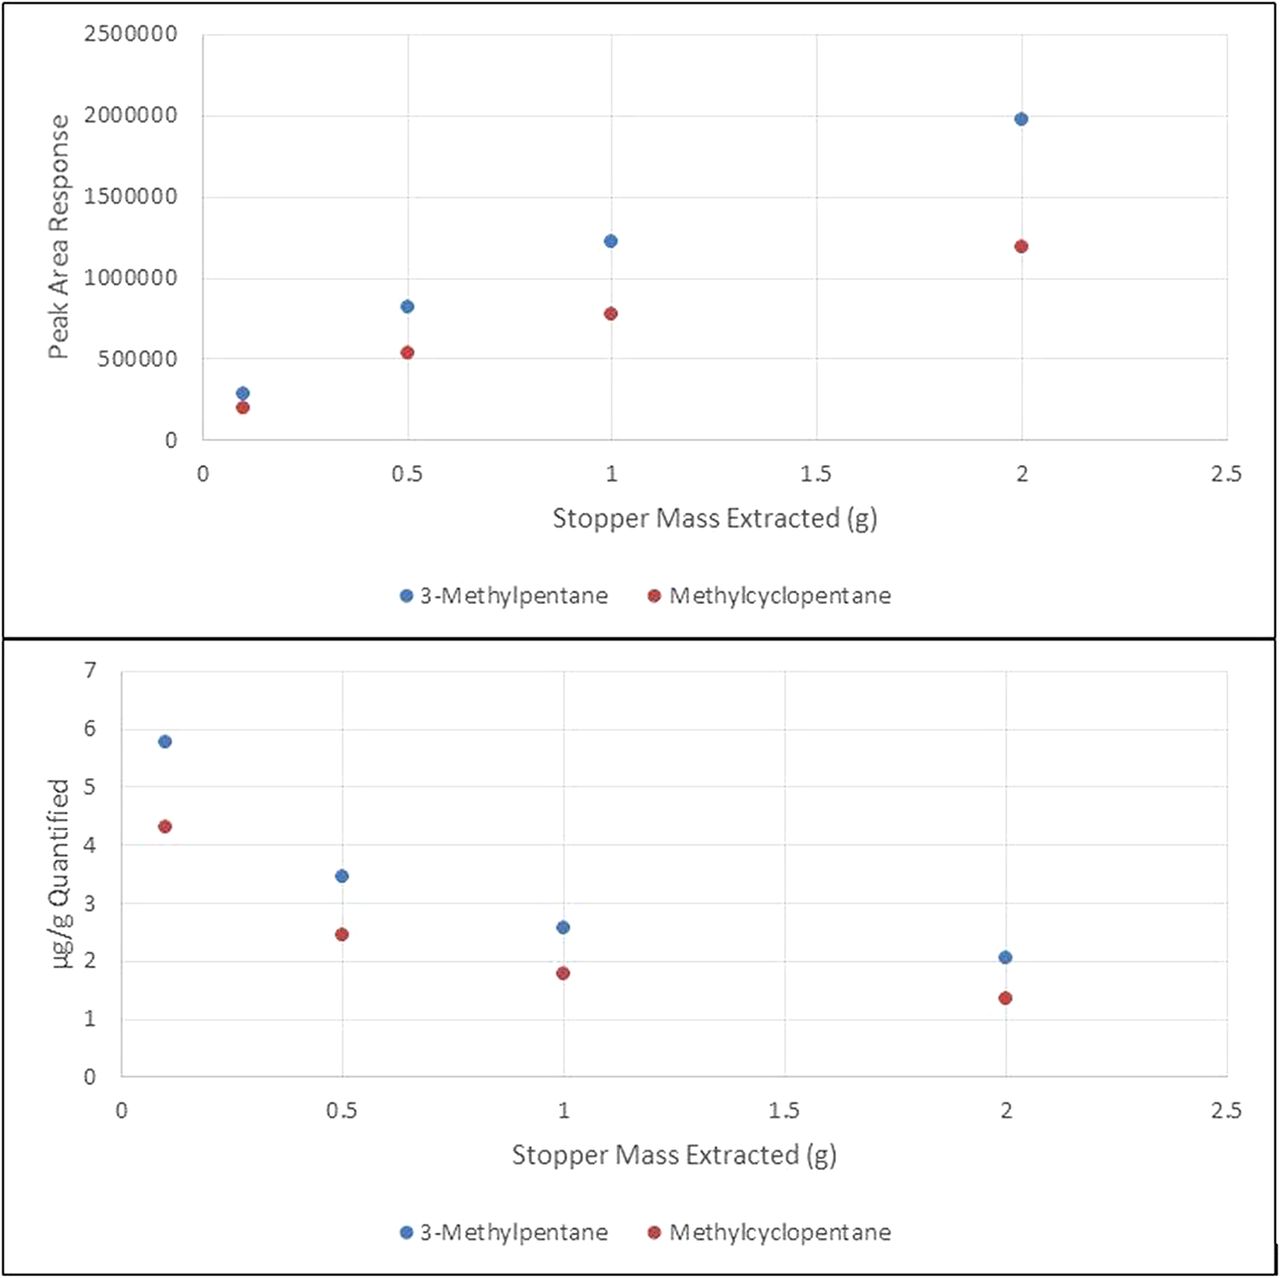
In the first experiment, a stopper sample was extracted within a sealed 20-mL headspace vial using heat to facilitate the extraction of volatile organic compounds into the gas phase within the vial. Samples were prepared in triplicate, with each using a different weight of stopper. As can be seen in Figure 1, the data obtained from this experiment show that increasing the stopper mass does increase the concentration, and thus response, of the extractable in the headspace, which is typically the desired outcome of such an increase in sample mass. However, the increase in concentration/response is not proportional to the increase in mass. Hence, when calculating the microgram of each extractable per gram of stopper, increasing the stopper mass actually lowers the total amount extracted, resulting in an underextraction of the material.

Plots of peak area response versus stopper mass extracted in a headspace autosample vial (top) and the calculated µg/g extracted versus mass per vial in the extraction (bottom).
In the second experiment, 1 g of bromobutyl and 1 g of chlorobutyl stopper material were extracted with solvent volumes of 5 mL, 10 mL, 25 mL, 50 mL, and 100 mL. Two solvents and extraction techniques were used: ethyl acetate with extraction facilitated by reflux for 24 h and 1:1 isopropanol:water with the extraction facilitated by incubating in a sealed pressure vessel for 24 h at 85 °C.
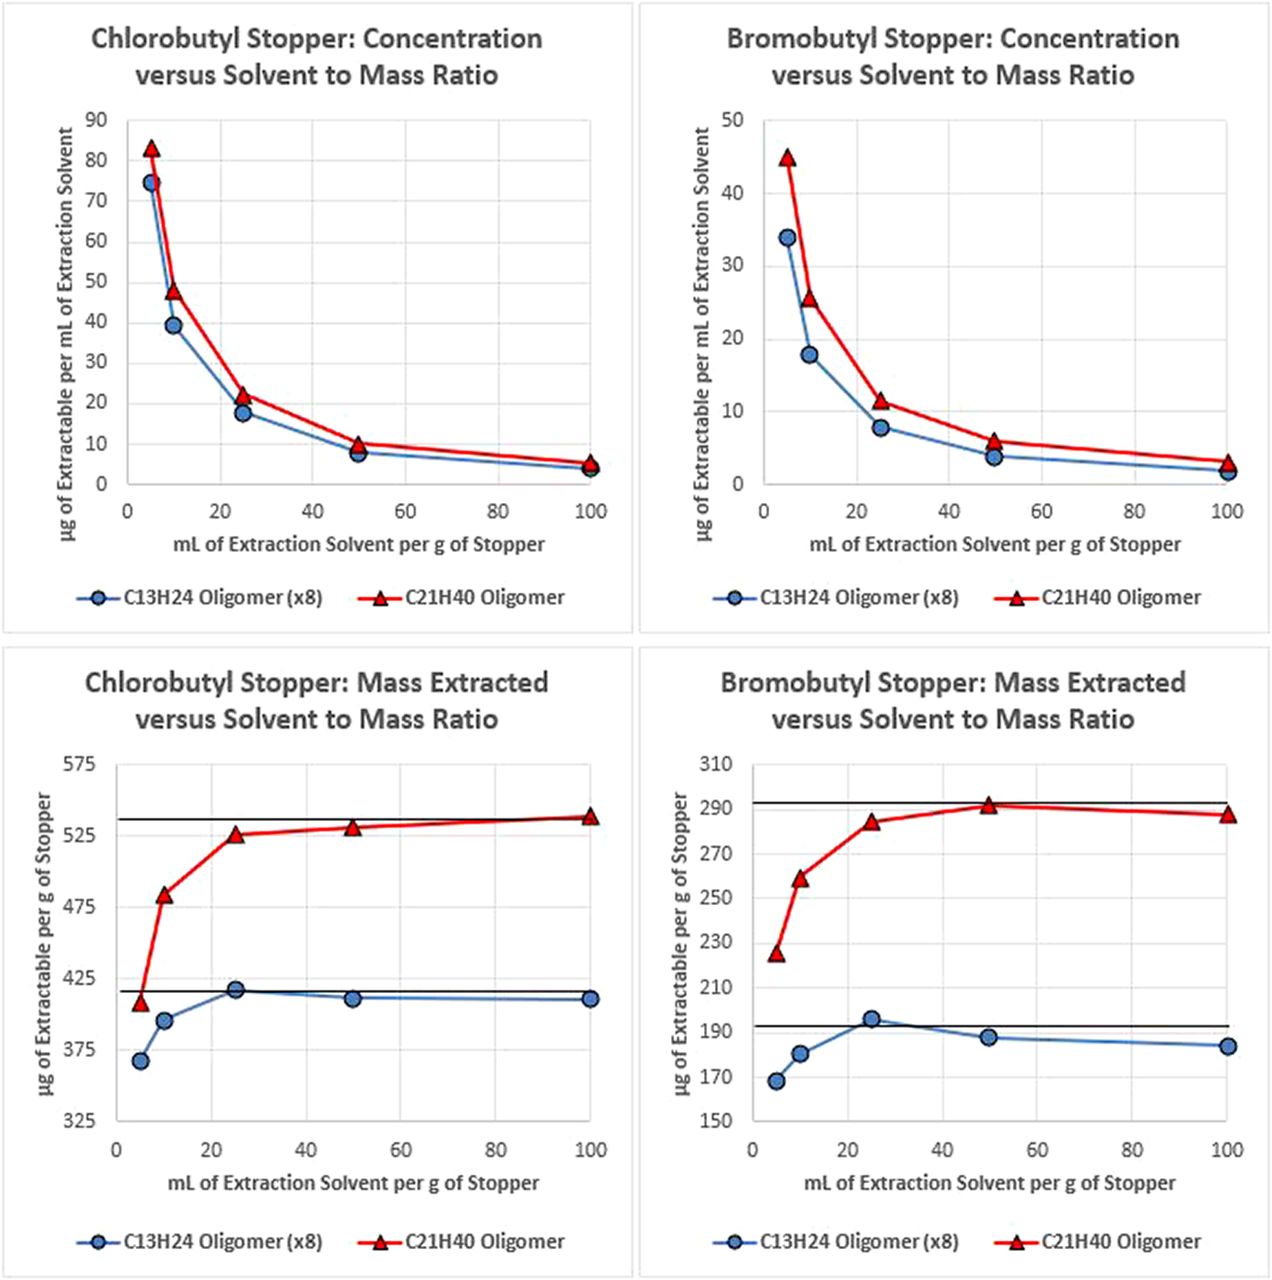
The results obtained for the ethyl acetate reflux extraction are presented in Figure 2, which includes plots of the concentration of the extractable quantified in solution as well as the total mass extracted from the material. As with the headspace example, using lower ratios of extraction medium to sample mass results in higher concentrations in solution, as expected. However, this was not proportional to the mass of sample, so the total extracted mass was reduced as extraction volume decreased. In addition to being able to extract more total mass, volumes ≥ 50 mL/g of stopper were able to liberate the total pool of each extractable, as indicated by the black line in the chart, whereas volumes < 50 mL/g of stopper did not.

Plots of the concentration of two butyl rubber oligomers, which were extracted from two types of stoppers as facilitated by reflux, in ethyl acetate extraction solvent (top) and plots of the mass of each oligomer extracted per stopper mass (bottom) for various ratios of stopper mass to extraction solvent volume. Error bars are not included because data variability was minimal (the largest percent relative standard deviation value was 5%). In the µg/g plots, a line representing the total pool of each compound is included to provide perspective on the exhaustiveness of the extraction for each mass/volume ratio.
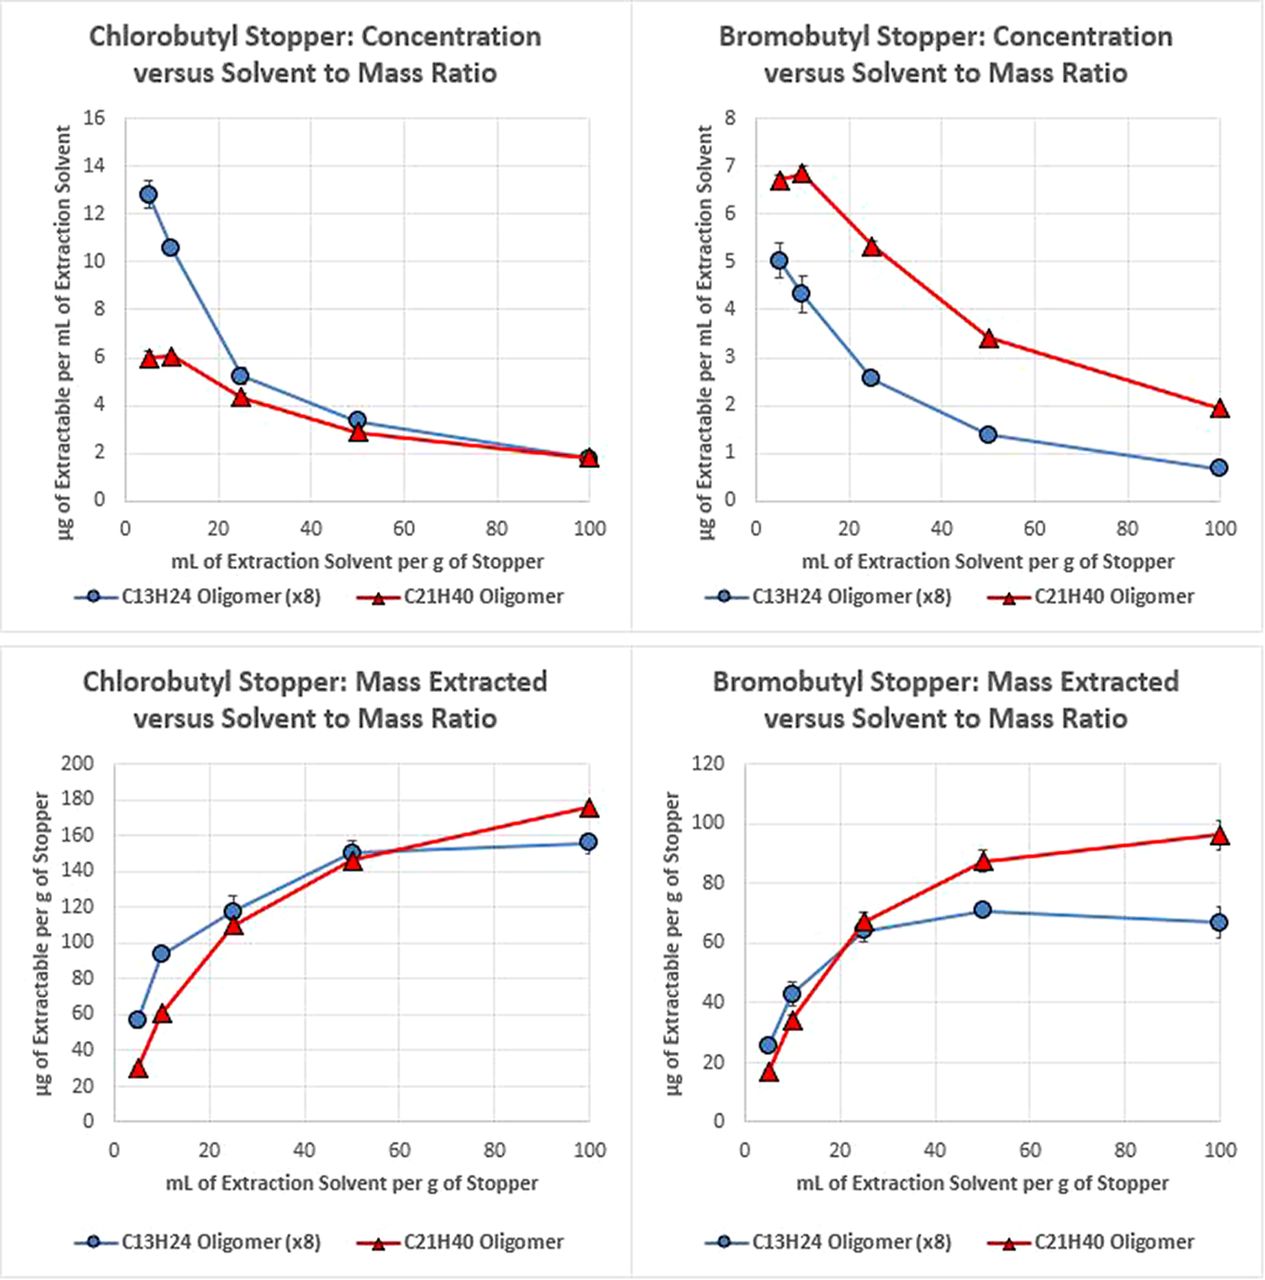
The results obtained for the 1:1 isopropanol:water extracts, as facilitated by heating the solvent and stopper materials in a sealed pressure vessel at 85 °C, are presented in Figure 3. As can be seen here, the trends in extracted mass and concentration are identical to that obtained for the ethyl acetate reflux. The primary difference between this solvent and ethyl acetate is the magnitude of the extracted amount and the inability to achieve an exhaustive extraction, both of which are an expected outcome due to the reduced extraction power of this partially aqueous solvent as compared to 100% ethyl acetate.

Plots of the concentration of two butyl rubber oligomers, which were extracted from two types of stopper as facilitated by sealed vessel incubation in 1:1 isopropanol:water extraction solvent (top), and plots of the mass of each oligomer extracted per stopper mass (bottom) for various ratios of stopper mass to extraction solvent volume. Error bars represent one standard deviation.
An important consequence of extraction stoichiometry is evident when considering recommended surface area to volume ratios in current standards and protocols, such as those specified in the International Organization for Standardization (ISO) 10993 part 12 (7) and the BioPhorum Operations Group (BPOG) single-use manufacturing protocol (8). In these, it is recommended to use relatively low ratios of solvent to surface area. For example, 1 mL/6 cm2 in the BPOG protocol. Now, if the goal of this approach is to achieve a solution that has the highest possible concentration of extractables for a specific purpose, such as in vivo biocompatibility testing in ISO 10993, then this course of action is sensible. However, for the purposes of obtaining a thorough, or at least representative, extractable profile, the use of these concentrated solvent to material ratios actually results in the opposite outcome, as previously demonstrated.
Ultimately, if the goal is to achieve a concentrated solution so that extractables can be detected, the use of reduced solvent volumes to sample material is unnecessary for two reasons. First, and as previously demonstrated, the concentration of extractables with high K values, such as most polymer-related substances when extracted by an aqueous medium, is limited by their solubility; thus, the use of lower solvent volume ratios has minimal impact on their maximum concentration, but a significant impact on the total amount extracted. Second, pretreatment procedures, such as solid-phase extraction (SPE) or liquid/liquid extraction (LLE), can be used to enrich the concentration of compounds in the sample so that, when properly designed for their purpose and qualified, detection of compounds down to the AET can be achieved.
3. Derivatization in GC Analysis: Is It Necessary?
Direct injection GC provides for the assessment of a wide range of semivolatile polar and nonpolar substances. When used in tandem with electron ionization mass spectrometry, as is common in E/L screening studies, this methodology provides for the universal detection of any compound that can be volatilized and introduced into the mass spectrometer. However, compounds containing functional groups with the ability to act as hydrogen bond donors and acceptors, such as carboxylic acids, amines, and alcohols, may interact with the various internal surfaces of the GC resulting in poor response, poor chromatography, and/or carryover, all of which significantly impact the ability of the method to detect these classes of compounds. Because these substances are often polar enough to be leached by aqueous drug products, as well as many other drug formulations, it is important that methodologies employed in an E/L screening study be capable of their detection.
To overcome this potential blind spot in the data generated by an E/L screening study, approaches must be implemented to allow these compounds to be adequately detected and quantified. Thankfully, this can be achieved by converting these substances into various GC compatible analogs via a derivatization procedure. Such a procedure involves the replacement of the active hydrogen atoms in these functionalities with another group, such as trimethylsilyl (–Si(CH3)3) or trifluoro acetyl (–C = OCF3), which significantly reduces their ability to form hydrogen bonds. Consequently, the response and chromatography are significantly improved.
To illustrate this improvement, Figure 4 presents the quantification limit (QL) values measured for 31 amines, carboxylic acids, and alcohols containing compounds in their derivatized and nonderivatized forms, whereas the full data, including the QL concentration values and whether the compound was detected or not, are included in the Table A-I of the “Supplementary Data” section. As can be seen in these data, the quantification limit value was lower for the derivatized sample in every case, often significantly (>1 order of magnitude), if the compound was detected at all. The only compound that produced a comparable quantification limit in both the derivatized and the nonderivatized forms was aniline. However, this outcome was sensible given that the amine group in aniline is attached to a phenyl group, which changes the chemistry of the amine (aniline pka = 4.6; cyclohexylamine pka = 10.6).

Plot of the measured quantification limit for a mix of 31 compounds analyzed by GC/MS in their natural state (orange bars) and as their TMS or TFA derivative (blue bars).
Despite the obvious advantages of derivatization, there are three questions/concerns that are frequently proposed to justify its omission and as such deserve further investigation. First, it has been stated “derivatization significantly complicates the sample preparation procedure, making it too complex and time consuming to be of use.” In response to that statement, the procedure used to perform derivatization is presented:
Add 25–200 μL of BSTFA/TMCS or MBTFA to a vial containing 0.5 mL of sample in ethyl acetate or dichloromethane. Mix by hand for 5 s.
This is the entirety of the procedure, which does not involve any complicated incubation, evaporation, solvent exchange, or other procedures that would make it difficult or time consuming to perform. As such, derivatization can be incorporated easily into most sample preparations procedures already being employed.
As a brief aside, a couple of questions that may be evident in this procedure will be addressed. First, you may have noticed that there are two reagents used. This is a consequence of each reagent's ability to derivatize certain functionalities; specifically, BSTFA/TMCS works well for acids and alcohols whereas it does not achieve full derivatization of amines. Conversely, MBTFA quickly achieves complete derivatization of amines but does not work well for alcohols or acids. Second, you may have wondered why ethyl acetate or dichloromethane solvents are specified. This is due to the need to use a solvent that will not react with the reagents, which are those that do not contain an amine, hydroxyl, or acid functionality. Obviously, using a solvent such as methanol would react with the reagent, ultimately quenching it and preventing the compounds of interest from being completely derivatized.
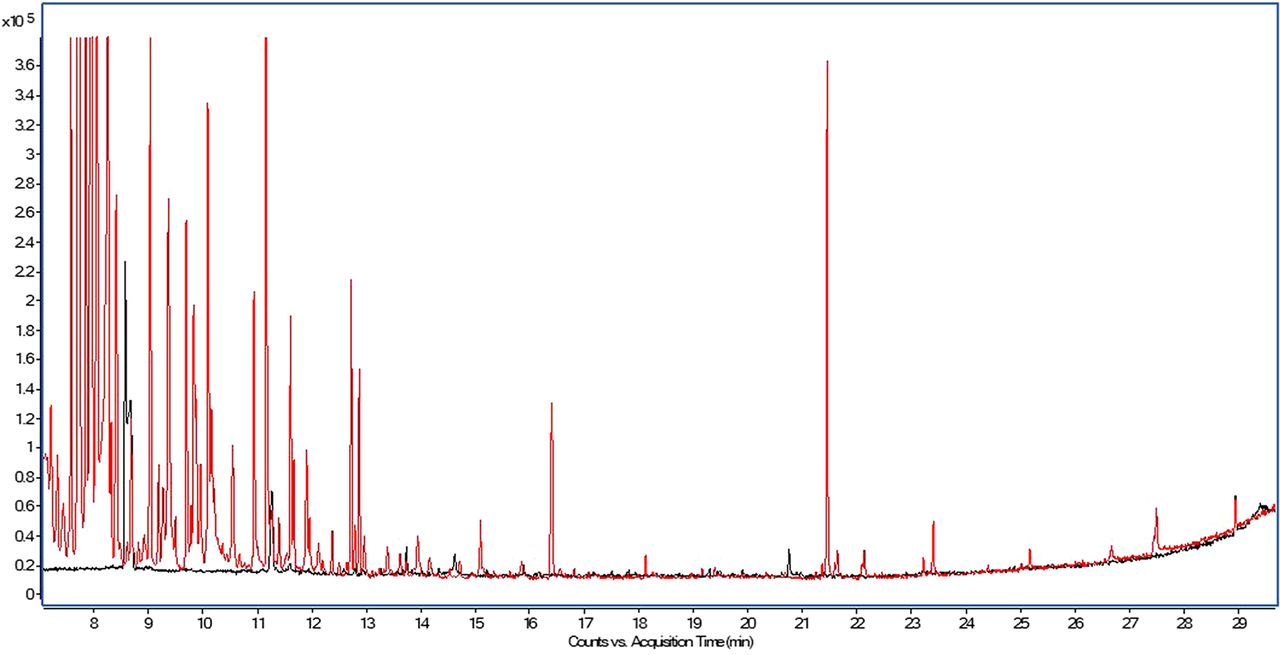
Moving back to the topic at hand, the second perception one may encounter is “derivatization complicates the data evaluation to such an extent that it provides minimal benefit.” As can be seen in Figure 5, which presents an overlay of the total ion chromatogram obtained for an ethyl acetate diluent injection and a BSTFA/TMCS–derivatized ethyl acetate diluent injection, the derivatized diluent does contain multiple peaks attributable to the derivatization reagent in the early portion (≤13 min) of the chromatogram. However, peaks observed later in the chromatography are actually fatty acids and other substances uncovered by the derivatization.

Overlay of the total ion chromatograms of ethyl acetate diluent analyzed as is (black trace) and ethyl acetate diluent analyzed after BSTFA/TMCS derivatization (red trace).
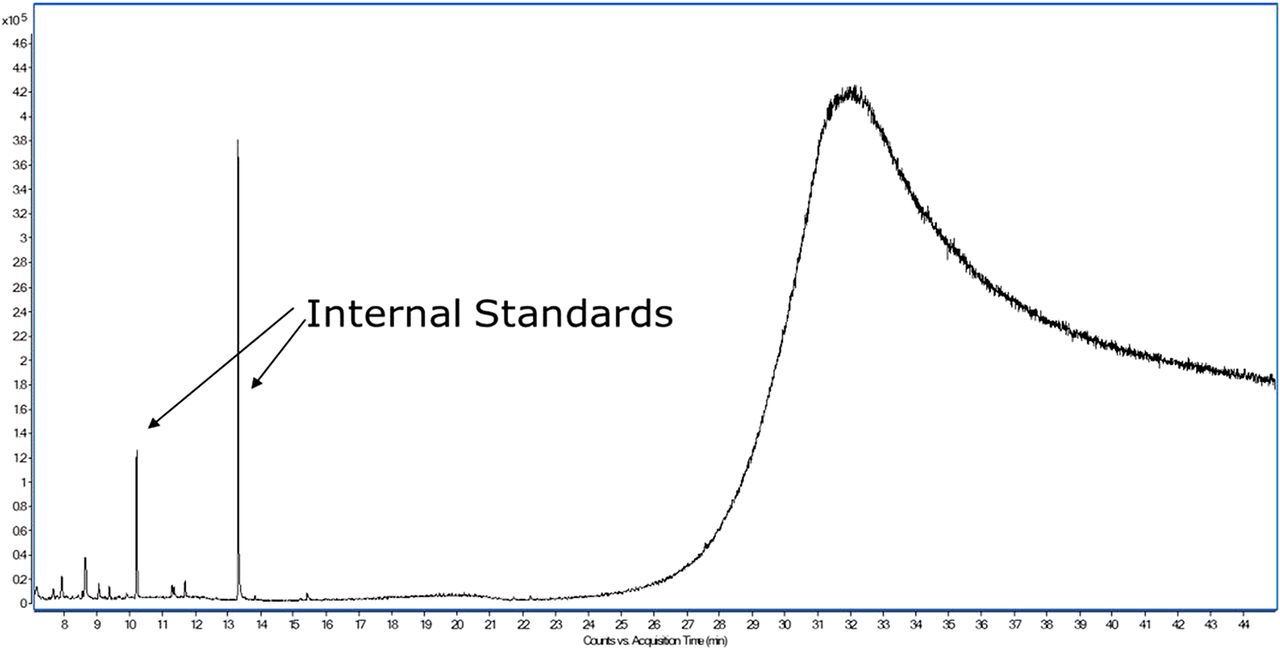
Despite the complexity BSTFA/TMCS derivatization introduces, it is typically a simple process to overlay derivatized samples with the corresponding derivatized controls and corresponding nonderivatized sample preparation to quickly determine which peaks are unique to the derivatized sample and thus represent extractable or leachable substances that have undergone derivatization. It is also noted that derivatization is used as a supplemental preparation procedure for the identification of the aforementioned substances. Neutral compounds that do not require derivatization are analyzed in a nonderivatized sample. Finally, MBTFA, being a less reactive reagent, does not produce any significant artifact peaks, as illustrated in Figure 6.

Total ion chromatogram of ethyl acetate diluent analyzed following MBTFA derivatization.
The final perception often used to justify the omission of derivatization from a study is “these compounds are covered by the other methods included in a screening study (headspace gas chromatography in tandem with a mass spectrometer (HS/GC/MS) and liquid chromatography in tandem with a mass spectrometer (LC/MS)), so there is no need to derivatize for GC analysis.” To put this statement to the test, the 31 compounds previously used to assess derivatization GC/MS were analyzed by HS/GC/MS and LC/MS. For the HS/GC/MS analysis, the compounds were spiked into an empty vial as well as vials containing sample material and water, a necessary variable to consider since headspace analysis is itself an extraction and thus the presence of a sample matrix will impact the data obtained. The LC/MS method was evaluated on an ultrahigh-performance liquid chromatography system in tandem with a quadrupole time-of-flight mass spectrometer (UPLC/QTOF) system by directly injecting the compounds prepared in methanol.
For the HS/GC/MS analysis, it was found that only the alcohols in the empty vials had quantification limit values comparable to the derivatized GC/MS analysis (full data included in the Table A-II of “Supplementary Data” section of this commentary). Nevertheless, none of the compounds had quantification limit values that were comparable to that obtained by derivatized GC/MS when water or a sample matrix was present in the vial. Given this result, clearly HS/GC/MS is not capable of analyzing any of these substances at a level that can be achieved by derivatized GC/MS.
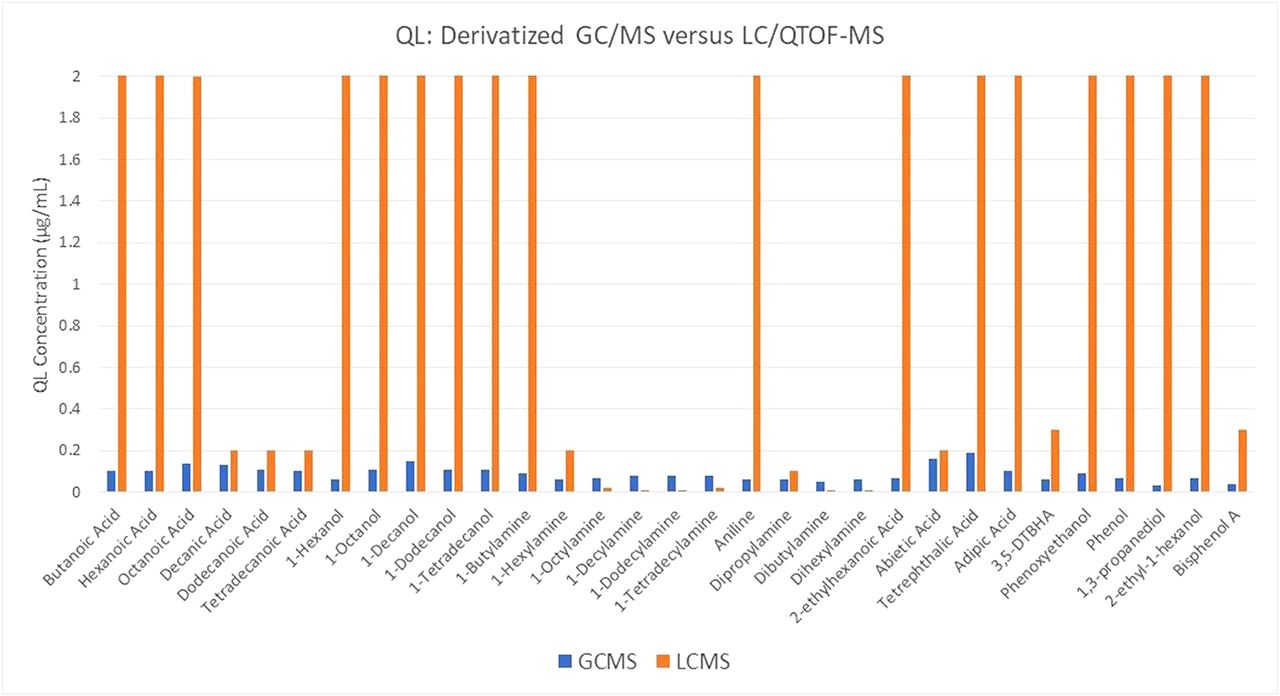
The data obtained from the UHPLC/QTOF analysis are presented in chart form in Figure 7; the full data, including the exact QL concentration values and whether the compound was detected or not, are included in the Table A-III of “Supplementary Data” section. Here, clearly some of the compounds do, in fact, produce quantification limit values comparable to or exceeding that of the derivatized GC/MS; specifically, the longer chain carboxylic acids, primary amines, and secondary amines. However, the remaining compounds still did not produce quantification limit values comparable to the derivatized GC/MS, if detected at all. This suggests that UPLC/QTOF can provide for the analysis of some of the compounds that would require derivatization for GC analysis, but it cannot in and of itself replace this approach.

Plot of the measured quantification limit for a mix of 31 compounds analyzed by GC/MS after derivatization (orange bars) and via UHPLC/QTOF-MS without derivatization (blue bars).
4. The Importance of Verifying Method Performance
Regardless of the technique used, an assessment of method performance is important when performing screening assessments to ensure the method is capable of producing appropriately accurate and representative data. The excuse that these are “primarily qualitative methods and thus performance from a quantitative perspective is not critical” is not acceptable given the use of these data to support important decisions pertaining to the product.
For example, consider a fictional scenario in which two identical studies were performed for the extraction of a plasticized PVC IV bag. In each study, the bag was extracted in an identical manner using 40/60 ethanol/water and the extract was processed for analysis using LLE and derivatization with BSTFA/TMCS. In the first study, no method verification was performed. The data obtained for the GC/MS analysis found only the primary plasticizer, di(2-ethylhexyl)phthalate, present at a level greater than the AET. Accordingly, it was concluded that the plasticizer was the only compound likely to leach from the bag during use. In the second study, method verification was performed, which uncovered incomplete derivatization. Ultimately, this led to the discovery that the presence of ethanol in the sample caused water to migrate into the organic phase of the LLE procedure used to prepare the sample, which in turn significantly hindered the BSTFA/TMCS derivatization. The procedure was repeated using a drying agent to remove water from the organic phase, which was then verified to achieve complete derivatization. The data obtained from the repeated experiment showed that in addition to the primary plasticizer two of its degradants, 2-ethyl-1-hexanol and mono-2-ethylhexyl phthalate, were present above the AET. Accordingly, these were also identified as potential leachables requiring further assessment.
Important parameters to assess as part of method performance, including associated considerations for each parameter, are listed below. Other parameters may require assessment, however, depending on the needs of the study.
General System Suitably
Chromatographic noninterference: Analysis of the diluent shows that no significant responses are being introduced from the system or solvent that would compromise the evaluation of the data.
Sensitivity: The method's QL is verified using appropriate standard or standards prepared at the QL concentration. This concentration should also be demonstrated to be sufficient to achieve the AET.
Precision: A standard or standards injected over the course of the run at an appropriate concentration shows that the instrument is capable of generating a precise response.
Performance of Sample Preparation Procedures
Chromatographic noninterference: Analysis of the diluent shows that no significant responses are being introduced from the system or solvent that would compromise the evaluation of the data.
Accuracy: A suitable set of compounds is added to the sample at an appropriate concentration, such as at the AET, the sample is processed by the procedure, and recovery of those compounds is determined to demonstrate the methods ability to recover compounds of interest form the sample.
Precision: Multiple accuracy preparations are made and precision of the quantified amount of each compound is assessed to show that the preparation procedure is repeatable and the data degenerated are precise.
Derivatization completeness: A suitable compound or compounds is added to the sample prior to derivatization. The response of the derivatized compound and its nonderivatized form (if present) are compared to determine the completeness of the reaction.
Despite being an obvious good practice from an analytical perspective, the assessment of method performance has generally not been a requirement from regulatory bodies for medicinal products based on the number of studies observed to go through regulatory review without issue despite the omission of this assessment. However, this practice has become a requirement for medical devices, especially implanted devices, as evident in the recently revised part 18 of ISO Standard 10993, which pertains to the chemical characterization of medical device materials, and experience with FDA CDRH who specifically requests that this be done.
5. How Should Analytical Variation Be Accounted for When Calculating the AET?
In an E/L screening study, it is not possible to include authentic standards for each substance that may be found. This is a consequence of the qualitative nature of this analysis, which precludes the knowledge of what compounds are present in the samples beforehand. As such, compounds uncovered in the screening study are typically quantified with a surrogate standard or standards, which provides a generic response to use for the initial quantification.
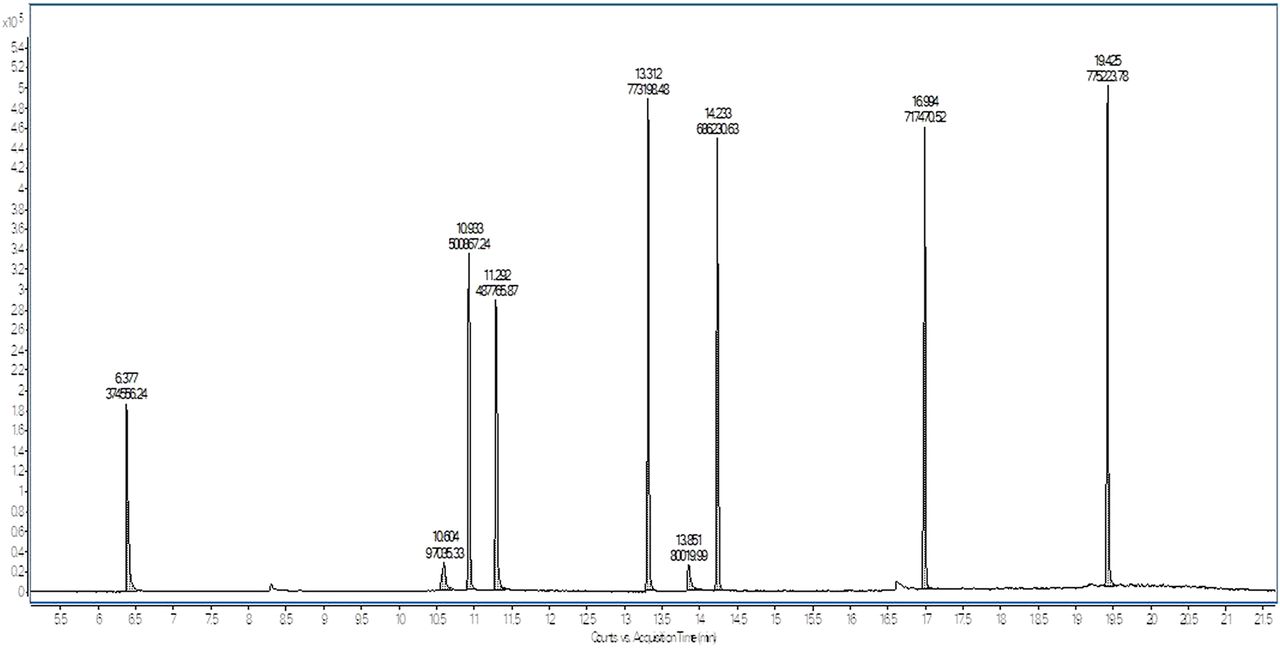
It is obvious that variations in response factor between the surrogate standard and compounds of interest can result in inaccurate quantification if not properly accounted for. This is illustrated in Figure 8, which shows several standards prepared at the same concentration (10 µg/mL) and analyzed by GC/MS. The response of each peak in the chromatogram varies, significantly in some cases, making it impossible to accurately quantify based on a surrogate response alone.

Total ion chromatogram of several compounds prepared at a concentration of 10 µg/mL and analyzed by GC/MS.
One way to account for this variation is to analyze authentic reference standard material for the compound of interest, determine the response factor difference relative to the surrogate standard, and apply a correction factor to the amount initially quantified with the surrogate standard. This can be done following the initial screening analysis and/or obtained from a database of response correction factors previously generated for the method. However, this approach cannot be used for compounds that are not able to be identified or do not have standard material available.
To account for this variation with the goal of identifying most compounds with concentrations above the AET, an uncertainty factor is often applied to the AET used to evaluate the data. For example, per ISO 10,993 part 18 and the original Product Quality Research Group (PQRI) Orally Inhaled or Nasal Drug Products (OINDP) recommendation, this uncertainty is set at 50%, or the relative standard deviation (%RSD) of a database of response factors obtained for the method, whichever is greater. However, it has become evident that this approach is not suitable on its own to adjust the AET to adequately account for response variation.
As an example, to use our GC/MS relative response factor (RRF) database (10), which has a %RSD of 50 for 199 compounds, we would obtain the data shown in Table I for several compounds if they were used as a surrogate standard. The number of compounds below the AET for each surrogate standard before and after correcting for the uncertainty factor of our database is presented. As can be seen in this table, selecting a compound with a high response factor results in a significant number of compounds falling below the AET, even after correction. Compounds with lower response factor values, such as acetophenone-d5, our method's surrogate standard, overestimate the amount initially produced and thus are less likely to result in the omission of a compound from the data after correction. Thus, clearly the selection of the surrogate standard as well as accounting for variability is critical to ensure the method adequately captures compounds above the AET.
Comparison of the Impact of Surrogate Standard Selection on Compounds in the Database That Would Fall below the AET before and after Correction for the Uncertainty Factor of the Database, Which Is 50%
With this example being presented, it is important to note that this issue is by no means a realization of myself alone. Several other experts in the E/L field have published valuable information on this subject, which should be considered. First, Dr. Dennis Jenke recently published two papers (10, 11) detailing the correction of the AET based on response factor uncertainty associated with screening studies. In these papers, a similar conclusion is reached to that in this commentary, which is that accounting for response factor variation alone does not adequately adjust the AET to capture compounds with response factors lower than the internal standard.
Another paper published by Dr. Mark Jordi and colleagues (12), which in part focused on reference standard selection for screening methods and accounting for analytical variability, arrived at a similar outcome. Specifically, the authors looked at analytical variability of a diverse range of leachable substances by LC/MS. Their evaluation prompted them to conclude that surrogate standards with lower response factors are preferable to help ensure that compounds of interest are adequately captured above the AET, as well as the importance of having a well-characterized analytical screening method and database, for that method to understand the response variability it is producing. To that end, they have presented additional work (13, 14) demonstrating a multidetector approach as a means of reducing response factor uncertainty, which in turn reduces the uncertainty factor that would need to be applied when calculating the AET.
Although response factor variation receives much of the attention when calculating and applying analytical uncertainty correction factors, it is only one possible source of variability in the data obtained from screening studies. For example, variability in analyte recovery when a pretreatment technique, such as LLE and SPE, is used can have a significant impact on the data produced.
To elaborate, even the best methods will not accurately recover all compounds, and compounds with poor recovery (<50%) could be missed if this variable was not accounted for. For example, performing LLE or reverse phase SPE, both of which favor the retention of nonpolar substances, on an aqueous matrix containing butylated hydroxytoluene (BHT), a hydrophobic substance, and caprolactam, a hydrophilic substance, would likely result in BHT being recovered acceptably but caprolactam being recovered poorly. Given that caprolactam would likely be preferably extracted or leached into the polar aqueous medium, its underestimation due to poor recovery could give the illusion that its presence is much lower than it truly is. Nevertheless, the primary focus of recent work in the field has been on understanding of the impact of response factor variation, so the impact of recovery variation is something that still needs to be addressed.
6. Summary
The key points of this commentary are summarized below:
Extraction stoichiometry is as important as the selection of solvent, contact duration, contact temperature, and extraction technique when designing a procedure for the extraction of a given material. To achieve a thorough and/or representative extraction it is advisable to use relatively large amounts of the extraction medium, when possible, to extract a material. At a minimum, the amount of the medium should be consistent with the amount of drug product, or product-related substance, that it will contact. However, this may contradict information in published standards and other sources, so a balanced approach may be required.
Derivatization of samples for GC analysis is advisable to ensure compounds with labile hydrogens are adequately captured within a screening study because many of these compounds would only be adequately detected by derivatization-based GC.
The assessment of method performance for E/L screening methods is critical to ensure the data generated are truly representative of the sample. Simply analyzing the samples and “taking what you get” based on the justification that these are primarily qualitative studies is not acceptable given the use of these data to support important decisions.
Response factor variation, as well as other sources of analytical variation (such as recovery in a preparation procedure), should be accounted for when establishing the AET for a study to ensure that a majority of compounds present in the sample at or above the AET are adequately captured. In addition to applying a correction factor, this also involves proper surrogate standard selection, at a minimum, as well as proper detection methods.
Conflict of Interest Declarations
The author is currently employed by Baxter International. His previous employer was PPD Laboratories. Furthermore, the contents of this paper are recommendations based on the author's experience for the consideration of the pharmaceutical industry. They are not intended to imply established or regulatory accepted practices for use in the execution of E/L studies.
Supplementary Data
Data for the Comparison of the Derivatized and Nonderivatized Analyses Response % difference values were calculated at the 10 µg/mL level unless the compound was only observed at 50 µg/mL in both modes. The QL concentration was extrapolated for the derivatized standards at each concentration (0.1 µg/mL, 1 µg/mL, 10 µg/mL, and 50 µg/mL). The derivatized compounds did not have good linearity of their response, so the extrapolated QL was based on the lowest standard, or the concentration of the lowest standard was used, whichever was greater.
Analysis of Compounds with Labile Hydrogens by HS/GC/MS
Analysis of Compounds with Labile Hydrogens by UHPLC/QTOF-MS
- © PDA, Inc. 2021
In This Issue


Jump to section
- Article
- Abstract
- 1. Introduction
- 2. Realizing the Impact of Extraction Stoichiometry
- 3. Derivatization in GC Analysis: Is It Necessary?
- 4. The Importance of Verifying Method Performance
- 5. How Should Analytical Variation Be Accounted for When Calculating the AET?
- 6. Summary
- Conflict of Interest Declarations
- Supplementary Data
- References
- Figures & Data
- References
- Info & Metrics
Related Articles
Cited By...
- Understanding Alignment in the Execution of Extractable Screening Studies Between Laboratories: Results of the ELSIE Lab Practices Sub-Team Industry Surveys
- A Practical Derivation of the Uncertainty Factor Applied to Adjust the Extractables/Leachables Analytical Evaluation Threshold (AET) for Response Factor Variation