
Abstract
Maintaining container closure integrity (CCI) is challenging for vials that are packaged at room temperature and stored and/or transported at a colder temperature, such as −80°C. Cold temperatures can affect the sealing mechanisms of the package because of the glass transition temperature (−50°C to −70°C) of the rubber stopper used to seal the vial and the different coefficients of thermal expansion of each of the primary packaging components. Most CCI tests are conducted at room temperature and detect leaks from permanent defects that always exist under all storage conditions. However, previous research shows that temporary leaks that develop during cold storage can reseal when the vials are brought back up to room temperature and, therefore, can no longer be detected. The following study demonstrates two methods for CCI testing that can be performed with product-filled, frozen vials, packaged with unmodified headspace conditions using carbon dioxide ingress as a leak indicator. The two methods utilize different gas flow depending on the storage conditions. The first method generates effusive flow through a leaking defect, whereas the second generates diffusive flow. Experimental data revealed the effusive procedure detected laser-drilled defects ≥2 µm in empty glass vials and microwire defects in empty glass and plastic vials with effective defect sizes ≥0.4 and 0.6 µm, respectively. The diffusive procedure detected laser-drilled defects ≥2 µm in empty glass vials and microwire defects in empty glass and plastic vials with effective defect sizes ≥ 0.8 and 2.6 µm, respectively. Liquid product interactions with the defect as well as length of the storage period were also explored.
- Container closure integrity
- Headspace gas analysis
- Deep cold storage
- Frozen product
- −80°C storage
- Frequency modulation spectroscopy
- Method development
- USP 1207
- Carbon dioxide
Introduction
Sterile pharmaceutical products such as live viral vaccines, gene therapies, and products that contain active cells often require deep cold storage at either −80°C or cryogenic temperatures (−196°C) to maintain stability and/or activity. As a consequence, these products are also often shipped on dry ice (−78.5°C) during transport. These cold storage and shipping conditions generate a multitude of stresses that challenge the container closure integrity (CCI) of the primary product package assembly. Computational modeling shows that the physical and material properties of the primary packaging components, including their dimensional characteristics, vary with temperature (1). Specifically, in 2020, Zeng et al. (2) demonstrated that rubber stoppers used to package many pharmaceutical products are viscoelastically time and temperature dependent. The glass transition temperature (Tg) of these rubber stoppers ranges from −55°C to −70°C (3). When the rubber stopper is exposed to a temperature below its Tg, it loses its elasticity and becomes brittle. Additionally, each of the primary packaging components (glass or plastic vial, rubber stopper, and metal crimp) have a unique coefficient of thermal expansion that causes them to contract at different rates when exposed to these low temperatures. For example, the coefficient of thermal expansion of borosilicate glass is much less than that of butyl rubber, resulting in much greater thermal contraction of the stopper relative to the glass at −80°C. Studies using X-ray tomography have shown that the varying rates of shrinkage of the rubber stopper and vial component as the temperature drops, due to the differences in the thermal expansion coefficients, can potentially cause gaps to form at the material interfaces (4, 5).
Furthermore, in addition to the characteristics of the packaging components, an equally important consideration is the capping and crimping process used to seal the vials. The X-ray tomography studies mentioned in the previous paragraph showed that insufficient crimp force increases the risk of gaps at the material interface when the packages are stored at ultracold temperatures (4, 5). Deep cold storage conditions, therefore, pose a unique challenge to the CCI of the primary packaging components and the safety/stability of the drug product.
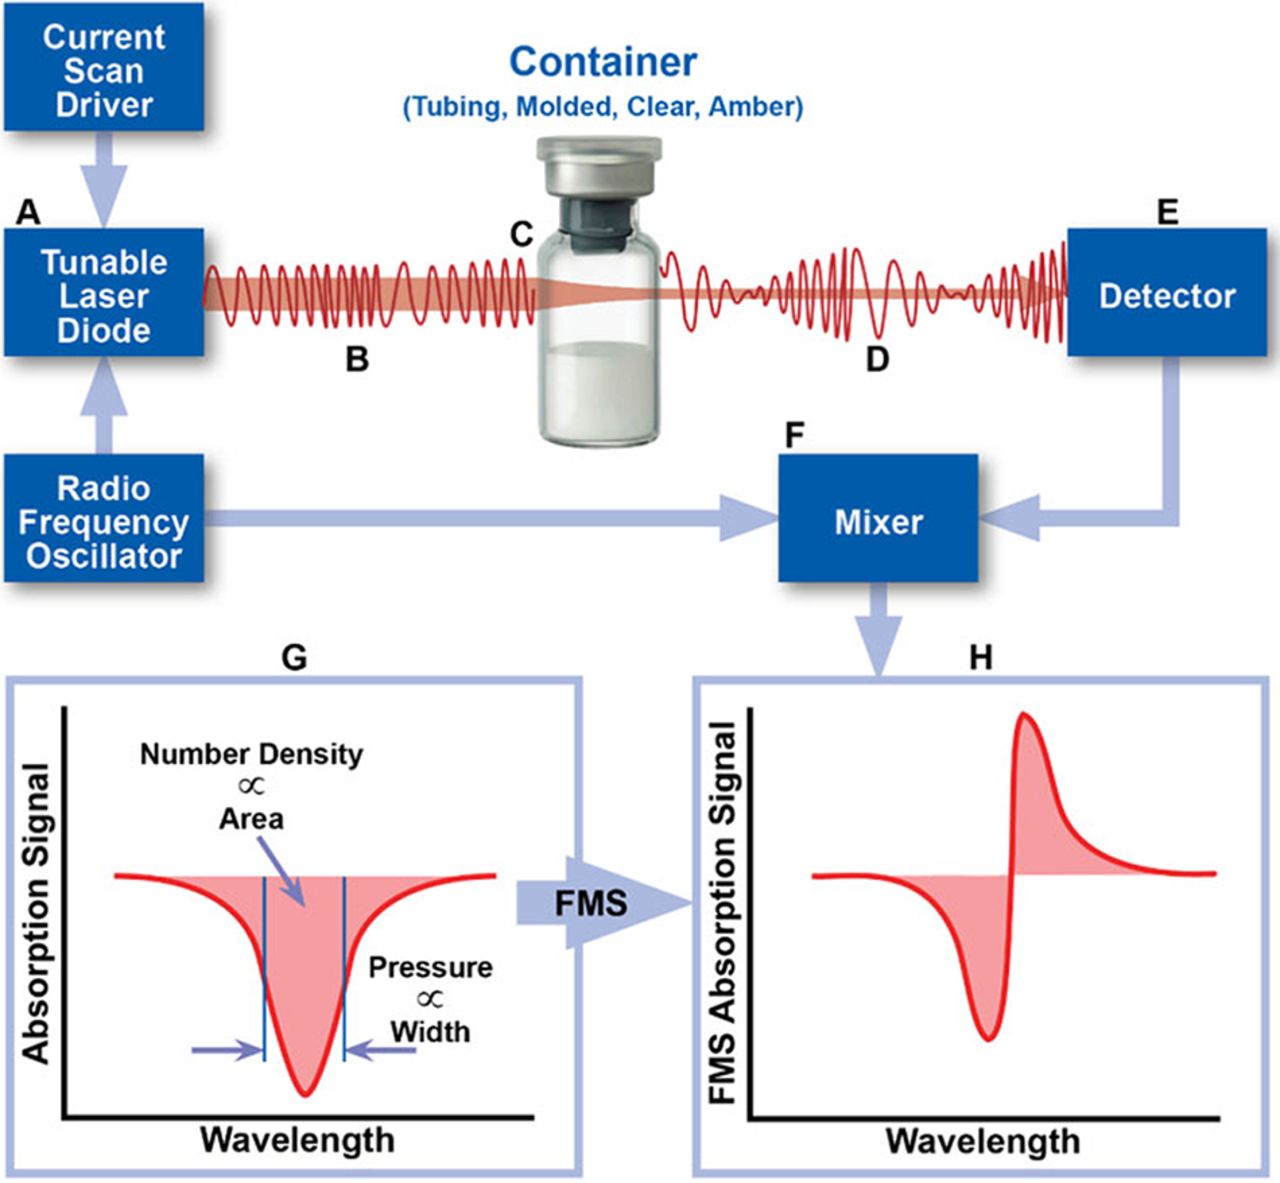
USP <1207>, Package Integrity Evaluation—Sterile Products, recommends several different test methods that can be used to evaluate the CCI of sterile pharmaceutical products, one of which is laser-based gas headspace analysis (6). In 2017, Victor et al. (7) demonstrated that laser-based headspace analysis can quantify gas ingress at room temperature into a parenteral package having defects of defined and undefined dimensions. This test method is deterministic (as opposed to probabilistic), rapid, nondestructive, and can be applied to a variety of optically transparent containers. In this method, the frequency of a near-infrared (NIR) semiconductor laser is modulated and swept across an internal rotational/vibrational frequency of the target gas molecule. As laser light passes through the container headspace, the number and frequency of the photons absorbed by the target molecule provide information about physical characteristics of the headspace such as target molecule density and total headspace pressure (8). Phase-sensitive detection techniques, such as frequency modulation spectroscopy (FMS), can be used to increase the limit of detection by 10,000× over direct absorption methods, allowing for trace amounts of gas to be detected (Figure 1).

Schematic overview of the measurement technique. The area and width of the FMS absorption signal can be used to determine the physical parameters of the headspace of a container, including gas number den-sity and total pressure. FMS, frequency modulation spectroscopy.
Headspace gas analysis has been used for many different applications in the pharmaceutical industry to date, including evaluating the CCI of freeze-dried products (9), detecting microbial growth in media fill vials (10), moisture mapping of lyophilizers (11), determining water activity in solid pharmaceutical samples (12), testing vacuum seal integrity (13), nondestructive headspace oxygen monitoring of oxygen-sensitive products (14), and even for studying the topic of interest here: the CCI of vials stored at −80°C (3, 15, 16).
In 2012, Zuleger et al. (3) observed an overpressure in live viral vaccines stored at −80°C after they were thawed to room temperature. Researchers determined this was a consequence of a CCI failure as described previously: the cold dense gas from the storage environment leaked into the vial headspace during cold storage after the rubber stoppers lost their elastomeric properties and became brittle. Once the vials were removed from cold storage and returned to room temperature (above the Tg of the rubber stoppers), the vial stoppers regained their elastomeric properties (2), thereby resealing the vial and trapping the cold dense gas inside the vial headspace. As the product vial increased in temperature, the pressure in the headspace increased proportionately. This phenomenon is an example of a temporary defect at the stopper–seal interface occurring while a package is stored at ultracold temperatures. These types of defects are difficult to detect and/or monitor with many of the common CCI methods, especially if the testing is being completed at room temperature and depends on the presence of an active leak path. Zuleger et al. (3) demonstrated that by using laser-based headspace gas analysis, temporary defects can be detected by observing changes in the headspace gas composition (oxygen and total pressure). The method can identify vials that did not maintain CCI during deep cold storage.
The observation of an overpressure being generated in the vial headspace illustrates the difference between a permanent and a temporary defect. A permanent defect is defined as a defect that either existed before the vial was placed into cold storage or a defect that is created by the cold storage and does not reseal itself after being returned to room temperature and continues to exist at all times. Conversely, a temporary defect, which was discovered in the research mentioned previously, is a leak path that only exists for a specific period of time (e.g., stopper pop-up before an aluminum crimp is applied to a vial) or under ultracold storage conditions (e.g., stopper shrinkage at −80°C). Note that many test methods that examine the integrity of vial package systems at room temperature, such as vacuum decay and high voltage leak detection (HVLD), are not able to identify this temporary type of CCI failure.
Although laser-based headspace gas analysis does not require the defect be physically present at the time the CCI test (CCIT) is completed, it does require that a detectable change in headspace gas composition occurs while the leak path exists (e.g., during the cold storage). This need for a detectable headspace gas exchange to occur may be considered an obstacle when using headspace analysis to identify CCI failures at deep cold storage temperatures, especially if the vial headspace gas composition and storage atmosphere are the same. For example, consider a package with an air headspace that is stored at −80°C in a freezer with an air atmosphere. If a temporary defect is generated during the cold storage period, nonsterile air will enter the package, thereby replacing the sterile air that was originally in the vial headspace. Even though there was gas exchange, because it is the same gas (air), a measurable change in gas composition cannot be detected (outside of a possible increase in headspace gas pressure if the vial reseals while warming to room temperature). If, however, a tracer gas is introduced into the storage atmosphere, then any exchange of gas between the nonsterile storage environment and the package will allow the tracer gas to enter the product package and will clearly indicate a loss of CCI. The use of a tracer gas allows for a breach in the CCI of a sealed container to be identified regardless of whether the defect is temporary or permanent and regardless of the initial headspace conditions of the container.
Nieto et al. (15) also used laser-based headspace gas analysis (carbon dioxide) to evaluate the CCI of frozen drug product; however, this research was carried out alongside a helium (He) leak test. The study included He leak rate measurements taken at several different storage and shipment temperatures with headspace gas measurements taken at room temperature after the vials had thawed. Although the He leak test can be a very sensitive development tool, headspace gas ingress has important advantages, including: it requires no sample conditioning (for the He leak test, He, the tracer gas, must be introduced into the package beforehand), it is nondestructive, it can be used to analyze actual product vials at storage temperature, and it has the ability to measure thousands of vials in a short amount of time, enabling the generation of statistical process and product quality data (17).
The primary objective of this study was to develop CCIT methods for detecting defects in unmodified headspace (i.e., air at 1 atm) product vials stored at −80°C using laser-based headspace gas analysis. The methods presented herein intend to introduce two alternative approaches, both employing carbon dioxide as a tracer gas. Carbon dioxide exists in very low concentrations in atmospheric air, and it is rarely used as a headspace purge gas, making it a good candidate as a tracer gas for identifying container leaks. Previous work by Caudill et al. (18) illustrated the use of carbon dioxide as a tracer gas to rapidly evaluate changes in the headspace composition of vials stored at room temperature before and after performing a pressure conditioning cycle.
These two CCIT methods were developed with a requirement that the product containers be exposed to carbon dioxide concentrations at greater than normal atmospheric concentrations for some minimum time during the −80°C storage. There are two typical cold storage environments that have very different levels of carbon dioxide. Vials stored on dry ice are exposed to high levels of carbon dioxide, whereas vials stored in conventional −80°C freezers are exposed to low levels of carbon dioxide. The carbon dioxide concentration in an air freezer can be increased to high levels by placing small amounts of dry ice alongside the product containers or flowing carbon dioxide gas to the storage environment. Because product containers stored at −80°C are often delivered to their endpoint via shippers containing dry ice, this sample “conditioning” requirement typically would not add an additional step to the leak test procedure; instead, the elegance of these CCIT methods is that the product shipment conditions can become part of the test protocol.
The first method described here considers the case in which product vials begin to leak in a −80°C storage environment that contains high levels of carbon dioxide (e.g., presence of dry ice or a freezer purged with carbon dioxide). Once the vials are placed into the freezer and the product packa-ge begins to cool, the vial headspace pressure will decrease in proportion to the temperature according to the ideal gas law, assuming the vials have maintained CCI (i.e., no leaks present). If a vial does maintain closure integrity and the vial reaches temperature equilibrium with the −80°C storage environment, the vial headspace pressure will reduce from ∼760 to 497 torr (1 to 0.65 atm). Note, if CCI is lost before temperature equilibrium occurs, the headspace pressure, at the time the leak develops, will be proportional to the vial temperature. If a leak develops at reduced temperature, a pressure differential will exist across the leak path and carbon dioxide gas from the freezer environment will ingress into the leaking vial. This increase in carbon dioxide can then be detected using laser-based headspace analysis to determine loss of CCI. This relatively fast gas flow process, known as effusion, occurs when there is a total pressure differential across the defect. Once the process of effusion is complete, and the headspace total pressure of the vial is in equilibrium with the freezer, gas flow will continue via diffusion. Diffusive gas flow is driven by the difference in carbon dioxide concentration (a partial pressure differential) between the vial headspace and the freezer environment and continues until the headspace carbon dioxide content of the vial is in equilibrium with the freezer (19).
The second method described here considers the case in which product vials leak in a −80°C storage environment that initially contains no carbon dioxide (e.g., air freezer). As described previously, the vial headspace pressure decreases as the temperature decreases. If a leak develops in this scenario, it results in air effusing into the vial headspace until pressure equilibrium with the storage environment occurs. If carbon dioxide is introduced to the storage environment after pressure equilibrium is reached (e.g., transfer of vials to a dry ice shipper or addition of carbon dioxide to the freezer atmosphere) carbon dioxide gas will flow through the defect into the vial headspace via diffusion.
For both of these CCIT methods, a leaking vial is identified by measuring an increase in headspace carbon dioxide content after a specified storage period in a carbon dioxide-enriched environment; no other sample conditioning or preparation is required. Both tests have the advantage that even small increases in carbon dioxide can be used as a marker for closure integrity failure. Measurements can be completed at room temperature or in the frozen state and do not require thawing of the vial for either method. Because diffusion is a much slower process than effusion and has a stronger dependency upon the defect geometry, the minimum storage period with exposure to carbon dioxide required to observe a given defect size will be significantly longer when compared with effusive gas ingress. However, it is important to recognize that any unobstructed breach in CCI, no matter how small, can still be identified; it is just a matter of the storage and exposure time to carbon dioxide required to allow a measurable change in the headspace carbon dioxide content of a vial with a particular volume and a particular defect.
As recommended in USP <1207>, these CCIT methods can both be developed and validated for use at different phases of the product life cycle including during package development, storage and shipping validation, statistical sampling of commercial batches, or as part of shelf-life stability protocols. For example, the inherent integrity of a package assembly should first be evaluated using empty versions of sealed containers that have been assembled on the production line. To evaluate whether the components (e.g., vial and stopper combination) and assembly process (e.g., crimping parameters) can robustly maintain closure integrity, these controls can then be tested with the storage (e.g., −80°C freezer) and shipping (e.g., on dry ice) conditions that mimic what will be required from the production samples. After the inherent integrity of a package assembly has been experimentally verified, product sample testing can be conducted to evaluate each production batch and perform required stability testing.
To summarize, the two CCIT methods differ only in whether or not the product containers are initially stored at cold temperatures in the presence of a carbon dioxide-enriched environment. If the initial cold storage environment contains carbon dioxide and the product vial develops a temporary leak, then an effusive pressure flow, followed by diffusive pressure flow (19), across the defect will exist and the carbon dioxide tracer gas will ingress into the headspace at a rate proportional to the effective defect area. This scenario includes the “flash-freezing” process that is frequently conducted with dry ice.
The second CCIT method would be used for perhaps the most common scenario during which the product containers are placed into −80°C storage freezers that have air atmospheres without the presence of a carbon dioxide-enriched environment. Here, product vials would need to be exposed to carbon dioxide at some point before headspace testing by adding dry ice, purging the freezer with carbon dioxide, or by moving a sample set to a dry ice cooler. This two-step process represents the “worst-case” situation in which the headspace total pressure and the freezer atmosphere come to equilibrium through the defect during this initial storage phase and subsequent exposure to the carbon dioxide tracer gas will ingress into the vial headspace only via diffusion.
In the following study, four types of defects were investigated. To mimic a defect at the stopper–seal interface generated by the cold storage, microwires were inserted between the rubber stopper and the landing seal of the vial. Defects in the vial body were simulated using certified laser-drilled holes. Two types of gross defects were used; the first type was generated by inserting a syringe needle through the rubber stopper of a crimp-sealed vial, and the second type was generated by punching a hole through the rubber stopper. Two vial types, one glass and one plastic, were tested as a way to examine material performance. To isolate the vial material as a variable, the same stopper was used throughout the study for both vial configurations. Finally, all vials were closed using the same crimp seal and crimping force.
Materials and Methods
Materials
Glass vials (ISO 2R Schott clear Type 1 tubing glass, Part #: VCDIN2R), plastic vials, (2 mL CZ polymer), and stoppers (13 mm FluoroTec Injection, Part #: INJ13TB3WRS) were obtained from Adelphi Healthcare Packaging; 13 mm aluminum flip-top caps were used for both vial types. Both empty vials and filled vials (phosphate-buffered saline [PBS]) were studied. PBS was obtained from ThermoFisher (Gibco), and all filled vials had a pH of 7.2. In order to have a roughly 50% fill in both vial configurations, the fills used for the glass and plastic vials were, respectively, 2 mL and 1 mL. Note that the total headspace volumes for the vials were approximately 3.9 mL and 2.3 mL for empty stoppered glass and plastic vials, respectively. Vials were filled individually using a Gilson pipetman. All samples were prepared under ambient atmospheric conditions so that the initial headspace gas composition was air (∼20.95% oxygen/78.09% nitrogen/0.93% argon/0.04% carbon dioxide) at a total pressure of ∼760 torr (1013 mbar). A pneumatic crimper (Kebby Power Crimp, Part #: A10026) was used to crimp all vials with a crimp pressure of 24 psi.
Negative controls (unmodified samples) consisted of glass and plastic vials with no artificially created defect, that were stoppered and crimped at 24 psi. Positive contro-ls with micron size defects consisted of laser-drilled defects in the glass vials; gross positive controls consisted of vials with either a 30G needle through the stopper or with a hole punched through the stopper. “Type” controls consisted of microwires at the stopper seal interface for both the glass and plastic vial configurations. “Type Defects” are described in USP <1207> Section 4.5.2 as representing realistic package flaws that, because of their inherent irregularity and complexity, cannot be assigned precise sizes and, thus, cannot be treated as certified positive controls (6).
The laser-drilled defects were fabricated and certified by Lenox Laser (Glen Arm, MD, USA). Defects of 2, 5, or 10 µm were located on different parts of the vials for the different methods studied. For the effusion procedure, the defects were located 5 mm from the bottom of the vial so that they were submerged below the 2 mL liquid fill. This was done specifically in an effort to evaluate the ability of the effusive CCIT method to identify defects below the liquid fill. Conversely, the laser-drilled defects were located 1 mm below the vial shoulder for the diffusive CCIT method study to place them above the 2 mL liquid level for the filled versions of the samples. To ensure that the liquid came into direct contact with the defect, these liquid-filled samples were intentionally inverted three times in a systematic manner immediately before storage.
Micron-sized tungsten wires were purchased from California Fine Wire Company (Grover Beach, CA, USA). Wires had outer diameters of approximately 15, 20, 41, 64, and 80 µm. Note that these wire diameters do not represent the diameters of the defects created when the wire is compressed between the stopper and the vial flange. This compression reduces the area around the wire to create submicron to micron effective flow diameters (see the Leak Rate Measurements and Defect Evaluation section for a discussion of the apparatus used to assess these type controls before use in the study). All microwire control vials were stoppered with approximately 1½ to 2 inches of wire placed between the stopper and lip of the vial so that one end hung inside the vial and the other end hung outside the vial. For microwire type controls that were filled, it was ensured that the section of the wire inside of the vial was not in direct contact with the liquid to avoid wicking effects. However, to evaluate if product interaction had an effect on carbon dioxide ingress through this type of defect, the vials were also inverted three times in a systematic manner immediately before storage to again ensure that the liquid came into direct contact with the defect at the stopper–seal interface.
One set of gross positive controls was prepared using fully assembled glass vial, stopper, and crimped packages by inserting a 30G syringe needle (Covidien, Monoject; inner diameter ∼159 µm) through the stopper. A second set of gross positive controls was prepared with the glass vials by using a 1.2 mm leather punch tool (SE, 7933LP) to put a hole in the stopper. The stoppers were then inserted into the vial, crimped, and the flip-top cap was removed to expose the hole.
Gross and laser-drilled positive controls were only prepared using glass vials. Microwire type controls and negative controls were prepared using both glass and plastic vial types. This was done in recognition that the speci-fic vial/stopper combination may affect whether or not the vials maintain CCI at these storage conditions, particularly due to the sealing relationship between the stopper and the vial. Because the laser-drilled controls serve to include a control with a well-defined (third-party certified) defect; the vial material for the laser-drilled defects was not considered consequential.
Methods
Leak Rate Measurements and Defect Evaluation:
The defect sizes in all the positive and type controls were verified with an independent leak rate measurement (LRM). In the case of the laser-drilled defects in the glass vials, the LRMs served to verify the defect sizes and validate the apparatus. In the case of the microwire type controls, the LRMs served to establish an effective defect diameter. All LRMs were acquired using an apparatus designed and assembled by Lighthouse Instruments comprising a vacuum pump (Thomas, Model #: 2688VE44), a piezo vacuum transducer (MKS Instruments, P/N 902B-42,020), and a 23-gauge syringe needle through which a vial is attached to the system. Prior to measuring the positive and type controls, a system check was completed using a negative control vial with no known defects to confirm that there were no major leaks present in the LRM system itself.
Before attaching the negative control vial, an initial atmospheric pressure reading was obtained for approximately 10 seconds. The vial was then attached to the apparatus, and a vacuum was pulled for approximately 5 minutes until the total pressure inside the vial stabilized below 8 torr (10.7 mbar), creating a ∼1 atm pressure differential across the defect. The vial was then isolated from the vacuum pump, and the pressure increase versus time was measured. The resulting pressure versus time curves were fit using a model developed at Lighthouse Instruments to determine a defect effusion parameter, αeff, which provides a single parameter that fully characterizes the time-dependent effusive gas flow (7, 18). When expressed in terms of  or [sccs], this effusion parameter, αeff, can be directly related to the “Air Leakage Rate” reported in Table 1 of USP 40 < 1207.1> Section 3.9. Therefore, by calculating the effusion fit parameter associated with the time-dependent pressure rise observed within a container, an “effective defect size” can be determined using the theoretical correlation between the “Orifice Leak Size” and “Air Leakage Rate” reported in Table 1 of USP 40 < 1207.1>.
The LRM apparatus was considered leak-tight if the calculated “effective defect size” was less than 0.50 µm for the system check with the unmodified 2 R vial. It is important to recognize that this 0.50 µm acceptance limit must take into account the virtual leak associated with adsorbed water disassociating from the internal vial surfaces and the rubber stopper. Additional work was done to verify that this observed pressure rise was a consequence of desorbing water (data not shown). This virtual leak establishes the minimum size defect that can be quantified by this protocol with this configuration of the LRM apparatus. The leak rate measurement procedure was repeated for each laser-drilled control vial and each empty microwire defect.
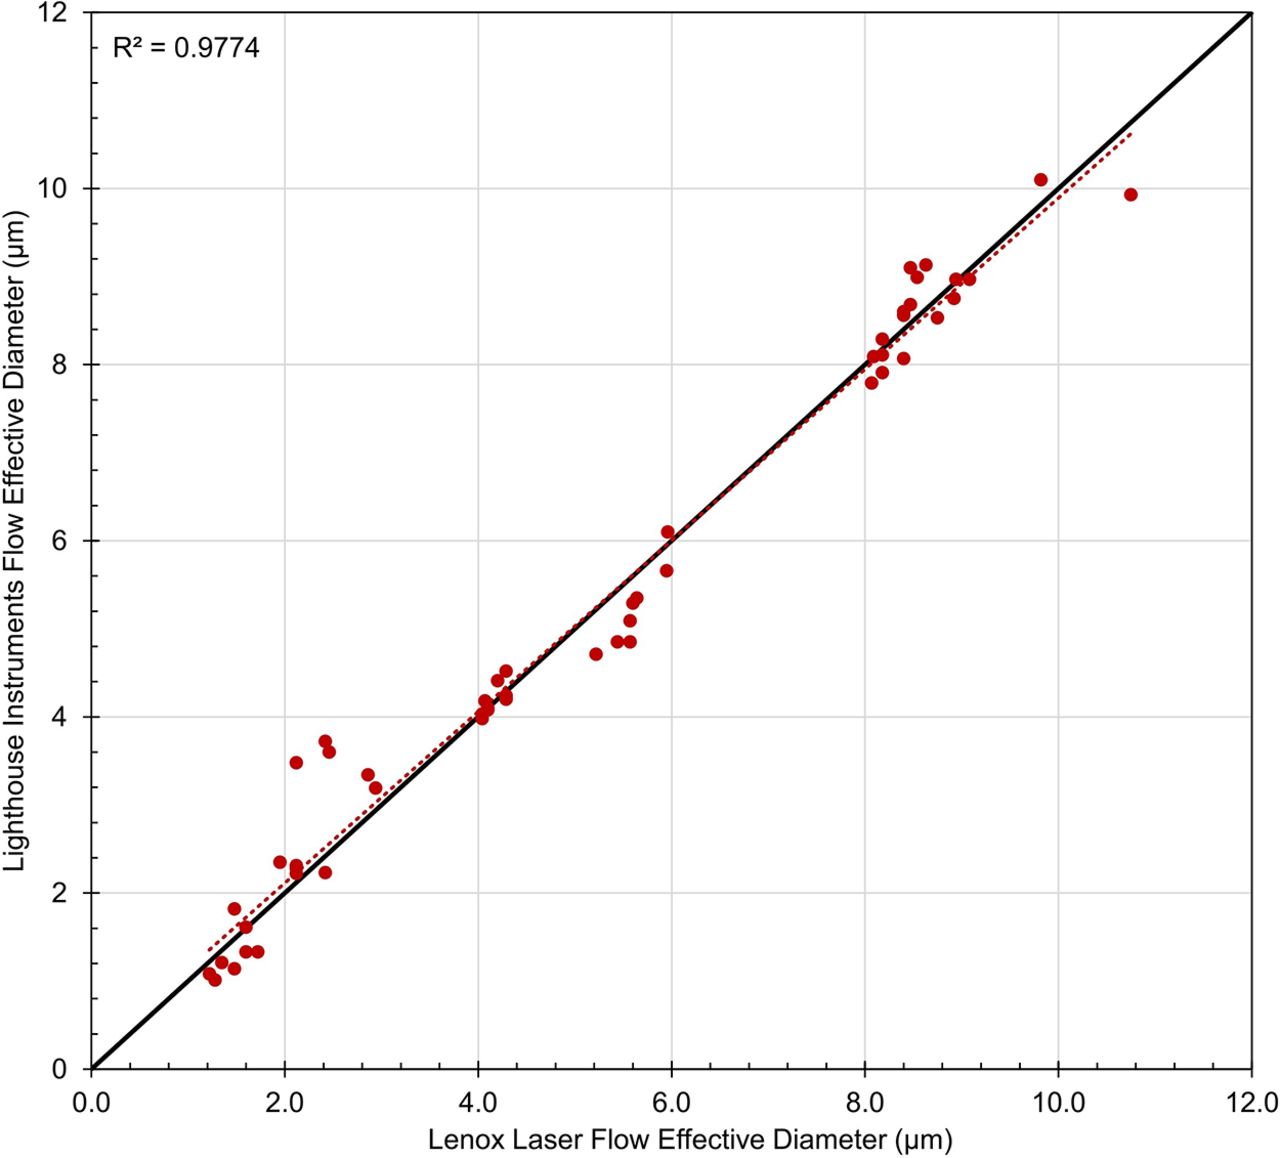
Leak rate measurements were performed on all empty laser-drilled vials both before and after completing each CCIT, including an initial measurement session to verify the defect sizes as listed on the calibration certificates provided by Lenox Laser. It was determined that, on average, before completing the CCITs, the diameters determined using the Lighthouse LRM system were within 0.2 µm of those listed on the Lenox Laser calibration certificates (R2 value > 0.977, Figure 2).

Flow effective diameters of the laser-drilled defects acquired by the Lighthouse Instruments LRM system as compared with those reported by Lenox Laser, before CCI testing. Each data point represents one measurement on each vial. The red-dotted line represents the fit of the data. The black solid line represents a theoretical R2 coefficient of 1. CCI, container closure integrity; LRM, leak rate measurement.
Leak rate measurements were also acquired on the microwire type controls (tungsten wires having outer diameters of 15, 20, 41, 64, and 80 µm that were placed at the vial–stopper interface, where cold storage temporary leaks occur). The effective defect diameter using microwires compressed between the stopper and the flange is less than the wire diameter and depends on several factors, including the crimp pressure and the particular vial and stopper combination. Several different crimp pressures were tested on both vial configurations (glass and plastic) used in this study. The goal was to create defect paths having flow rates compara-ble to 2, 5, and 10 µm defect diameters while also maintaining an acceptable crimp appearance (i.e., the crimp could not be rotated by hand and there was no observable dimpling). In addition, a small wire (15 or 20 µm in outer diameter) was used to determine if a very small defect (i.e., <1.0 µm flow effective diameter) could be distinguished from a negative control. The optimal crimp pressure was determined to be 24 psi for both vial configurations.
Table I summarizes the average flow effective diameters and leak rates for both vial types and each wire size. Note that the LRM values for the microwire controls represent measurements taken after completion of the CCIT (empty vials only) as to not intentionally introduce defects in the vials prior to storage through attachment to the LRM system.
Average Flow Effective Diameter and Flow Rate for Microwire Defects Created at the Stopper–Seal Interface Using a Crimp Pressure of 24 Psi for Both Vial Types (Glass or Plastic). N Represents the Number of Samples the Statistics Are Based on. NC Refers to the Negative Controls (Unmodified Vials)
Headspace Carbon Dioxide Measurements Using FMS:
Headspace carbon dioxide measurements were performed using a qualified FMS-Carbon Dioxide Headspace Analyzer, SN 756 (Lighthouse Instruments, Charlottesville, VA, USA). This instrument operates on the principles of FMS, employing a diode laser tuned to match a specific absorption wavelength of the carbon dioxide molecule. During a measurement, the laser wavelength is repeatedly scanned over the carbon dioxide absorption wavelength and successive scans are averaged to improve the signal-to-noise ratio. The resulting averaged and integrated FMS absorption signal is proportional to the headspace carbon dioxide number density.
Prior to the measurement session, the instrument was turned on and allowed to warm up for at least 30 minutes. Calibration was performed with certified flame-sealed carbon dioxide standards containing 0 and 550.4 torr (733.8 mbar) of carbon dioxide manufactured by Lighthou-se Instruments using National Institute of Standards and Technology (NIST) traceable gas mixtures. The two calibration vials and eight additional carbon dioxide standards (also fabricated with NIST traceable gas mixtures) at known carbon dioxide partial pressures and total pressures were each measured five consecutive times to verify the performance of the instrument, including its accuracy, precision, linearity, and limit of detection. This process was repeated for each measurement session. Table II shows data collected on the NIST traceable carbon dioxide standards. The measurement accuracy (the difference between the known NIST certified gas composition and the measured mean value for each standard) and the measurement precision (the standard deviation of multiple measurements for each sample vial format) were combined to define a total measurement error of ±1.5 torr (2 mbar) for the range between 0 and 90 torr (120 mbar) for both the 2R glass and 2 mL plastic vials. For partial pressures between 90 and 700 torr (120 and 933.3 mbar), the headspace carbon dioxide total measurement error was established as ±8 torr (10.7 mbar) for both the 2R glass and the 2 mL plastic vials. For the analysis of the sample sets presented here, the carbon dioxide content was measured once during the initial t0 time point and five consecutive times during each subsequent measurement session.
Representative Headspace Measurement System Performance Data on Flame-Sealed 4R Clear Tubing Vial Standards. Each Standard Was Measured Five Consecutive Times. The Error Is the Difference between the Mean and Expected Values. Min and Max Refer to the Minimum and Maximum Values of the Five Consecutive Measurements. The Linear Fit Coefficient of the System Performance Was Greater than 0.9999 over the Range of Carbon Dioxide Partial Pressures 0 to 700 Torr
CCIT Method—Effusion:
Prior to cold storage, baseline headspace carbon dioxide measurements (t0) for each vial were taken to confirm atmospheric conditions (≤1 torr or 1.3 mbar carbon dioxide). Vials were then placed in a −80°C Freezer (ScienTemp, Model #: 85-3.1 A) that had been preconditioned with 10 lbs of dry ice. The carbon dioxide-enriched environment was thus established before sample storage via sublimation from the dry ice. A visible bed of dry ice was maintained in the freezer throughout the sample storage period to maintain the carbon dioxide-enriched environment. Because the dry ice is continuously sublimating when stored at −80°C, its weight is constantly changing. However, as long as there is visible dry ice, the associated vapor pressure of carbon dioxide will be roughly 1 atm, as described in the pressure-temperature phase diagram for carbon dioxide.
Two identical sets of samples were stored, one to be removed after 7 days of storage and one to be removed after 30 days of storage. This was done to explore the time dependency of leak development (if any) as well as the time dependency of the method to detect a leak. After the appropriate storage time was completed, the sample set was removed from the freezer and allowed to thaw at room temperature for approximately 1 hour. After 1 hour, each vial was immediately measured five consecutive times on the FMS-Carbon Dioxide Headspace Analyzer. This procedure was repeated for the vials stored for 30 days.
An additional two sets of vials were stored for 7 days and 30 days in a −20°C freezer (Whirlpool, Model #: WZC3115DW) previously purged with carbon dioxide gas (Airgas, 99.9% purity) to determine the effect of temperature on the CCI of the vials, particularly at a temperature above the Tg of the rubber stoppers. These vials consisted of negative controls (unmodified samples) and gross positive controls and were measured using the same procedure as for the samples stored at −80°C. A ∼0.3 SLPM purge rate for the carbon dioxide gas was maintained throughout the sample storage period.
CCIT Method—Diffusion:
As with the effusion procedure, before cold storage, baseline headspace carbon dioxide measurements (t0) for each vial were taken to confirm atmospheric conditions (≤1 torr or 1.3 mbar carbon dioxide). Vials were placed in the same −80°C freezer (ScienTemp, Model #: 85-3.1 A) used in the effusion protocol, except with no dry ice initially present. The environment of the freezer was confirmed to contain less than 2 torr (2.7 mbar) of carbon dioxide before the samples were placed inside. This was confirmed by placing an uncapped vial in the freezer for ∼3 days, after which time the vial was stoppered, removed from the freezer, crimped, and measured on the FMS-Carbon Dioxide Headspace Analyzer. Three sets of samples were stored, one to be removed after 3 days of storage, one to be removed after 7 days of storage, and one to be removed after 14 days of storage. Once the vials were frozen (approximately 72 hours at −80°C), 10 lbs of dry ice were added to the freezer to create the carbon dioxide-enriched environment. The three respective storage periods began once the dry ice was added to the freezer. After the appropriate storage time was completed, the sample set was transferred to a cooler filled with dry ice so that the vials remained frozen as the measurements were acquired. Each individual vial was removed from the cooler and immediately measured five consecutive times, with no thawing period. After each frozen vial was measured, it was left at room temperature for approximately 4 hours and measured a second time. This procedure was repeated for each of the remaining sample sets for each storage period.
Residual Seal Force Measurements:
After completion of the diffusive procedure, residual seal force (RSF) measurements were taken on all vials using a Genesis Technologies Residual Seal Force Tester (Model: AWG1.0, Serial Number 152). Note that RSF measurements were not taken on the effusive sample set. The system was calibrated using a certified Mark-10 Digital Force Gauge. During the measurement session, a mechanical rod exerts a compressive force on the top of the cap (after removal of the flip-top) and stopper assembly. With the use of a cap anvil, this force is equally distributed over the aluminum crimp. The compressive force exerted by the rod is slowly increased until the stopper begins to become further compressed, at which point the aluminum cap moves downward and away from the underside of the vial land sealing surface. This represents the point at which the applied force exceeds the residual seal force of the vial stopper and is measured as the RSF. Genesis states that the RSF measurements are consistent within ±20% of the measured value. The RSF reported is an average of three measurements taken on each vial.
Results and Discussion
Results from Effusive CCIT Method Study
Table III summarizes the effusion sample set, including the set stored in the −80°C freezer and the set stored in the −20°C freezer. It is important to note the carbon dioxide-enriched environments of both freezers were established prior to storage of the samples. As the temperature of the vial headspace decreases, the total pressure within the sealed vial headspace will also decrease, as dictated by the ideal gas law, P = nkT, where n is the number density of the molecules. The pressure difference between the freezer environment and the partial vacuum within the vial headspace is what creates the effusive condition across the vial seal (or defect). If a defect already exists or develops as the temperatures of the vial components decrease, the initial presence of the carbon dioxide-enriched atmosphere ensures that the carbon dioxide tracer gas ingresses via effusion through the leak path.
Summary of the Effusion Sample Set. All Vials Were Prepared with ∼760 Torr of Air in the Headspace
The leak detection criterion for the CCIT method was determined by 1) evaluating the change in headspace carbon dioxide observed in the negative controls before and after storage; 2) quantifying the measurement precision of one of the flame-sealed standards containing a trace amount of carbon dioxide, LH-4R-1H (∼0.5 torr/∼0.7 mbar); and 3) taking into account the total measurement error (±1.5 torr/2.0 mbar for the range between 0 and 90 torr CO2 [120 mbar]) determined from the multiple system performance checks conducted during this study (20). Taken together, the leak detection criterion was set at 5 torr (6.7 mbar) for both vial configurations used in this study (2R glass and 2 mL plastic), meaning that a vial would need to have a change greater than or equal to 5 torr (6.7 mbar) of headspace carbon dioxide between the t0 and final storage time point to be definitively identified as a leaking vial. Note that permeation is not considered a leak, but over time it can lead to changes in the headspace carbon dioxide content (6).
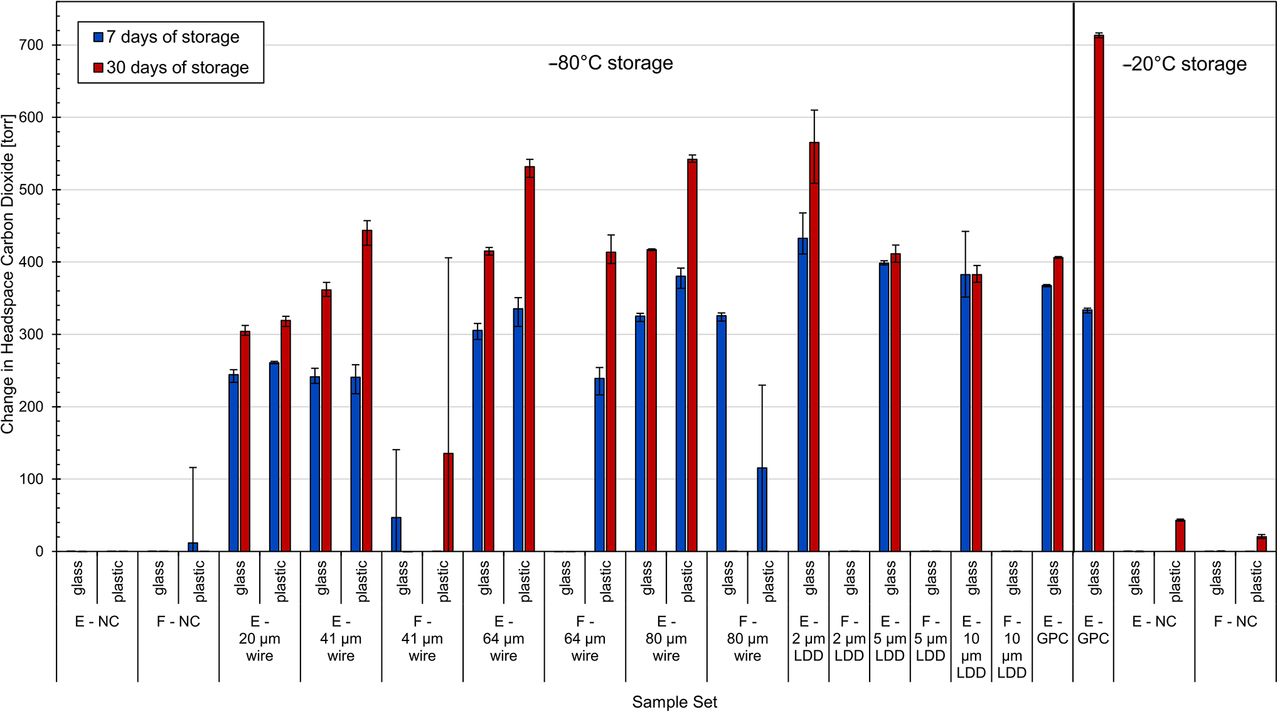
Table IV and Figure 3 summarize the results for the glass and plastic vials at both the 7-day and 30-day time points (thawed measurements). Referring first to the glass samples, the gross positive controls stored at −80°C were detected at each time point, confirming the carbon dioxide-enriched environment of the freezer for each storage period. All unmodified negative controls, empty and PBS-filled, maintained CCI during both storage periods, indicating that there was no time-dependency for leaks to develop over the 30-day period of this study for this particular vial configuration.
Leak Detection Results for Glass and Plastic Vials Subjected to the Effusive Procedure after 7 Days and 30 Days of Storage. Leak Detection Was Based on a Change Greater than 5 Torr between the t0 and 7- or 30-Day Time Points. Values Show the Number of Leaking Vials over the Number of Total Vials Tested for Each Sample Set

Change in headspace carbon dioxide content before and after being subjected to the effusive procedure. Values show the averages of five measurements on each vial within each group. Error bars represent the minimum and maximum range across each sample set. E, empty; F, filled; GPC, gross positive control; LDD, laser-drilled defect; NC, negative control.
Still referring to the glass sample set, empty vials with microwire defects were detected down to the Ø20 µm wire (effective defect size 0.4 µm), the smallest wire size tested, after both 7 and 30 days of storage. These samples were readily distinguishable from the negative controls with the headspace carbon dioxide increasing by roughly 300 torr, well above the leak detection criterion of 5 torr. Results for the PBS-filled type controls with microwires were more variable; three out of nine had greater than 5 torr of carbon dioxide at the 7-day time point, and one of nine at the 30-day time point (Ø41 µm wire). These results are not unexpected after recognizing that the presence of liquid in the defect path will affect the ability of headspace gas exchange to occur, particularly with storage conditions in which the product is frozen.
Similarly, all empty glass positive controls with laser-drilled defects were detected, down to 2 µm, the smallest defect size tested. The product-filled versions of the positive controls with laser-drilled defects (all below the liquid fill level) showed macroscopic cracks at the site of the laser-drilled defect as these positive controls warmed up to room temperature. The liquid fill likely entered the defect and expanded during the freezing/storage period, adding additional stress to the glass. The temperature of the glass increasing combined with expanded liquid in the laser-drilled hole presumably led to these fractures.
For the glass samples stored in the −20°C freezer, the gross positive controls showed high levels of CO2, indicating that the freezer had been successfully purged with carbon dioxide. Neither set of negative controls indicated any breaches in CCI at either time point. Because −20°C is above the Tg of the rubber stoppers, it is considered less likely that they would lose CCI at the stopper seal, because their elastic properties should be retained.
Referring now to the plastic vial samples in Table IV and Figure 3, there are a few notable results. Unlike the glass vials, one failure was observed in the filled ne-gative control sample set after 7 days of storage at −80°C; this vial contained 116 torr (∼154.7 mbar) of carbon dioxide. For the empty microwire plastic samples, the smallest microwire detected was Ø20 µm (effective defect size 0.6 µm), similar to that of the glass vials. The filled microwire samples once again had varied results. None of the product-filled Ø41 µm microwire samples were detected. All Ø64 µm microwire product-filled samples were detected at both time points; however, three of four Ø80 µm microwire product-filled samples were detected at the 7-day time point and zero of two were detected at the 30-day time point. In general, more of the product-filled plastic vial samples with microwire defects were detected when compared with their product-filled glass vial counterparts. This could be a result of an inconsistent splashing procedure or could also be due to differences in the adhesion interactions between the liquid and the glass/plastic vial surface.
Referring now to the −20°C data for the plastic vials, none of the unmodified negative controls had >5 torr carbon dioxide at the 7-day time point; however, at the 30-day time point, all negative controls contained >18 torr of carbon dioxide, above the leak detection criterion of 5 torr. Because this storage temperature is above the Tg of the rubber stoppers, this ingress could not be attributed to leaks caused by the stoppers becoming brittle. To further investigate, the vials were remeasured approximately 4 days later after being left in ambient laboratory air conditions (i.e., a low carbon dioxide environment), at which point they contained even more headspace carbon dioxide, ∼300 torr.
Polymers are known to have relatively high solubility and permeability coefficients compared with those of glass (21). There are a number of factors that, taken together, strongly suggest that the presence of carbon dioxide in the headspace of these controls was a result of carbon dioxide permeation through the body of the plastic vials and not due to a breach in CCI. First, all negative controls in this sample group exhibited similar behavior. Second, none of the controls in this sample group had any detectible headspace carbon dioxide at the 7-day time point; if carbon dioxide ingressed through a defect, the effusive flow rate would have resulted in a detectable amount of headspace carbon dioxide at this time point. Third, all of the glass negative controls stored at −20°C alongside the plastic negative controls showed no ingress of carbon dioxide, even though they were crimp-sealed with the same stoppers at the same crimp pressure. Fourth, the headspace carbon dioxide content of the plastic negative controls continued to increase after they were removed from the carbon dioxide-enriched storage environment.
The permeation rate for a given molecule through a particular material is strongly dependent upon temperature. It is thus hypothesized that during sample storage at −20°C, carbon dioxide absorbed into and permeated through the plastic vial. This permeation rate was such that after the 30-day storage period, the carbon dioxide gas had begun desorbing into the vial headspace. When the samples were removed from the −20°C storage, the carbon dioxide gas that had already been absorbed into the plastic vial began to more rapidly desorb into the vial headspace as the vial warmed up to room temperature and, thereby, increased the observed headspace carbon dioxide content at the later time point. Note that this same process is occurring with the plastic vials stored at −80°C; however, because permeation rates decrease exponentially with decreasing temperature, this physical process will occur much more slowly. For products that are shipped and stored on dry ice, this phenomenon is important to note, as carbon dioxide ingress into the headspace may affect its stability/potency.
Now returning to the effusion sample set as a whole. Because the process of effusion is relatively fast, the carbon dioxide ingress observed at each time point is most likely a result of both effusive and diffusive flow. The effusive process ends once the total pressure within the headspace of a leaking vial is in equilibrium with its surroundings (the freezer). At this point, the diffusive process continues if a carbon dioxide partial pressure difference remains between the vial headspace and the carbon dioxide-enriched freezer. This diffusive process will continue until the carbon dioxide partial pressures are in equilibrium. This seamless gas flow transition from effusion to diffusion was computationally demonstrated in a recent publication by Zeng (19).
Considering the leak detection criterion was established as a change of only 5 torr, the protocol could detect leaks, theoretically, much sooner than the 7-day and 30-day time periods tested. The longer storage periods were included in the study as a means of evaluating whether or not defects can develop at the rubber stopper interface over longer storage periods. With the limited number of samples for the different vial configurations tested here, there was no indication that the length of storage had any effect on leak development.
Though it was observed that one of the negative control samples of the 2 mL plastic vial configuration did fail, strong caution should be used in relying on this result to conclude that plastic vial configurations would, in general, perform worse than the glass vial configurations at these cold storage conditions; in fact, previous work has shown that polymer vials in general seem to perform better than glass vials with respect to maintenance of CCI during deep cold storage (19). First, the number of samples tested here was not statistically significant. Second, an extensive study to determine the optimal crimping parameters was not conducted; in other words, it is not known if the failed 2 mL plastic vial had CCI before it was placed into cold storage. In principle, a CCIT at room temperature could be conducted to verify that each sample had integrity before being placed into cold storage (18). However, this study was primarily focused on demonstrating the CCIT method itself, and was not intended to be an exhaustive study comparing vial materials or determining optimal stopper compression for these particular components. These studies would best be completed on a particular vial configuration using samples fabricated on the production line where the product is filled and capped. Additionally, the number of samples tested should represent a statistically valid sample set.
Contrary to this observation, it is speculated that plastic vials may be more suitable for cold storage applications because of a phenomenon known as polymer entanglement. This occurs because of the cold flow between polymers (e.g., of the rubber stopper and plastic vial) when they are stored at low temperatures, which may create a strengthened “bond” between the vial and the stopper (22).
Results from Diffusive CCIT Method Study
Table V summarizes the diffusion sample set. Note that these samples were prepared from the empty versions of the vials that were used during the effusive CCIT method study; however, all stoppers used to fabricate the samples for this diffusive CCIT method study were new. The gross positive controls were again included to verify that the CCIT methods were capable of identifying such defects as well as to confirm the freezer conditions. An additional set of gross positive controls (1.2 mm hole punch through the stopper) were included to represent a diffusive leak with a shorter path length, but greater diameter, than the syringe needle defects.
Summary of the Diffusion Sample Set. All Vials Were Prepared with ∼760 Torr of Air in the Headspace
To more closely simulate the typical storage conditions associated with production samples at current good manufacturing practices (cGMP) facilities, no carbon dioxide was present in the −80°C freezer when the samples for this diffusive CCIT method study were first stored. After the samples had been stored for 72 hours to ensure that they were at thermal (and, for samples with micron-sized or larger defects, pressure) equilibrium, a bed of dry ice was placed inside the −80°C freezer to generate a carbon dioxide-enriched environment. Because the samples were at thermal and pressure equilibrium, carbon dioxide would only enter the vial headspace via diffusion if a breach in the CCI of a particular sample existed. Once again, an increase in headspace carbon dioxide after completion of the storage procedure was an indicator of a leaking vial. The leak detection criterion for this procedure was established using the same procedure as the previous protocol and was also set at 5 torr.
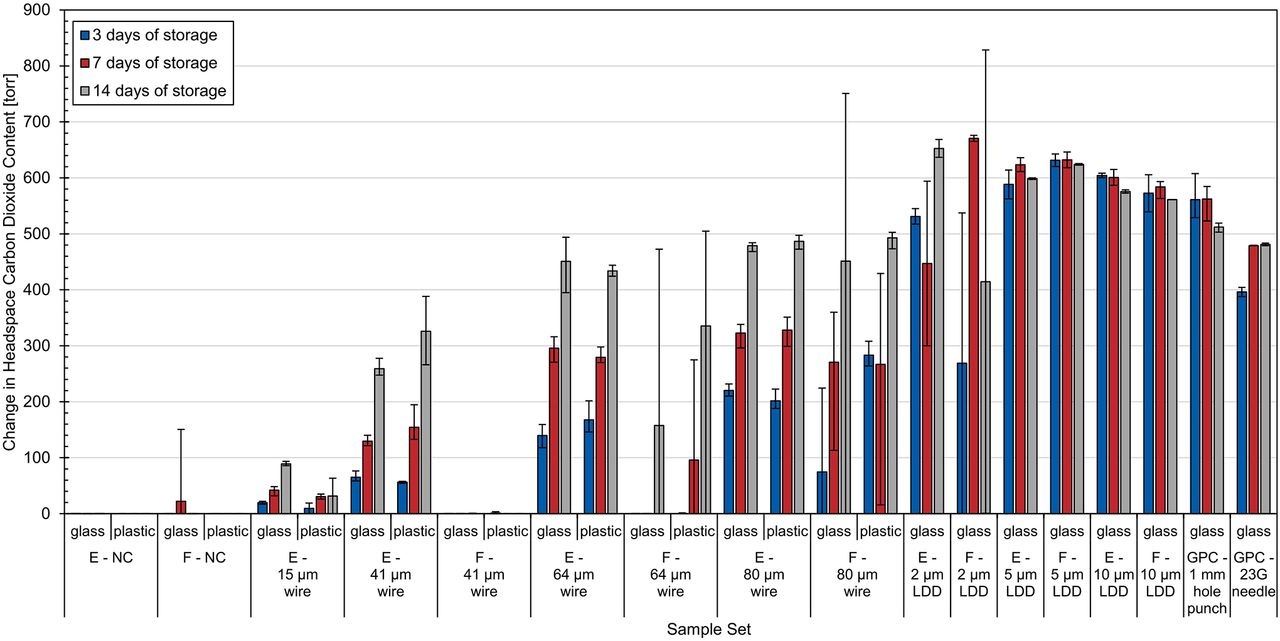
Table VI and Figure 4 summarize the results of the CCI diffusion protocol on the glass and plastic vials for each of the three storage periods (3, 7, and 14 days). Headspace measurements were acquired on the frozen vials roughly 3 minutes after being removed from −80°C storage; in other words, no significant thawi-ng occurred prior to the measurements. Note that the accuracy of the carbon dioxide measurement is not significantly dependent upon either the temperature or the total pressure of the vial headspace at the time of data acquisition for the temperature and pressure ranges of interest. Referring first to the glass set, both sets of the gross positive controls confirmed the carbon dioxide-enriched environment within the freezer at each of the three storage periods. As expected, the hole-punched positive controls contained a greater amount of carbon dioxide than the syringe needle positive controls due to their shorter defect length and larger diameter.

Change in headspace carbon dioxide content before and after being subjected to the diffusive procedure for both the glass and plastic vials. Values show the averages of five measurements on each vial within each group. Error bars represent the minimum and maximum range across each sample set. E, empty; F, filled; GPC, gross positive control; LDD, laser-drilled defect; NC, negative control.
None of the empty or filled unmodified glass negative controls leaked after 3 or 14 days of storage. However, as with the effusion procedure, there was one filled glass vial that did have an increase in headspace carbon dioxide after 7 days of storage (all empty vials maintained CCI after 7 days of storage). This filled glass vial contained 151 torr of headspace carbon dioxide when initially measured frozen. To gain further insight into this leaking vial, it was remeasured after being left to thaw at ambient conditions for approximately 4 hours. After 4 hours, the headspace carbon dioxide content had decreased to 62 torr, indicating that some carbon dioxide had egressed out of the vial. This is likely an indicator of a permanent defect, either existing before the test or being created as the stopper resealed in a different position, forming a leak path.
All of the microwire (Ø15, Ø41, Ø64, and Ø80 µm) defects in empty glass vials were detected after each of the three storage periods with an increase in carbon dioxide content over time. None of the product (PBS)-filled Ø41 µm microwire defects were detected after any of the storage periods. Only one of the PBS-filled Ø64 µm microwire defects was detected over all three storage periods (14 days of storage). The PBS-filled Ø80 µm microwire defects were also variable with one being detected after 3 days, all three being detected after 7 days, and two being detected after 14 days. Because the liquid-filled versions were intentionally inverted multiple times to ensure that the defect at the stopper seal was exposed to the liquid fill, these results suggest that frozen liquid product can inhibit the ability to identify a stopper–seal defect if it is able to fill the defect path (18).
All laser-drilled defects in empty glass vials were detected after each of the three storage periods. There was no correlation between their storage period and the headspace carbon dioxide content, as was observed for the empty microwire samples. Instead, all of the empty laser-drilled vials contained around the same amount of carbon dioxide, indicating that these types of micron-sized defects can be readily detected in as little as 3 days, a typical time vials are stored on dry ice during shipment. As previously mentioned, the defects for the laser-drilled vials in this diffusive CCIT method study were placed toward the shoulder of the vial instead of toward the heel of the vial as was done for the effusive CCIT method study. Although the defects were not located below the liquid fill, the filled laser-drilled defects had the liquid fill intentionally splashed across the defect before being placed into the −80°C storage, similar to the procedure used for splashing the microwire defects. All of the PBS-filled laser-drilled defects were detected at each of the three storage periods except for one of the 2 µm defects after 3 days of storage and one of the 2 µm defects after 14 days of storage.
The fact that the PBS-filled samples with laser-drilled defects were more likely to be identified than the PBS-filled samples with micron-sized wire defects after they both had been splashed with the liquid fill is most likely a consequence of the different geometries associated with these two different defect types. In particular, the effective path length associated with laser-drilled defects is most likely significantly shorter than that for the microwire defects at the stopper seal. Additionally, it is important to remember that the microwire defe-cts consist of two channels on either side of the wire. Because these results were obtained under diffusive conditions, these geometric differences in the defects will have more of an effect on the ability of the CCIT method to identify them.
Referring now to the plastic vials in Table VI and Figure 4, no breaches in CCI were observed for any of the negative controls after any of the three storage periods. There were variable results for the empty controls with the Ø15 µm microwire inserted at the stopper interface at the three time points, with only one vial being detected at the 3- and 14-day storage period and both vials being detected at the 7-day storage period. Again, this inconsistency is most likely a reflection of the variability of the defect size in the controls themselves (Table I) and not the method. Destructive leak rate measurements were conducted after the headspace measurements were acquired on these two Ø15 µm microwire defect samples that failed, and their effective defect sizes were determined to be less than 0.5 µm.
Number of Leaking Glass and Plastic Vials Subjected to the Diffusive Procedure after 3, 7, and 14 Days of Storage. Leak Detection Was Based on a Change Greater than 5 Torr between the t0 and 3-, 7-, or 14-Day Time Points. Values Show the Number of Leaking Vials over the Number of Total Vials Tested for Each Sample Set
The empty Ø41 µm microwire controls were detected partially after 3 days of storage (one of three samples) and completely after 7 and 14 days of storage. All empty Ø64 µm and Ø80 µm microwire controls were detected after each of the three storage periods. The PBS-filled microwire controls were again variable: only one of the Ø41 µm samples was detected (at the 3-day time point), none of the Ø64 µm microwire defects were detected after three days of storage, and two of three were detected after both 7 and 14 days of storage. All Ø80 µm microwire defects were detected after each of the three storage periods.
As with the effusion procedure, as previously mentioned, one of the 40 liquid-filled negative controls was identified as losing CCI across the three storage periods; however, this time it was a glass vial and not a plastic vial. With that being said, it does not appear, for these particular vial configurations, that one material performs better at −80°C. Additionally, there was no difference in being able to detect the different defect types among the three storage times that were considered.
RSF Measurements
Although USP <1207> mainly focuses on CCIT methods, it also covers package seal quality test technologies that can be used to assess the consistency of the sealing process. And although they do not provide information about whether or not a vial contains a leak, these seal quality tests are complementary to CCIT methods. One technology listed by USP <1207> is the Residual Seal Force (RSF) test. This test measures the compressive force exerted by the rubber stopper onto the vial after capping. The greater the stopper compression, the higher the RSF value.
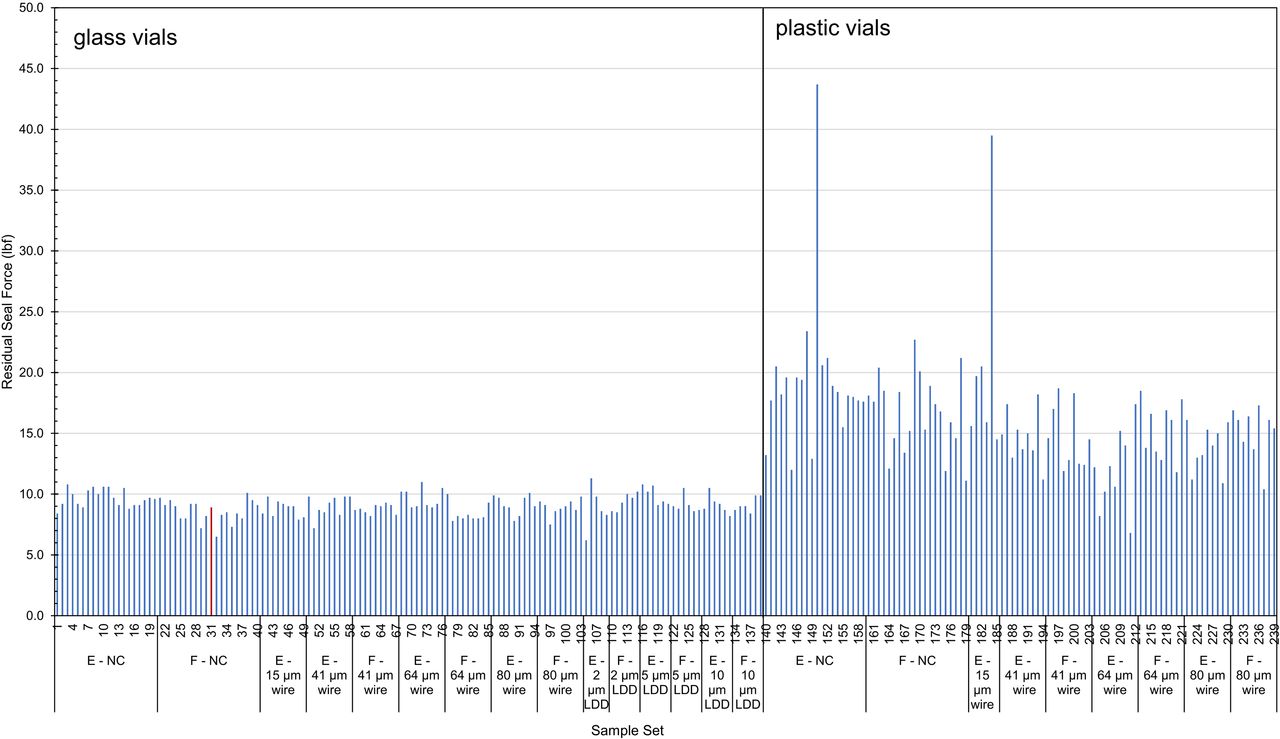
Figure 5 displays RSF measurements taken on the diffusive sample set after removal from storage. In general, the glass vials had lower RSF values when compared with the plastic vials, even though they were sealed using the same crimp pressure of 24 psi. This is likely a consequence of differences in the vial dimensions (i.e., the height and width of the landing seal) between the glass and vial configurations (23). The unmodified glass vial that showed carbon dioxide ingress after 7 days of storage is highlighted in red. This RSF value of 10 lbf was comparable to those of the other vials in this set, leading to no indication of CCI failure. There were two vials that had RSF values greater than 35 (both plastic vials). An additional measurement was taken on both of these vials, with no change in the results.

Residual seal force measurements on the diffusive sample set. The unmodified filled sample that contained carbon dioxide ingress after 7 days of storage is highlighted in red.
It is worth noting that if a pharmaceutical company wanted to directly compare the performance between two container configurations, it would be more appropriate to fabricate the crimp-sealed vials such that both configurations had equivalent RSF values instead of simply using a common crimp-sealing force. Because the focus of this study was simply to demonstrate the CCIT method itself, the additional effort required to obtain crimp-sealed 2 mL glass and plastic vial configurations that had the same RSF values was considered beyond the study scope.
Overall, the RSF measurements for the glass vials were much more consistent than those for the plastic vials (standard deviation of 0.88 and 4.8, respectively). Howe-ver, neither set of RSF measurements correlated to either the probability of CCI failure or to the amount of carbon dioxide ingress. These results support the proposition that although RSF tests can provide valuable information about the consistency of the crimp-sealing process for a production line, they cannot be employed as a direct substitute for a CCIT method.
Robustness Assessments of the CCIT Methods
As previously mentioned for the effusive CCIT method, the sample set was removed from the freezer and allowed to thaw at room temperature for 1 hour before measurements were acquired. Although measurements could also have been acquired immediately following removal from the −80°C freezer, allowing the samples to thaw, at least partially first, assesses the ability of the method to identify carbon dioxide ingress in the case that 1) measurements cannot be acquired by the analyst immediately after removal; 2) the number of vials is such that the acquisition of the measurements takes place over a period of time, in this case, 1 hour (assuming all vials are removed from the freezer and placed at ambient conditions at the same time); or 3) the product fill height is such that allowing the samples to thaw increases the headspace volume required to enable adequate transmission of the laser light (liquid products expand when in the frozen state, thereby decreasing the total headspace volume). Although the carbon dioxide content in the headspace will decrease as the leaking vial warms, this thawing period only decreases the measurement sensitivity and thus tests the robustness of the CCIT method.
For the diffusive CCIT method study, the headspace carbon dioxide measurements were conducted both while the product-filled vials were still frozen and again after the vials were allowed to thaw, this time for approximately 4 hours. This again illustrated several aspects of the general robustness of the CCIT methods, including those mentioned previously. Additionally, including the frozen measurements illustrates that the headspace carbon dioxide measurements are relatively insensitive to both the temperature and total pressure of the vial headspace; the sample temperature does not have to be controlled or known while executing the CCIT method.
Finally, the headspace results for both the effusive and diffusive CCIT method studies demonstrated that defects with an effective size ranging from the 2 µm laser-drilled defects to the 337 µm gross syringe defects can be readily and robustly identified over some time period after the samples have been removed from the cold storage conditions. Demonstrating this ability is important when conducting the CCIT method development for a specific container configuration, because the headspace carbon dioxide content will change over time for samples that have a breach in their CCI. By acquiring the measurements at two time points during the method development phase, as was the case for the diffusive procedure, the time period during which the headspace carbon dioxide content can be used to identify specific defects can be established and validated.
Safety Concerns
Because both of the CCIT methods presented herein rely on the creation of a carbon dioxide-enriched environment to condition the samples, it is important to evaluate any potential safety issues. As mentioned in the CCIT method descriptions, a visible bed of dry ice is maintained in the −80°C freezer. Roughly 1 lb/day of the dry ice is lost via its sublimation into carbon dioxide gas (∼250 L/day). Comparing this to the ∼2.3 lbs/day (∼574 L/day) that a typical individual exhales, this loss of dry ice should not present a safety concern for a well-ventilated laboratory. Similarly, because the ∼0.3 SLPM purge rate used for the −20°C freezer pushes ∼432 L/day of carbon dioxide into the surrounding environment, this conditioning of the −20°C freezer should also not present a safety concern for a well-ventilated laboratory. However, as an additional safety measure, carbon dioxide monitors should be installed within a laboratory wherever artificial means of carbon dioxide production exist.
Conclusions
The study demonstrates two different CCIT methods that utilize carbon dioxide as a tracer gas for detecting leak defects in vials stored at −80°C. The primary goal of this study was to demonstrate the ability of each method (“effusive” or “diffusive”) to identify a variety of different closure defects while differentiating from unmodified negative control vials. A particular challenge of detecting CCI failures for products stored at −80°C is that the vials may only leak while at the cold storage temperature and then regain seal integrity at room temperature. As a consequence, if the closure integrity of such vials is examined either before or after its −80°C storage, the temporary leaks associated with these CCI failures would not be identified by most traditional techniques. A major advantage of the headspace analysis technique applied here is that temporary leaks can be identified if a change in the vial headspace gas composition occurs.
Another advantage is that there is not an intrinsic minimum defect size associated with these CCIT methods. Any defect that allows an exchange of gas can be identified as long as the storage environment is different from the initial headspace conditions in the sealed container and an appropriate sample “conditioning” time is enforced. As a consequence, USP 40 Chapter <1207.1> Section 4.2.4 explicitly recognizes that the CCIT methodology of headspace analysis is capable of identifying defects that are smaller than what can be fabricated in a certified manner. However, the important caveat is that the defect must be capable of allowing gas flow such that the headspace gas content of the container can change. As the results in this study intentionally demonstrated, the presence of product can inhibit the identification of a breach if the product fill obstructs the leakage pathway. The potential of the product to inhibit the identification of a defect is an inherently probabilistic event that depends upon the defect geometry and location as well as the sample handling and storage history. Because quantifying these probabilistic events across the full spectrum of defect geometries and locations is problematic, it must always be acknowledged that the possibility exists that a given product may prevent the identification of a particular defect, regardless of the CCIT method that is employed.
It is important to note that changes in the headspace content of crimp-sealed containers will occur via permeation even when the container has maintained closure integrity. Permeation, a process that is explicitly defined by USP <1207> as not representing a leak, can readily occur through any rubber or plastic components of the package assembly, including the stopper and the walls of plastic containers. The changes due to permeation should always be evaluated for any CCIT method that utilizes headspace analysis. By including the appropriate negative controls, as demonstrated by the results presented herein, the effects of permeation for a given CCIT method can be readily quantified and distinguished from headspace changes generated by the presence of a breach in the CCI.
In conclusion, this study demonstrated that the use of carbon dioxide as a tracer gas in CCIT methods using headspace analysis provides a robust means of identifying both permanent and temporary defects in sealed containers that are stored and/or shipped at −80°C. By taking advantage of the carbon dioxide sublimating from dry ice, additional sample conditioning steps, such as applied vacuums or overpressures, are typically not required. The experimental results demonstrated that both the effusive and diffusive CCIT methods can robustly and readily identify unobstructed defects with an effective size about 1 µm at either the stopper–seal interface or in the wall of the vial. The primary difference between the two CCIT methods is simply that the diffusive method requires a longer sample conditioning period to observe a given effective defect size. As with all CCIT methods that use headspace analysis, there is not an intrinsic minimum defect size that can be identified with these approaches; instead, the minimum defect size that can be identified is limited only by the “conditioning” times defined in the CCIT method.
Conflict of Interest Declaration
The authors declare that they have no competing interests.
Acknowledgements
The authors would like to thank Derek Duncan, Michael Timmins, Josine Wilmer, and Paula Bracco.
- © PDA, Inc. 2022


