
Abstract
Leachables can potentially and adversely affect patient safety. Thus, drug products and medical devices are chromatographically screened for organic leachables (and extractables), establishing these compounds’ identity and quantity. Accurate quantitation of extractables and leachables is challenging given compound-to-compound variation in response factors. One proposed means for managing variation and improving quantitation accuracy is the use of retention time (RT) and structure to match analytes with their most relevant quantitation surrogate. Although the scientific basis for relationships between RT and structure versus response is unclear, the use of matching was investigated using databases of response factors (RFs) or relative response factors (RRFs), RTs, and structures for extractables/leachables. Gas chromatography with mass spectrometry (MS) detection was investigated as response variation in this technique is less than with other screening methods such as liquid chromatography with MS detection. The overall RF variation across RT and structure makes it difficult to establish whether RT and response or structure and response can be correlated. Rigorous statistical analysis of the data concludes that there are no discernible relationships between these quantities; however, casual visual examination suggests that subtle relationships might exist. The effect that RT or structure matching could have on quantitation accuracy was considered, presuming that the visual trends were real. Under this presumption, it was estimated that RT matching could at most improve quantitation accuracy by 25%, and that structure matching could improve accuracy by at most 50%. However, these improvements do not address the response variation that is independent of RT or structure, and thus it is concluded that RT or structure matching are not viable solutions to RF variation. Rather, it is recommended that databases of authentic RRFs be aggressively populated to provide accurate quantitation. Compounds for which authentic RRFs cannot be secured are most effectively quantified using the median RRF.
Introduction
It is well established that drug products likely contain impurities, termed leachables, derived from the drug product’s packaging system and/or manufacturing equipment. A patient being administered the drug product is exposed to such leachables, and it is through this exposure that the leachables might have an adverse health effect. Similarly, substances present in or on a medical device can leach from that device into the medium of contact between the device and the human body during the device’s clinical use. Exposure to device-related leachables could also produce an adverse health effect.
To establish patient exposure to leachables from drug products, packaging, or manufacturing systems, extracts or medical device contact media are tested (screened or targeted) for extractables and leachables to establish their concentration, and in many cases, identity. Chromatographic methods are typically used to discover, identify, and quantitate organic extractables and leachables.
One accepts as an operating premise that an analytical chemist charged with quantifying organic extractables or leachables will strive to produce concentration estimates that are appropriately accurate and precise. In the ideal circumstance of target analysis, in which the analytes of interest (typically few in number), the sample matrix, and the expected concentration range are specified upfront, highly accurate and precise concentration data can be obtained from an optimized and likely validated chromatographic method via calibration curves generated using:
An authentic reference standard for each analyte,
Calibration standards prepared in the sample matrix (matrix matching to account for matrix effects),
Calibration standards taken through the entire analytical process (so that process effects on the analytes are the same for samples and standards),
A concentration range encompassing the expected analyte concentration, bracketed using multiple calibration standards.
In contrast, there is the less ideal circumstance of screening analysis, in which an extract, drug product, or medical device is tested to establish the concentration (and identity) of all the analytes present in an extract or leachate (and not present in an associated analytical blank such as an extraction blank) above a certain threshold concentration (e.g., the analytical evaluation threshold, AET). In screening analysis, compared with target analysis:
The analytes of interest are not specified up-front,
The population of potential analytes is large,
The number of analytes surfaced can be large,
Authentic reference standards may not be available for each analyte,
The concentration of each analyte can be quite different (challenging the method’s dynamic range),
A standard method is applied to numerous test articles and samples matrices, where the method is not (and cannot readily be) optimized and qualified for each test article and sample matrix.
Thus, the means for providing highly quantitative data in target analysis are, from a practical perspective, unavailable to screening analysis.
There is, however, one circumstance in which quantitation in screening analysis is as accurate and precise, or at least nearly as accurate and precise, as it is in targeted analysis—universal response; that is, if all analytes had the same response factor (i.e., all analytes produce the same response when they are present in the sample at the same concentration). In this circumstance, a proper calibration curve could be generated for a single analyte and the curve would be relevant to and appropriate for all analytes.
Unfortunately, there is no combination of chromatographic separation and detection methods that achieves universal response. Thus, to achieve the same level of accuracy and precision as in target analysis, screening analysis would need to be supported by calibration curves generated for each and all possible extractables and leachables.
If the population of potential extractables and leachables was manageable, and if authentic reference standards could be obtained for each population member, the challenge of having a calibration curve for each potential extractable or leachable would be a challenge of resources (i.e., the time and effort required to generate the requisite calibration curves). Because the population of potential extractables and leachables is large, estimated in the tens of thousands, and authentic reference standards are not always readily available from commercial sources, this challenge of resources becomes insurmountable, and it is unreasonable to expect (or require) that quantitation in screening be capable of the same high degree of accuracy and precision that is achievable in target analysis.
Complicating the situation further, some extractables or leachables elude complete identification. Clearly, if a compound cannot be identified, it cannot be linked to its proper calibration curve, and if it cannot be linked to its proper calibration curve, its estimated concentration will invariably be less accurate.
Ultimately, the analytical chemist seeking to produce quantitative screening data finds the challenge daunting in the case of troublesome analytes; that is, properly identified extractables and leachables for which there are no authentic standards and incompletely identified (or unidentified) extractables and leachables.
One means of estimating concentrations for such analytes is linking them to a surrogate standard (SS). That is, the analyte is “quantified” assuming that its response factor is the same as the SS’s response factor. The accuracy of the “quantified” result depends on the agreement between the response factors of the analyte and the surrogate; the closer the response factors, the more quantitative the calculated concentration. As different analytes likely will have different response factors, the accuracy of the calculated concentration will be better for those analytes with response factors similar to that of the surrogate and will be worse for those analytes with response factors different from that of the surrogate.
When a single surrogate is used to quantify the entire population of extractables, the concentration estimates obtained will be variably accurate (or inaccurate depending on one’s perspective) because of the variation in response factors. In fact, it is reasonable to suggest that given response factor variation, “quantitation” via a single SS is not quantitative at all and at best provides a concentration estimate unless response factor variation is accounted for in some manner.
One “solution” to this problem is to use multiple surrogates and then link each analyte to that surrogate with the most closely matched response factor. This is called a “solution” because although it is effective in theory, in practice it begs the question of “how does one find the best surrogate for each analyte”?
Possible means that have been proposed (or perhaps required is the more correct term) for linking analytes to their proper surrogate include their retention time (RT) and/or chemical (structural) characteristics. RT matching is accomplished by dividing the entire chromatogram into RT windows, choosing a SS in each window and then using that surrogate to quantify all analytes within the same window. Structure matching is accomplished by establishing groups of analytes with the same structural features (e.g., aldehydes, ketones, alkanes, and so forth), choosing a SS in each structural group and then using that surrogate to quantify all analytes with the same structure.
This approach to surrogate matching presumes that there is a relationship between response and RT, response and structure, or response and the combination of RT and structure. And even if such a relationship exists, certain of these approaches suffer from fundamental and practical shortcomings. For example, structurally linking a surrogate to an analyte can only be accomplished if the structure of the analyte has been established, making it ineffective for certain partially identified and all unidentified compounds. Considering matching to the combination of RT and structure, the number of surrogates becomes prohibitive as the number of RT windows and structure classes increases. For instance, the circumstance of a chromatogram divided into four RT windows and the development of five structural classes requires that a total of 20 surrogates (one from each structure class in each RT window) be identified and used.
The purpose of this article is not to debate whether RT and response, structure and response, or RT/structure and response can be linked based on scientific first principles; rather this article considers experimental data, specifically compilations of analyte response factors, RTs, and structures. This article focuses on data obtained using gas chromatography coupled to electron ionization mass spectrometry (GC/MS-EI), as this method is commonly employed in extractables and leachables screening and because GC/MS response factors are less variable, compound to compound, facilitating the ability to recognize RT and structural correlations with response (the more variable are response factors, analyte to analyte, the more difficult it would be to visualize trends between analytes). Three response and RT databases will be examined, thereby managing and mitigating the possibility of intralaboratory bias.
Terminology
The response factor, RF, is defined in eq 1:
 (1)where:
Ra = the method response to an analyte a
Ca = the concentration of analyte a in the analyzed sample
Poorly responding compounds have a smaller RF value than that of more strongly responding compounds.
The relative response factor, RRF, is defined in eq 2:
 (2)where the subscript b refers to a second compound present in a sample, generally an internal standard (IS). Thus, the RRF is based on measured differences in responses between the IS and the individual compounds.
If Ca = Cb, (e.g., a standard prepared to contain equal concentrations of the analyte a and an IS b) then
 (3)
(3)
Situations in which compound a responds more poorly than compound b will produce a RRF <1, whereas situations in which compound a responds more strongly than compound b will produce a RRF >1.
It is noted that use of the RRF in quantitation has the significant advantage that it makes the quantitation independent of the choice of the IS.
The terms “internal standard” and “surrogate standard” are often difficult to differentiate. In this article, an IS is a compound that is added to all samples (and standards if standards are used) at a known concentration. At one level, the IS serves the purpose of adjusting an analyte’s response for sample to sample (e.g., injection to injection) variation in the analytical process; that is, the IS becomes compound b in eqs 2 and 3 and is used to calculate an RRF. At another level, the IS can be used for the purpose of quantitation of analyte a via eq 4:
 (4)
(4)
Alternatively, a surrogate (external) standard is an analyte present in one or more calibration standards. If the SS is present in a single calibration standard, the concentration of analyte a in a sample is given in eq 5, which is analogous to eq 4:
 (5)
(5)
If the SS is present in multiple calibration standards at different concentrations, the concentration of analyte a is established by putting its response Ra into the calibration curve generated from the SS’s calibration (standard) data.
The last circumstance to consider is the situation in which samples and standards have all been spiked with an IS. In this case, the quantity that is used for quantitation is not the response R but rather a relative response, RRa-IS of the analyte versus the IS in the sample and RRSS-IS of the SS versus the IS in the standard. Using an RR in the case of an R for quantitation produces eq 6:
 (6)
(6)
There is an unstated presumption in eqs 4 through 6, which is that the analyte a has the same response factor as the IS (eq 4) or the SS (eqs 5 and 6). Whether this situation is achieved or not, eqs 4 through 6 can be more generally written to include an adjustment for response factor differences between the analyte and the quantitation standard (either IS or SS), where the adjustment is the RRF. With the RRF adjustment, eq 5 becomes:
 (7)
(7)
Data
Database #1; Jenke and Odufu (1):
In this study, the response and retention behavior of 46 compounds was established—38 extractables routinely encountered by these authors in their extractables studies performed primarily on parenteral drug product packaging and 8 SS candidates. Authentic reference standards for these compounds were obtained, and cleanly eluting mixtures of these compounds were prepared as single point calibration standards. Standards were prepared at concentrations between 5 and 100 mg/L in a methylene chloride vehicle and were directly injected into a gas chromatographic (GC) system that split the column effluent between a flame-ionization detector and a single quadrupole mass spectrometric detector. It is the GC/MS results that are considered herein. Multiple injections of each standard mixture were made, and the analytes’ RTs and responses were recorded.
Database #2: Zdravkovic et al. (2):
In this study, the response and retention behavior of 154 compounds was established, using acetophenone-d5 as the SS. For all but one compound, authentic reference standards were purchased from well-known chemical suppliers, whereas the remaining compound was internally synthesized. Multi-compound working standards were prepared at 10 mg/L of the analytes and SS using ethyl acetate as the standard’s vehicle. Multiple injections of the working standards were made on multiple comparable GC/MS single quadrupole analytical systems to investigate the magnitude of response factor and RT variation as a function of practical laboratory variation such as system to system, column to column, and analyst to analyst.
The 154 compounds studied included a group of compounds that were amenable to derivatization, as derivatization is routinely used as a “cure” for analytical issues such as low response or poor peak shape. As derivatization adds another variable to the consideration of the experimental data (i.e., the completeness of derivatization, derivatization at multiple sites on the compound of interest), only the data obtained for the 97 underivatized compounds will be considered herein.
Database #3; Nelson Laboratories (3):
Since 2006, Nelson Laboratories has been developing an internal database that contains key analytical information for >6000 extractable compounds that were detected as, and are, extractables or leachables. This analytical information, acquired across Nelson’s orthogonal screening methodologies, was obtained through the analysis of authentic standards that were either purchased from well-known chemical suppliers, externally synthesized, internally synthesized, or internally isolated, purified and internally qualified. For GC/MS (single quadrupole) specifically, single-compound working standards were prepared for the majority of the compounds to contain 20–50 mg/L of the analyte and 10 mg/L of 2-fluorobiphenyl as IS, using dichloromethane as the standard’s vehicle. Single injections of the working standards were made on multiple comparable analytical systems with a Retention Time Locked method using the surrogate compound to lock the RT.
Results and Discussion
Before the individual databases are evaluated for RT and structure relationships, it is appropriate to acknowledge their differences in size, which ranges from as few as 46 compounds to as many as several thousand compounds. Although this difference in size is noteworthy, each database is relevant from two perspectives. Firstly, all three databases contain compounds of varying RTs, structures, and chemical properties and thus are independently appropriate for delineating RT and structure trends. Moreover, as they were independently generated, they provide the opportunity to corroborate trends observed in the data from within an individual database. That is, a trend observed in each dataset is likely a true trend and not merely an idiosyncrasy of a single dataset.
RT Matching
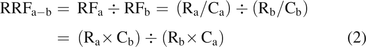
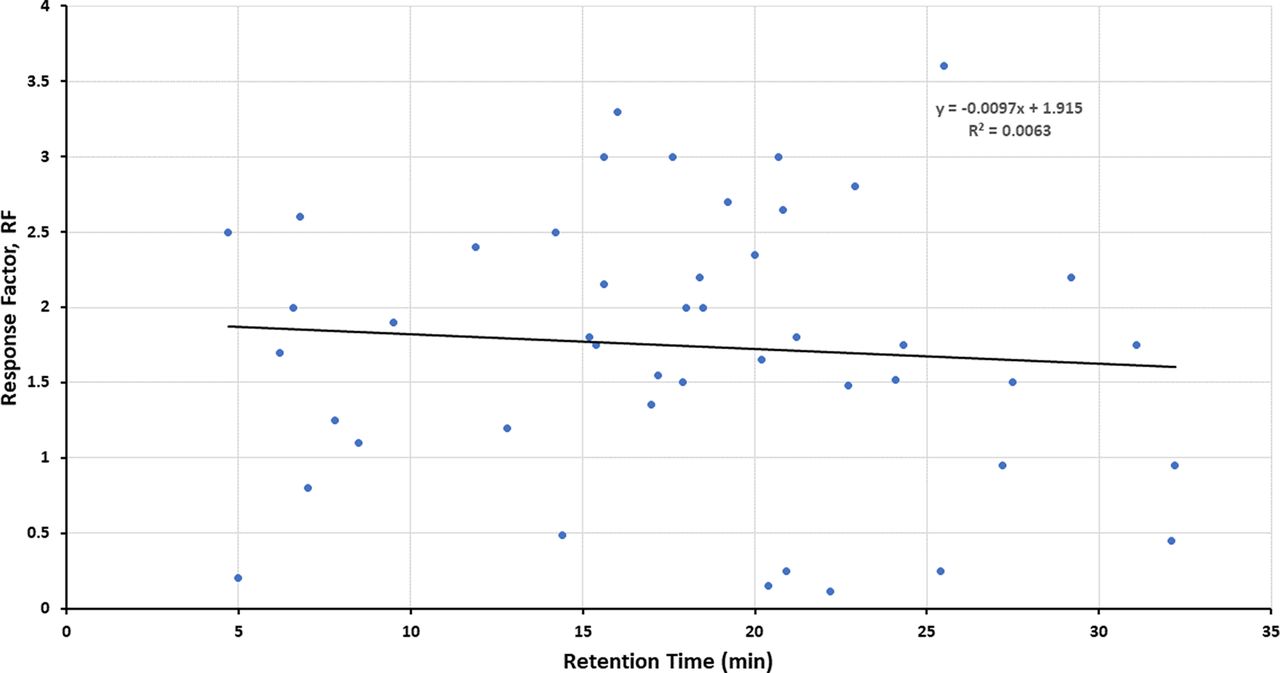
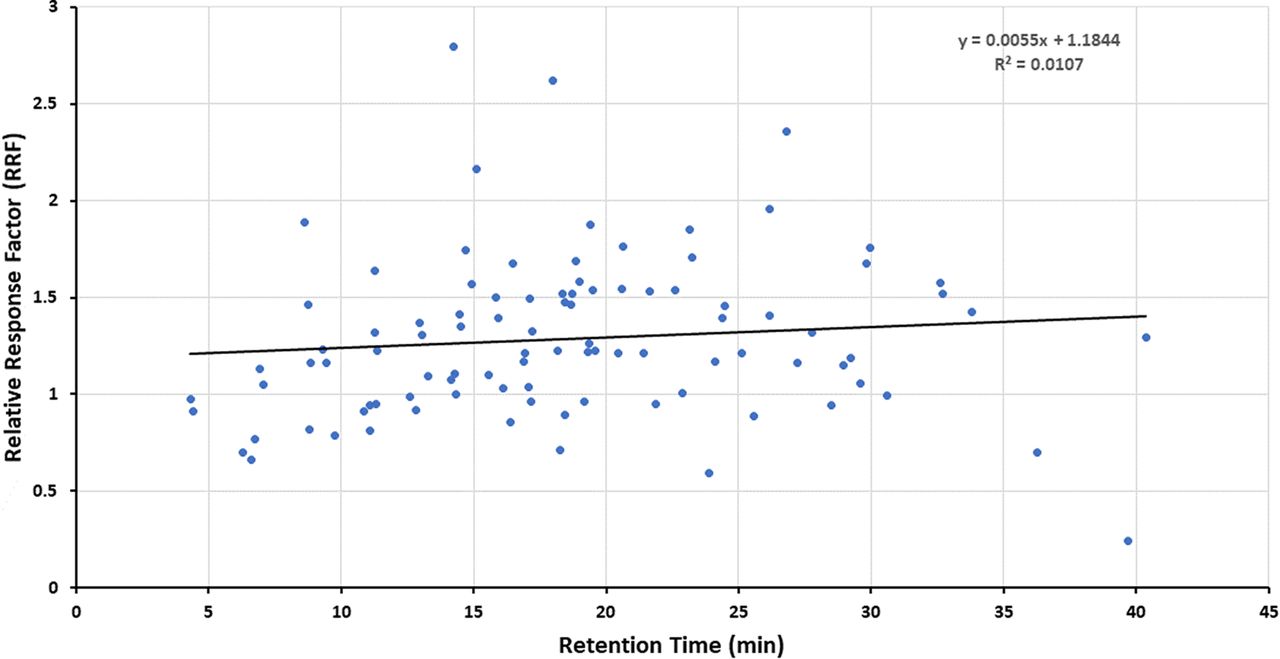
Figures 1–3 illustrate the distribution of RF or RRF values across the RT range for the three databases, thus allowing for visual assessment of trends. Given the variation in RF or RRF that is present across the entire RT range, it is difficult to visualize a trend in RF (or RRF) as a function of RT. “Smoothing” the data somewhat by performing a linear regression analysis suggests the possibility that RF (or RRF) and RT are correlated, although the magnitude of the change in RF (or RRF) versus the change in RT is small and not statistically significant. Furthermore, the regression lines for the Jenke/Odufu and Zdravkovic databases essentially cancel each other out, as the Jenke/Odufu regression suggests a very slight inverse relationship, whereas the Zdravkovic regression suggests a barely discernible direct relationship. Of course, the regression fit is quite poor in all three cases, as any slight correlation between RT and RF (or RRF) is masked by the much larger variation in RF (or RRF) at any given RT.

Distribution of response factors (RFs) for extractables and potential internal standards (46 compounds total). The relatively large variation in RFs for analytes that fall within a given retention time (RT) window makes it challenging to visually establish whether there is a correlation between the RF and the RT. Linear regression analysis of the data suggests that if there is a correlation, the change in RF is small over a relatively large change in RT. Data from Jenke/Odufu (1).

Distribution of relative response factors (RRFs) for underivatized extractables (97 compounds total). The relatively large variation in RRFs for analytes that fall within a given retention time (RT) window makes it challenging to visually establish whether there is a correlation between the RRF and RT. Linear regression analysis of the data suggests that if there is a correlation, the change in RRF is small over a relatively large change in RT. Data from Zdravkovic et al. (2).

Distribution of relative response factors (RRFs) for extractables (>2300 compounds total). The relatively large variation in RRFs for analytes that fall within a given retention time (RT) window makes it challenging to visually establish whether there is a correlation between the RRF and the RT. Although linear regression analysis of the data could suggest a visual correlation in which the increase in RRF is small over a relatively large increase in RT, this correlation is not statistically significant. Data from Christiaens et al. (3).
The clearest hint of a correlation between RF (or RRF) and RT is provided by the Nelson database. As noted in Figure 3, the best fit regression line suggests that RRF increases with increasing RT, although the magnitude of the change in RRF is again small and not statistically significant.
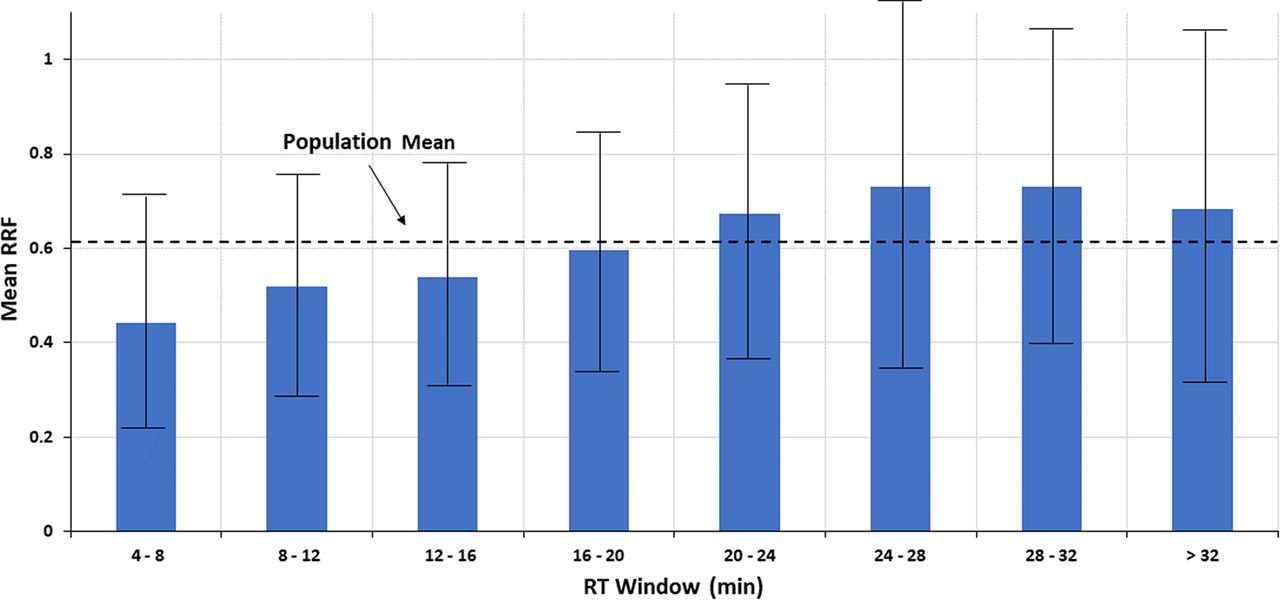
To better discern the correlation (if any), the RT range for the Nelson database was subdivided into eight RT windows, each roughly 4 min in width. The RRF values within each window, as well as for the entire RT range, were assessed to produce descriptive statistics such as mean, standard deviation (STDEV), median, and so forth. The descriptive statistics are shown in Table I and Figure 4. Both Table I and Figure 4 suggest that as RT increases, the mean of the RRF values within a retention window increases, albeit incrementally. However, again it is emphasized that any visual trend in the data is not verified by the underlying statistical analysis, which concludes that there is no statistically significant correlation between the two variables.

Trends in the mean relative response factor (RRF) taken over several retention time (RT) windows. When the data from Figure 3 is viewed in this manner, a possible correlation between RRF and RT is more readily visualized. However, the error bars, representing ± 1 standard deviation, clearly indicate that the variation in RRF between RT windows is less than the variation in RRF within an RT window, and thus that any visually inferred relationship between RRF and RT is not statistically verified. Data from Christiaens et al. (3).
Statistical Analysis of RRF Data for Compounds within a Defined RT Window
Thus, scientifically it must be concluded that RF (or RRF) and RT are not correlated.
Nevertheless, it is an interesting exercise to estimate the effect of the visual correlation of RF (or RRF) versus RT on quantitation accuracy, as such an exercise would establish the appropriateness of the quantitation strategy of “pick a SS in a given RT range and use that to quantify all the analytes within the range” without necessarily suggesting that such a correlation is scientifically valid. For example, consider the following two approaches to quantitation. In approach #1, an SS having a RT of 16–20 min (essentially “in the middle of the chromatogram”, which is a commonly employed strategy for choosing an IS or SS) and an RRF value equal to the RRF of that RT window and population mean (0.60) is chosen as a single surrogate to be used to quantify all compounds (thus, no matching of an analyte to a surrogate via RT or structure). The quantitation error produced by such an approach is greatest at the RT extremes; for example, if this surrogate were applied to an analyte in the lowest RT window (4–8 min) with an RRF that is exactly the mean of the RT window (0.44), then the analyte’s concentration would be underestimated by approximately 27%, [(0.60 – 0.44)/0.60] × 100% = 26.7%. Similarly, if this surrogate were applied to an analyte in the RT window with the largest mean RRF (24–28 min) and this analyte had an RRF exactly at the mean of this RT window (0.730), then the analyte’s concentration would be overestimated by approximately 22%, [(0.730 – 0.60)/0.60] × 100% = 21.7%. On the other hand, if the two compounds were quantified with SSs from within their respective RT windows, and if the SSs had an RRF equal to the mean RRF for the RT window, then both compounds would be quantified with a high degree of accuracy, emphasizing the benefit of proper SS selection. Thus, the maximum benefit of adopting the RT matching-based RRF approach is roughly a 25% increase in accuracy versus the commonly employed single SS approach, expressed as a percent recovery.
Moreover, it must be emphasized that although the above exercise suggests that RT matching could incrementally improve analyte quantitation in a relative sense, it does not, in and of itself, ensure accurate quantitation, as this exercise does not account for the variance in RRF within an RT window. For example, consider Table II, which lists compounds that elute in the RT window of 17.67–17.87 min. From Table I, the mean RRF in this RT window is 0.595. Use of this RRF for all the analytes in this RT window will improve the quantitation of all the analytes versus the use, for example, of a SS from the RT window of 4–8 min. However, even use of the RT-window specific RRF will not make quantitation absolutely accurate for analytes whose RRFs differ greatly from the RT window’s mean RRF. For example, consider three analytes in the RT window; triethanolamine with the lowest RRF (0.158), 1,3,5-tri-tert-butylbenzene with the highest RRF (1.445), and 4-butylbenzyl alcohol with the RRF closest to the RT window mean (0.577). Using the RT window’s mean RRF of 0.595 to quantify these three analytes results in triethanolamine’s concentration being underestimated by a factor of 3.8 (0.595/0.158) and reported at 27% of its actual value. On the other hand, 1,3,5-tri-tert-butylbenzene’s concentration will be overestimated by a factor 2.4 (1.445/0.595) and reported at 243% of its actual value. Only 4-butylbenzyl alcohol, with a concentration overestimated by a factor of only 1.03 (0.595/0.577), will be accurately quantified via the RT matching approach.
Overview of the Relative Response Factors, Determined with GC/MS, for the Semi-Volatile Compounds in the Retention Time Window of 17.67–17.87 Min. The Noted Compounds Represent the Extreme RRF Values, Which Differ by Nearly a Full Order of Magnitude. The compounds Are Noted In Italics
Thus, it has been concluded that if one accepts the visual suggestion that there is a correlation between RT and RRF (even though there is no statistical relationship illustrated in either Figures 3 and 4), the correlation is subtle and relatively large increases in RT are reflected in relatively small increases in RRF. Furthermore, it has been estimated that using RT matching of analytes and surrogates will improve quantitation accuracy by approximately 25% in the most favorable circumstances. Whether this level of improvement is sufficient to mandate that RT matching become required practice is surely open to debate. Firstly, there is no statistically verifiable correlation to begin with, and this whole discussion is based on a “what if” analysis. Secondly, as was noted via the previous examples, any incremental improvement in quantitation accuracy using the RT matching approach is small compared with the remaining inaccuracy due to variable RRF values within an RT bracket. That is, the improvement gained by matching analytes to an SS in the same RT window is small compared with the remaining error due to RRF variation within an RT bracket. Thirdly, in the authors’ opinion, a 25% error in an analyte’s estimated concentration has a minimal impact on the outcome of an assessment of the analyte’s potential impact. For example, consider a leachable’s potential patient safety risk. In the safety risk assessment, the leachable’s concentration is used to establish a patient’s daily exposure (DE) to the leachable, which is compared to the leachable’s tolerable intake (TI) to establish the safety risk. For example, the margin of safety (MoS) is calculated as the ratio of TI/DE. If DE is less than or equal to TI (MoS ≥ 1), then the leachable likely has a negligible adverse effect on patient safety. Given the uncertainties involved in establishing the DE and the TI, it is surely the case that the MoS is not so rigorously and precisely interpreted that the difference between a value of 0.99 and 1.01 is the difference between an extractable being safe or not. More likely, and more appropriately, it is (or at least should be) the case that as the MoS approaches a value of 1, better quantitation (e.g., target analysis) is necessary to definitively establish DE and thus perform an appropriately rigorous safety risk assessment.
Structural Matching
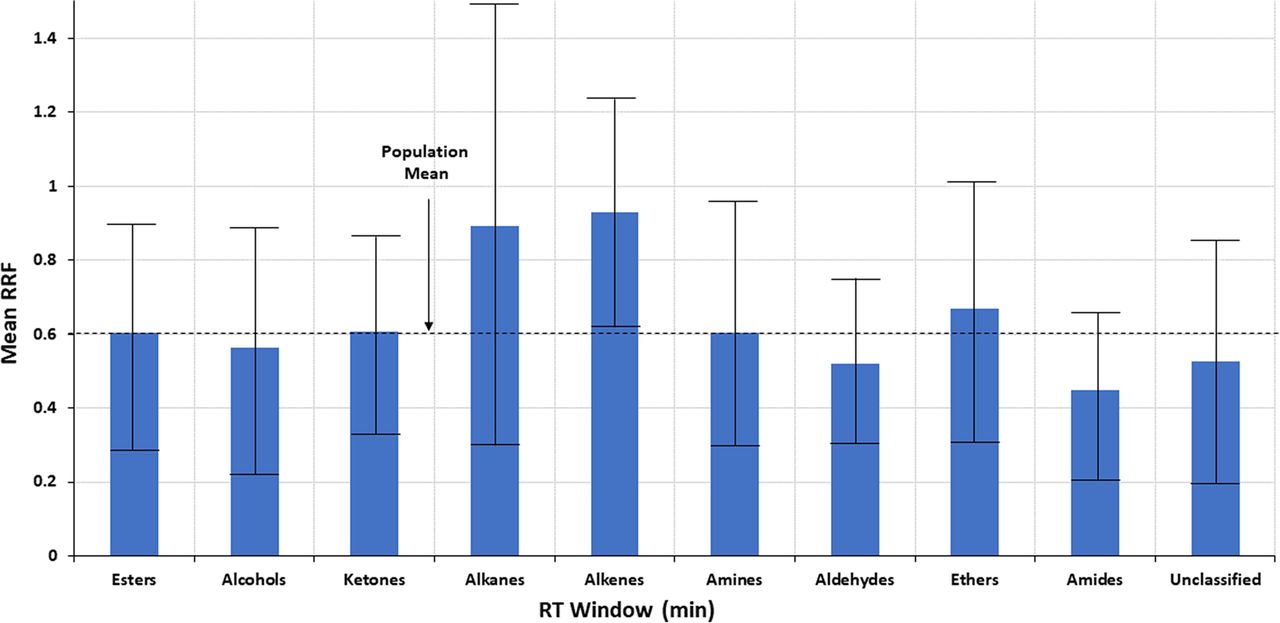
Testing the hypothesis that structural matching will improve quantitation accuracy requires a dataset larger than either the Jenke/Odufu or Zdravkovic databases. To test this hypothesis using the larger Nelson database, analytes were grouped into ten structural classes; esters, alcohols, ketones, alkanes, alkenes, amines, aldehydes, ethers, amides and other (unclassified). RRF values for the analytes within each structural group were statistically evaluated with the results noted in Table III and Figure 5. Although differences in mean RRF may be visibly discernible between the structural classes, the differences are generally no larger than the differences in RRFs for compounds that share the same structure and therefore are not statistically significant.

Trends in the mean relative response factor (RRF) for several compound classes. The error bars, representing ± 1 standard deviation, clearly indicate that the variation in RRF between compound classes is less than the variation in RRF within a compound class, and thus that any visually inferred relationship between RRF and compound class is not statistically verified. Data from Christiaens et al. (3).
Statistical Overview of the Relative Response Factors (RRF) for 10 Chemical Compound Classes
If one looks beyond the statistics and further explores the effect of any correlation between structure and RRF, the impact of structural matching on quantitation accuracy is estimated via the following example. This example considers quantitation using the most poorly matched structural groups; that is, the SS from the structure group with the lowest mean RRF (amides, mean RRF = 0.4475) is used to quantify an analyte from the structural group with the highest mean RRF (alkenes, mean RRF = 0.9307). The structural group’s mean RRF is used for the RRF of the surrogate and the analyte. In this case, the concentration estimated for the analyte would be approximately twice [0.9307/0.4475 = 2.08 times] its true value.
To put this in perspective, consider the error involved in quantifying analytes within the same structural class. The structural group alkenes is used as an example, as this group has the smallest intragroup variation in RRF. In this example, an alkene whose RRF is equal to the group mean (RRF = 0.9037) is chosen as the SS and is used to quantify alkenes with the lowest RRF (0.279) and the highest RRF (1.974). Such an approach produces a concentration that underestimates the concentration of the poorest responding alkene by a factor of 3.2 [0.9037/0.279, reported at 31% of its true value] and overestimates the concentration of the strongest responding alkene by a factor of 2.2 [1.974/0.9037, reported at 218% if its true value].
As was the case with RT matching, the improvement in quantitation via structure matching between structure groups is smaller than the quantitation error within a structure group, presuming that there is even a relationship between structure and RRF (a presumption that is not statistically verifiable).
Conclusions
RT and structure matching between SSs and analytes have been proposed as means of improving quantitation accuracy in extractables/leachables screening. RF and RRF databases have been examined to ascertain whether RF (or RRF) can be correlated to RT and/or structure. Given the variation inherent in RF and RRF values, establishing such correlations is difficult; although visual review of the data hints at a possible correlation between RF (or RFF) and both RT and structure, such a correlation is not statistically confirmed. Considering the visual interpretation only from the perspective of largest possible impact, the correlation between RF (or RRF) and RT is slight, and large increases in RT are linked to small changes in RF or RRF. Furthermore, differences in RF or RRF versus structure are also suggested visually.
Ultimately the authors come down on the side of science and statistics versus visual perception and answer the title question with a firm No, RT and/or structure matching themselves are not solutions to the challenge of providing quantitative data when screening for extractables and leachables.
Considering structure matching specifically, further clarification is warranted. It is important to understand that it is not the authors’ contention that a specific analyte cannot be matched to a specific surrogate, based on a detailed structural comparison, as a means of improving the accuracy of the specific analyte’s concentration determination. Rather, it is the authors’ assertion that generalizations that suggest that generically linking analytes to groups of potential surrogates based on gross functionalities (e.g., use an alcohol to quantitate an alcohol, a phthalate to quantitate a phthalate, or an antioxidant to quantitate an antioxidant) will improve the accuracy of the analyte’s reported concentrations are based on false presumptions about the relationship between response and structure and therefore that the generalizations are false.
For the purpose of discussion only, the visual relationships were considered to assess the largest possible effect of RT- and structure-matching on quantitation accuracy. In the most extreme case of the most poorly matched analytes and quantitation standards, accuracy improvement due to RT matching is about 25%, whereas accuracy improvement by structure matching is at most 50%. In either case, these improvements in accuracy across RT or structure groups, based on a presumption that is not statistically verified, is small compared with the remaining inaccuracies caused by variation in RF or RRF within groups.
It is the authors’ opinion that any incremental improvements in quantitation across groups, imagined or real, does not address the major quantitation concern, which is response variation within groups. Thus, we do not see the value in implementing either RT or structure matching in routine practice. Furthermore, we note that deciding to implement matching into routine practice faces the immediate challenge of picking the right surrogate within a group. Given the variation in response within a group, it would be quite easy to choose an RT- or structure-matched surrogate which, in fact, worsens quantitation accuracy.
Thus, the authors assert that:
Quantitative results can be obtained when the analyte is quantitated using an RRF value secured by analysis of an authentic reference standard. Testing labs are advised to create and aggressively populate databases of RRF values, by securing and analyzing reference standards, to ensure that the most commonly encountered extractables/leachables can be quantified with an authentic RRF.
For GC/MS, it is possible that semi-quantitative results can be obtained when the median RRF from the RRF database is used to quantify compounds for which authentic references have not been obtained (including unknowns), if one accepts the convention proposed by Jenke (4) in which a semi-quantitative result is one in which the accuracy is 50% to 200%. This is possible for GC/MS as the variation in RRF across the entire GC/MS data set is such that the percent relative standard deviation (% RSD) is approximately 50%.
Point 2 notwithstanding, there will be certain compounds, specifically those that are either very poorly or very strongly responding, for which the calculated concentration will not meet the accuracy requirements for semi-quantitation. For these compounds, reported results are concentration estimates.
Conflict of Interest Declaration
The authors declare that they have no competing or conflicting interests, noting their relationship with Nelson Labs, a provider of extractables and leachables testing and consulting services.
- © PDA, Inc. 2022
In This Issue


Jump to section
Related Articles
Cited By...
- Addressing Medical Device Extractables and Leachables via Non-Target Analysis (NTA); The Analytical Evaluation Threshold (AET) and Quantitation
- Correlating GC/MS Relative Response Factors to Analytes Physicochemical and Chromatographic Properties to Facilitate the Quantitation of Organic Extractables and Leachables in Non-Targeted Analysis (NTA). Concepts and Empirical Considerations
- Accurate or Protective: What Is the Goal of Non-Targeted Extractables and Leachables Quantitation and Identification?