
Background
Viral filtration is routinely employed as a viral clearance step for mammalian cell culture–derived therapeutic protein purification because the mechanism of action (predominantly size based) is applicable to a wide range of virus types and sizes (1). Virus filtration is considered a robust and effective step (2, 3) with a filtration standard currently in development (ASTM E55-04). Owing to the size-based mechanism of action, the concept of using minute virus of mice (MVM) as a worst-case challenge for viral filtration has been discussed at previous a Viral Clearance Symposium (VCS) (1) and in the literature (4). Although viral filtration is considered a well-understood unit operation and the potential exists for application of modular claims, some additional questions regarding the failure mechanisms have arisen as researchers have challenged the operating conditions with higher virus filter loadings (5, 6). These topics were explored in more detail during the Viral Filtration session at the 2015 VCS.
Session Overview
A range of topics was discussed during the session and subsequent question and answer session. During the 2015 VCS, the participants concurred that MVM would represent a worst-case scenario for virus filtration owing to the size of the virus (18–26 nm) (4). Several other key topics were discussed including the impact of the biophysical properties of the monoclonal antibody (mAb) (aggregates and hydrodynamics radius) reducing filter throughput, with a specific case study presented for Planova 20N. A presentation by Alexion highlighted the potential impact of buffer conditions (ionic strength and stabilizing agent concentration) on viral filtration capacity and fouling. These results were consistent with the observations presented by Rayfield (1, 7). These results highlight that many parameters, in addition to controlling the levels of process-related impurities (e.g., host cell protein [HCP], DNA) and residuals in the feed, can have a significant impact on the performance of the viral filtration step.
Investigation of Low Viral Filter Throughput in a mAb Process (Saravanamoorthy Rajendran, Bianca Olson, Ryan Tedstone, Anne Kantardjieff, and Rachael Alford; Alexion Pharmaceuticals)
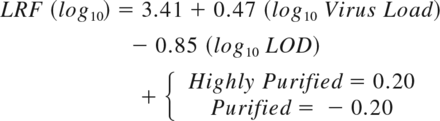
The viral filtration step is typically reproducible and is considered as a platform unit operation step for pipeline products, requiring little development for early-phase programs. However, for one platform mAb, the throughput on the platform viral filter (Virosart® CPV, a multilayer polyamide filter) was significantly lower than the minimum throughput required for commercial scale manufacturing (Figure 1). Figure 1 shows the viral filter throughput for the platform mAb using the platform viral filter. The data show that the throughput is much lower than the desired throughput of >100 L/m2 for the commercial processes with both xenotropic murine leukemia virus (xMuLV) and mouse minute virus (MMV) and the nonspiked control conditions. Investigation of multiple prefilters, product concentration, and salt concentration did not increase the viral filter throughput. This lower viral filter throughput was initially attributed to the presence of a higher level of HCPs in the viral filter load (∼200 ng/mg).

Flux decay versus throughput across the viral filter with higher HCP levels in the viral filter load. Red dotted line indicates the minimum throughput required for the commercial manufacturing process.
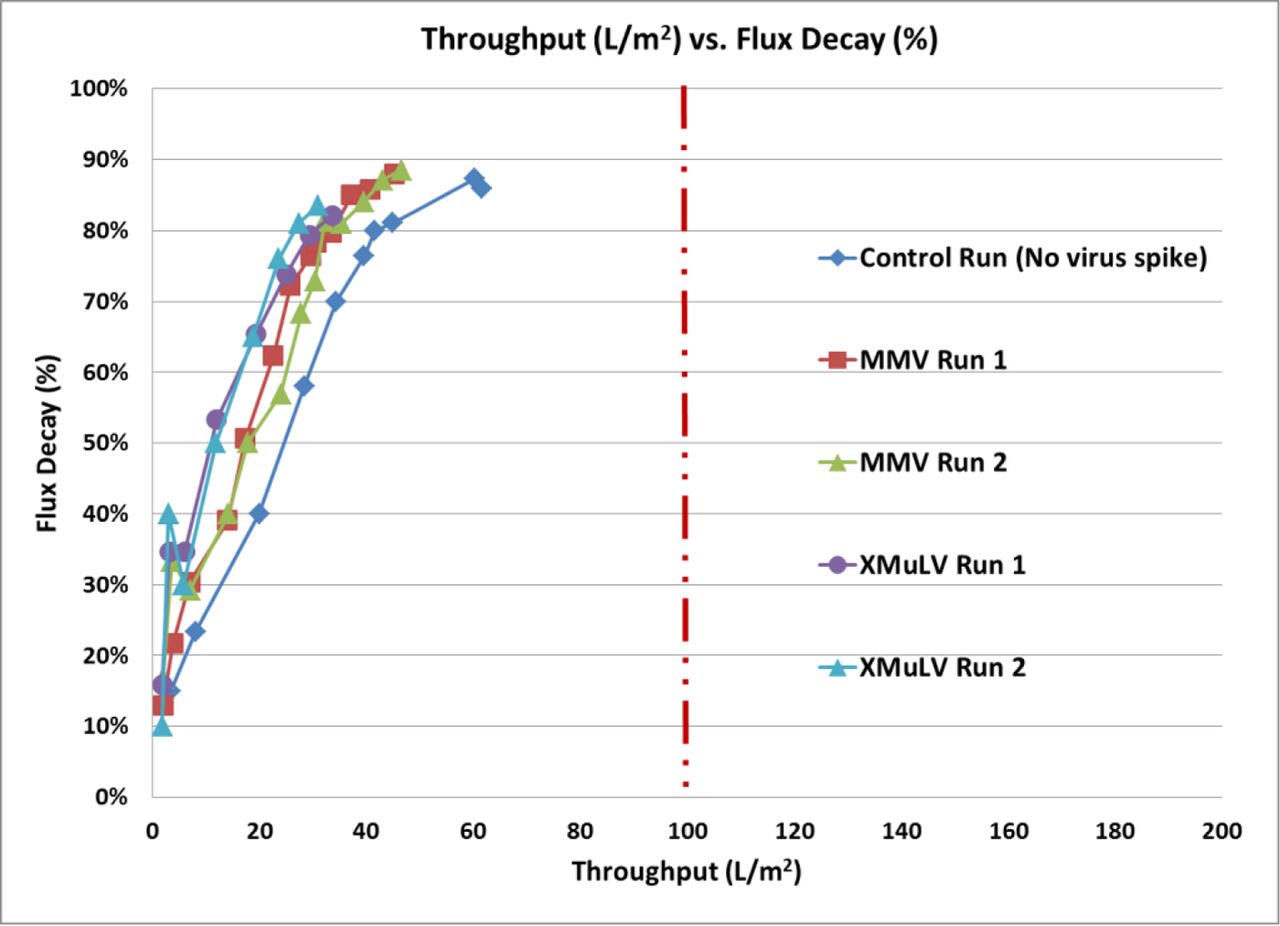
Therefore, additional process changes were implemented to reduce the HCPs in the viral filter load to <20 ng/mg. But the reduction of HCP in the viral filter load did not lead to an increase in the viral filter throughput (Figure 2). This led to the conclusion that the HCPs are likely not the root cause for the lower viral filter throughput.

Flux decay versus throughput across the viral filter in the process optimized for lower HCPs. Red dotted line indicates the minimum throughput required for the commercial manufacturing process.
Additional studies were performed to understand the low viral filter throughput for this antibody. An 18-run full-factorial design of experiment (DOE) was performed to evaluate the impact of prefilter type, load pH, salt concentration, product concentration, and the presence of a stabilizing agent on the throughput of the Virosart® CPV viral filter. Table I shows the parameters and the ranges evaluated. The pH of the viral filter load was varied between 5.5 and 7.6. Load material was adjusted to the desired pH, salt concentration, and stabilizer concentration and filtered using either Sartopore 2 0.1μm PES membrane filter or the Sartorius Virosart® Max prefilters. The Virosart® Max prefilter is a triple-layer polyamide filter designed to remove aggregates through hydrophobic interactions. The prefiltered feed was then loaded onto the Virosart® CPV 5 cm2 viral filter to a target load of ∼500 L/m2 at 30 psi inlet pressure. Output responses monitored in this study were flux decay across the Virosart® CPV viral filter, hydrodynamic radius, % aggregate, and particle count in the different viral filter load conditions studied.
Parameters and Their Ranges Evaluated
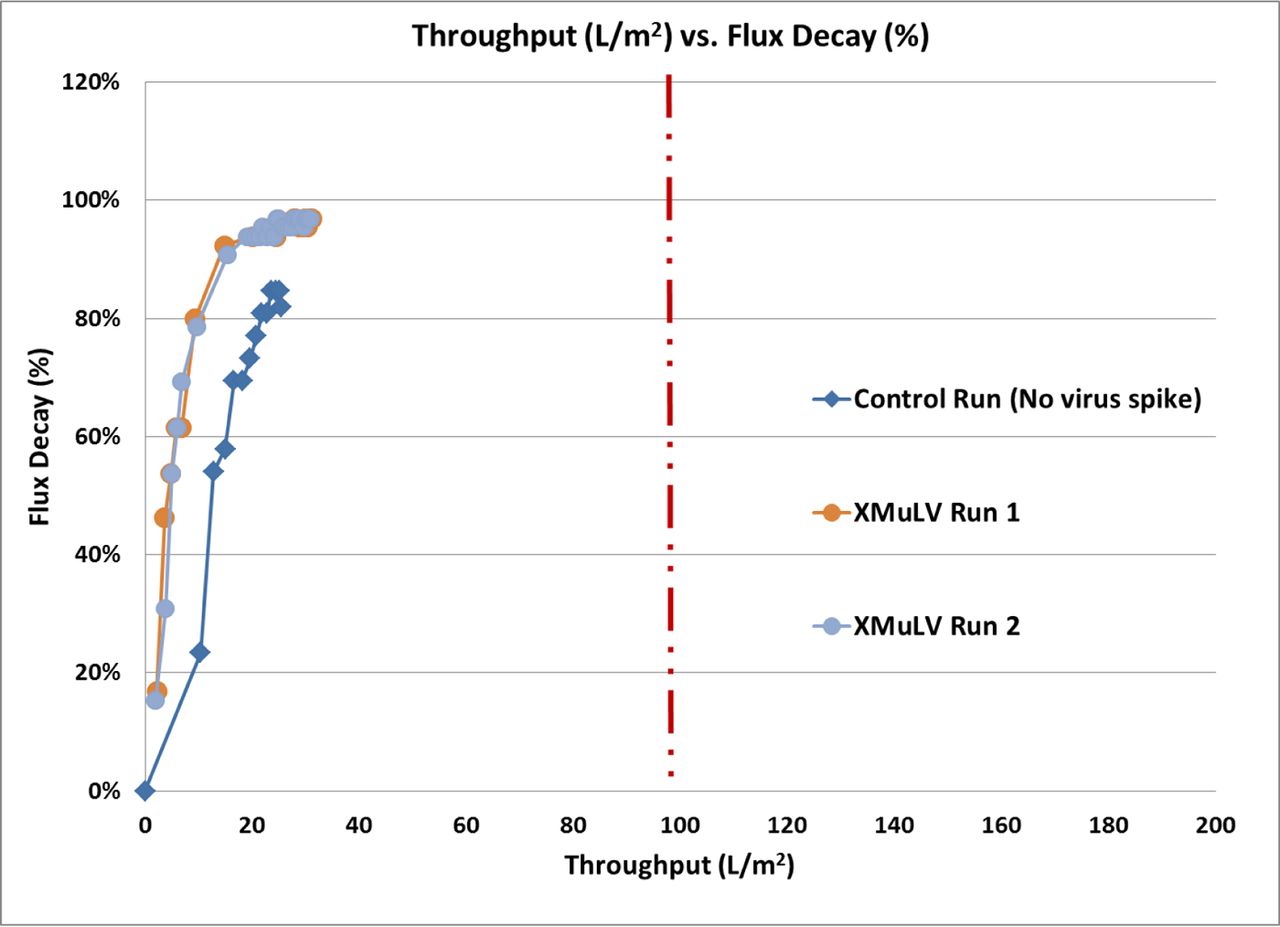
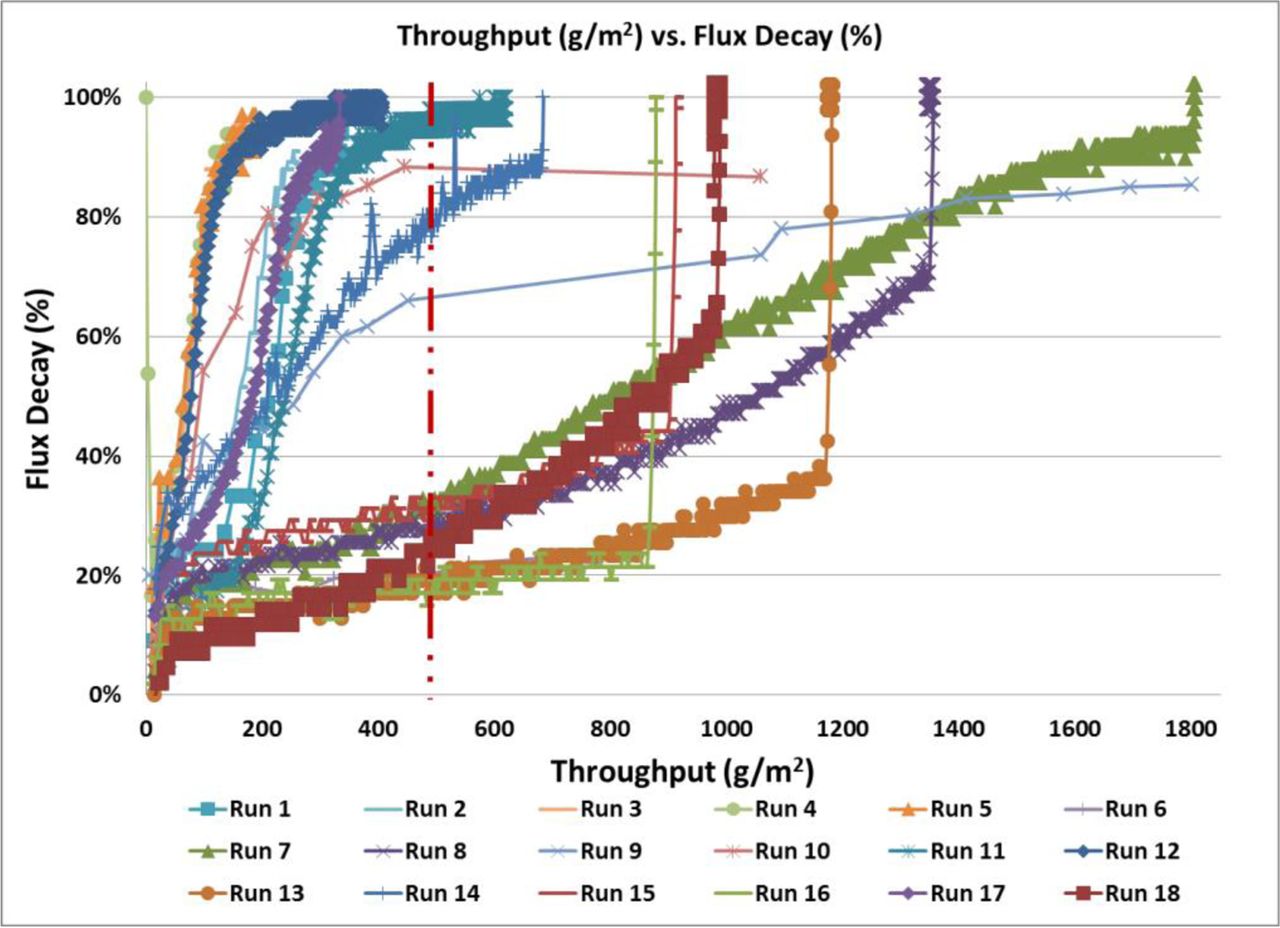
Figure 3 shows the throughput (L/m2) versus flux decay (%) and Figure 4 shows the throughput (g/m2) versus flux decay (%) on the Virosart® CPV viral filter for all runs performed as part of the multivariate DOE experiment. The data show that a significant increase in viral filter throughput was observed in certain conditions of the multivariate study (>8-fold increase) in comparison to the control condition (Run 10). Runs 6, 7, 8, 13, 15, 16, and 21 exceeded the minimum throughput required for commercial manufacturing process (>100 L/m2 or >500 g/m2 at 50% flux decay). These conditions were all run with the Virosart® Max prefilter under different pH, salt, and stabilizing agent concentrations.

Throughput (L/m2) versus flux decay across the viral filter under different conditions tested in the DOE study. Red dotted line indicates the minimum throughput required for the commercial manufacturing process.

Throughput (g/m2) versus flux decay across the viral filter under different conditions tested in the DOE study. Red dotted line indicates the minimum throughput required for the commercial manufacturing process.
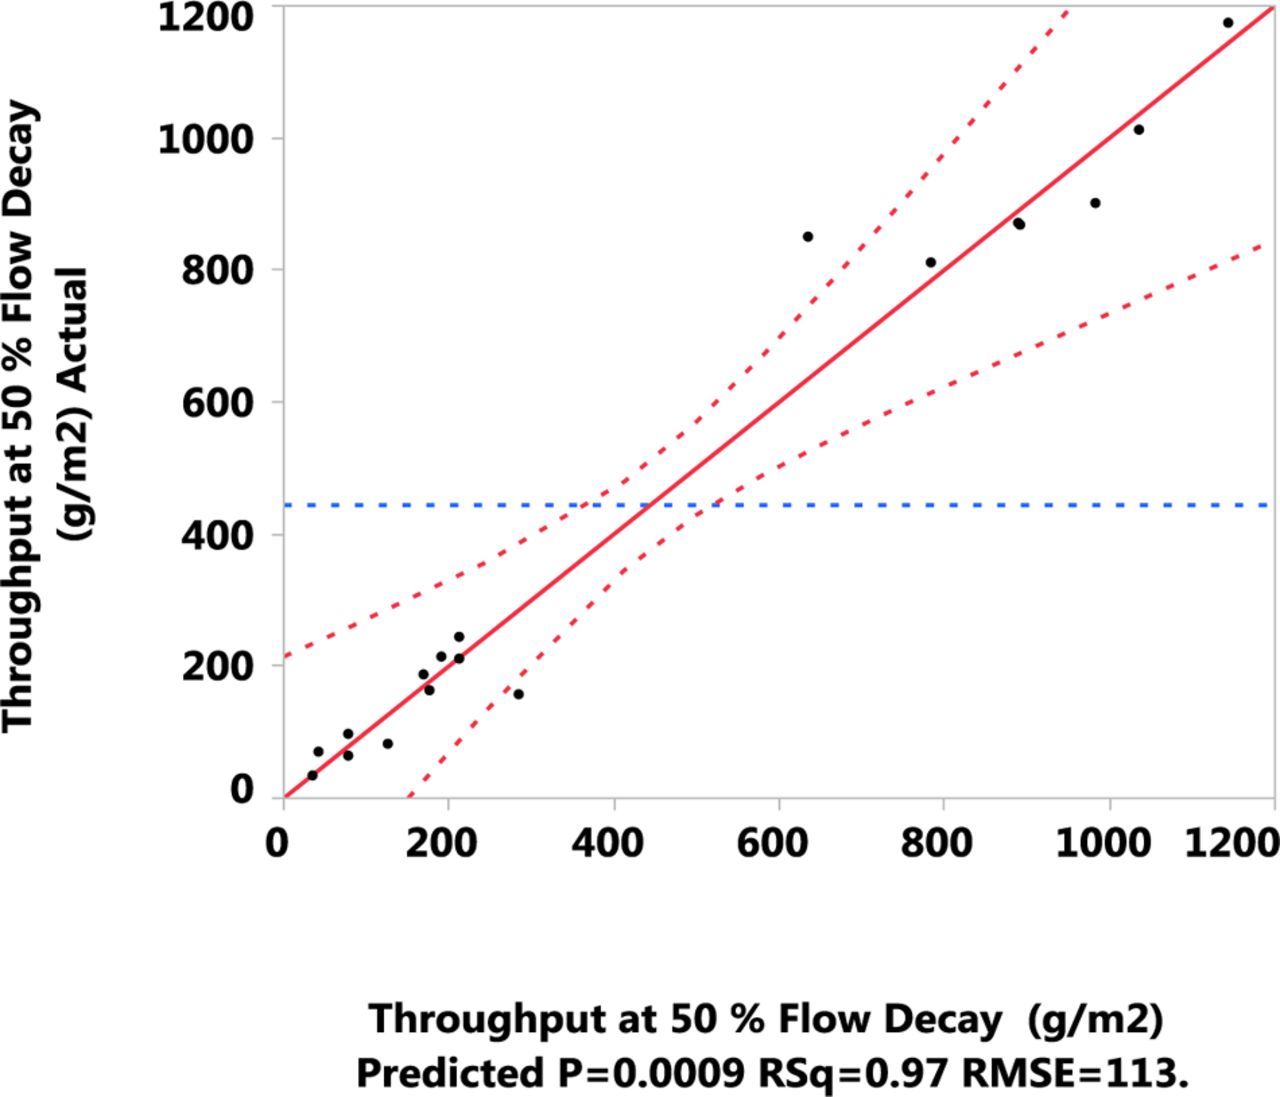
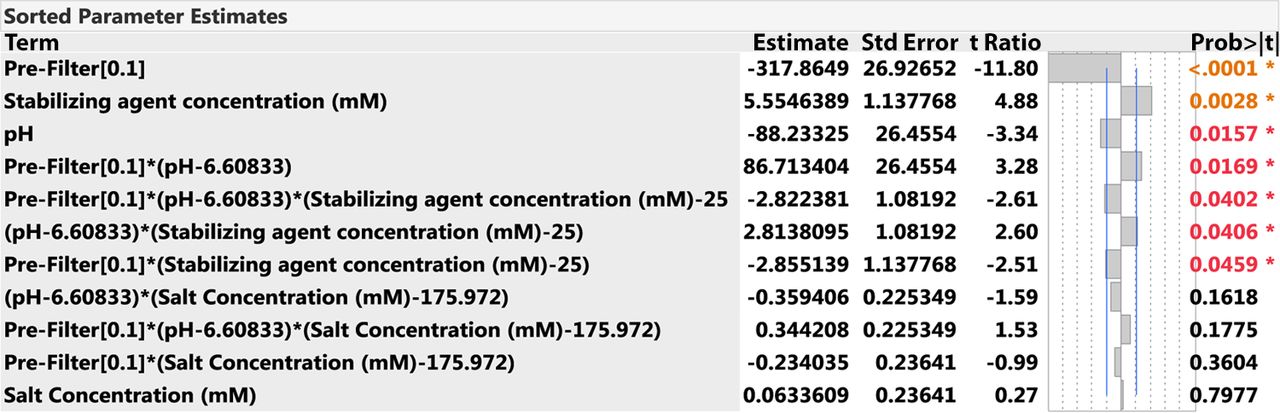
The throughput data from the DOE runs was analyzed in JMP software, using the stepwise minimum Bayesian Information Criterion method to choose the best model fit. Figure 5 shows the actual-by-predicted plot for the throughput (g/m2) at 50% flow decay for the model fit generated by JMP. The actual-by-predicted plot indicates that the model fit is significant with a p-value of 0.0009. The RSquare value shows that the model explains 97% of the variation in the data. This model shows that the pre-filter type, stabilizing agent concentration (mM), pH, and other interaction parameters show a significant effect (P-value <0.05) on the Virosart® CPV viral filter throughput (Figure 6). The Virosart® Max prefilter had the greatest effect on the Virosart® CPV viral filter throughput. As the stabilizing agent concentration (mM) increased and/or the pH decreased the Virosart® CPV viral filter throughput increased.

Actual versus predicted model fit for throughput (g/m2) across the viral filter at 50% flow decay.

Sorted parameter estimates of the model.
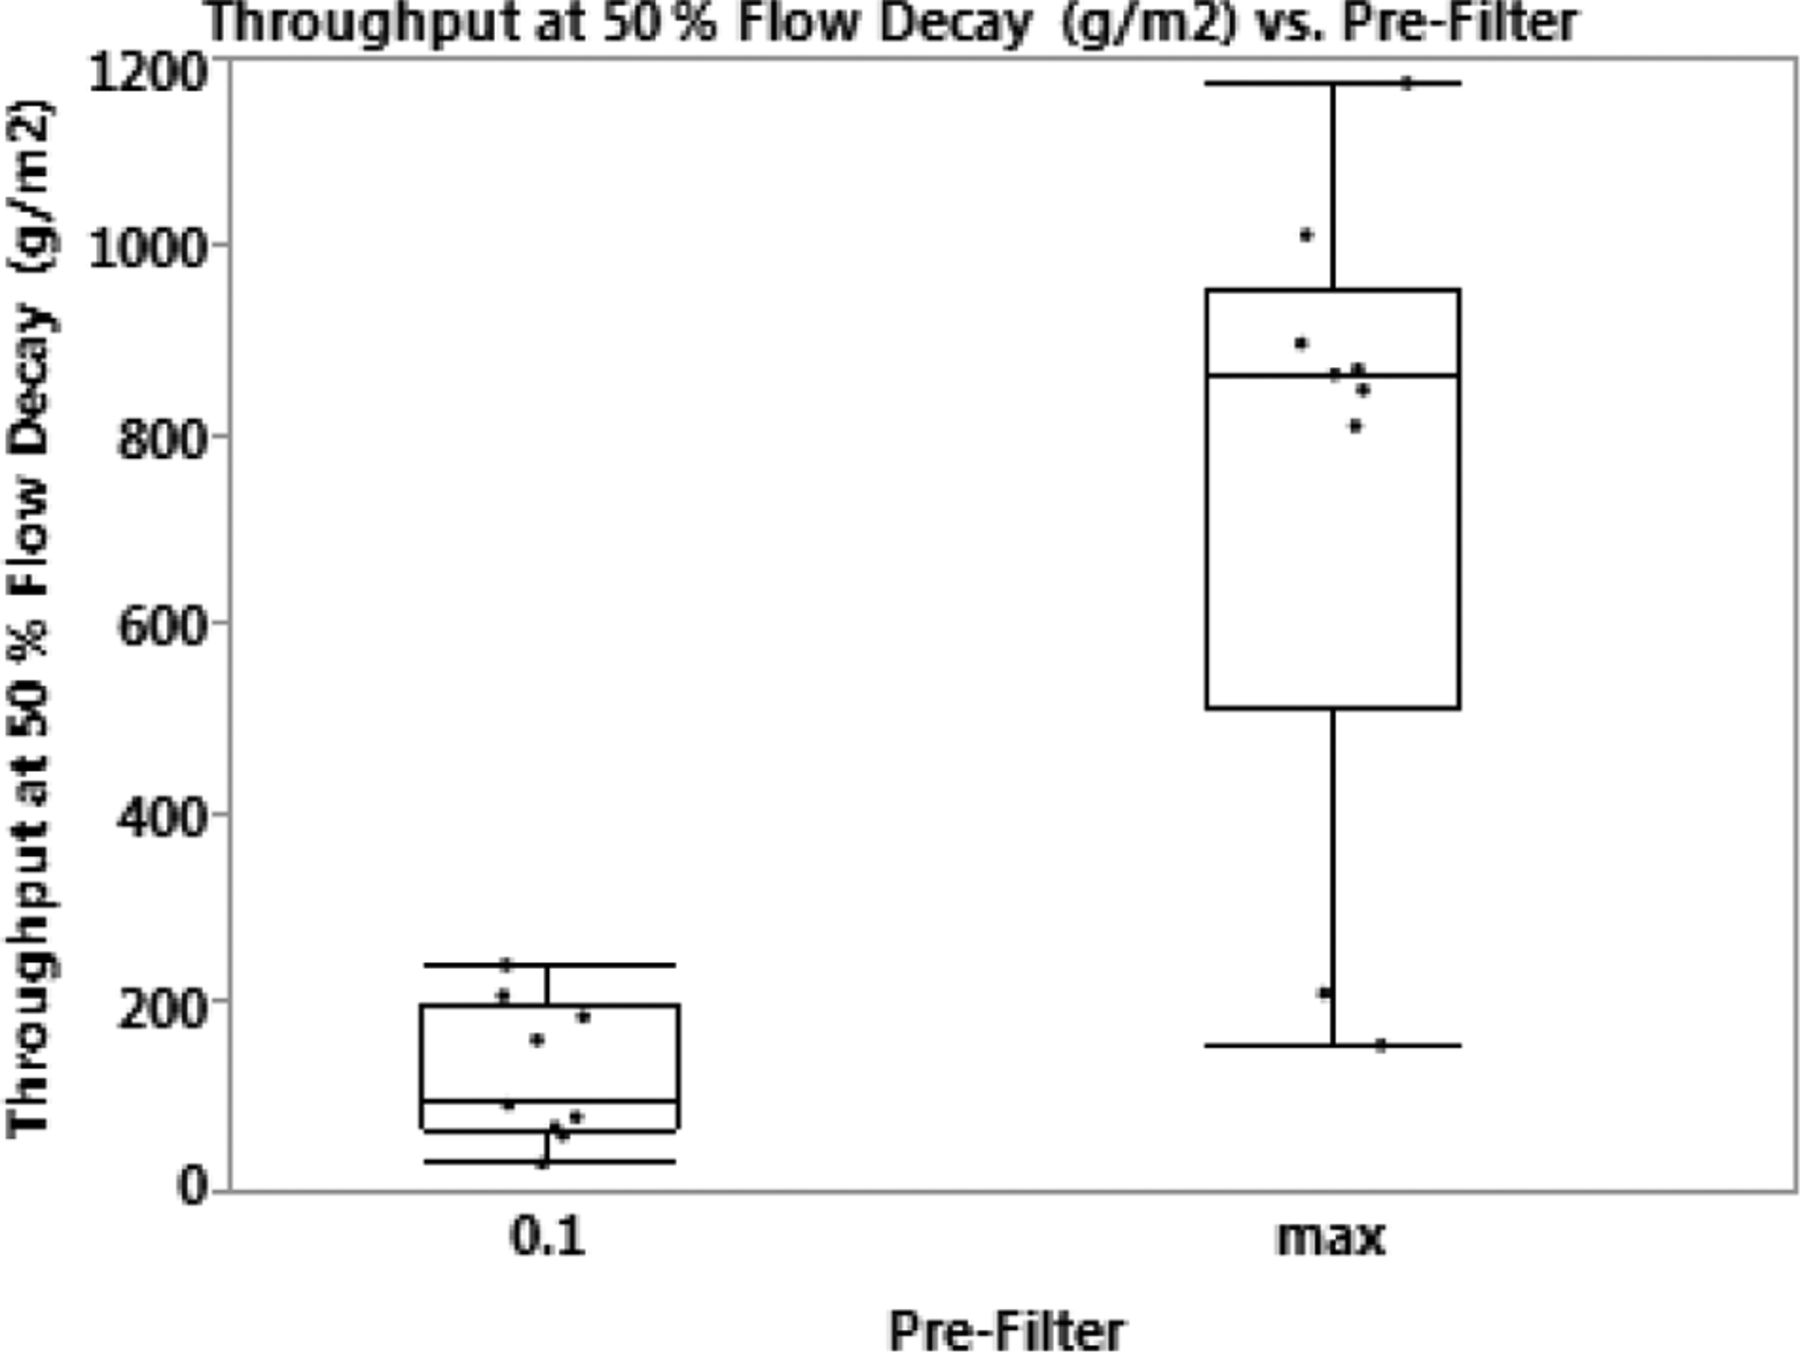
Figure 7 shows the box-and-whisker plot for the throughput (g/m2) at 50% flow decay for the 0.1 μM PES prefilter and the Virosart® Max prefilter. The plot shows that the average throughput with the Virosart® Max prefilter is approximately 9-fold higher than the average throughput observed with the 0.1 μm PES prefilter.

Comparison of the throughput (g/m2) across the 0.1 μM PES and Virosart® Max prefilters.
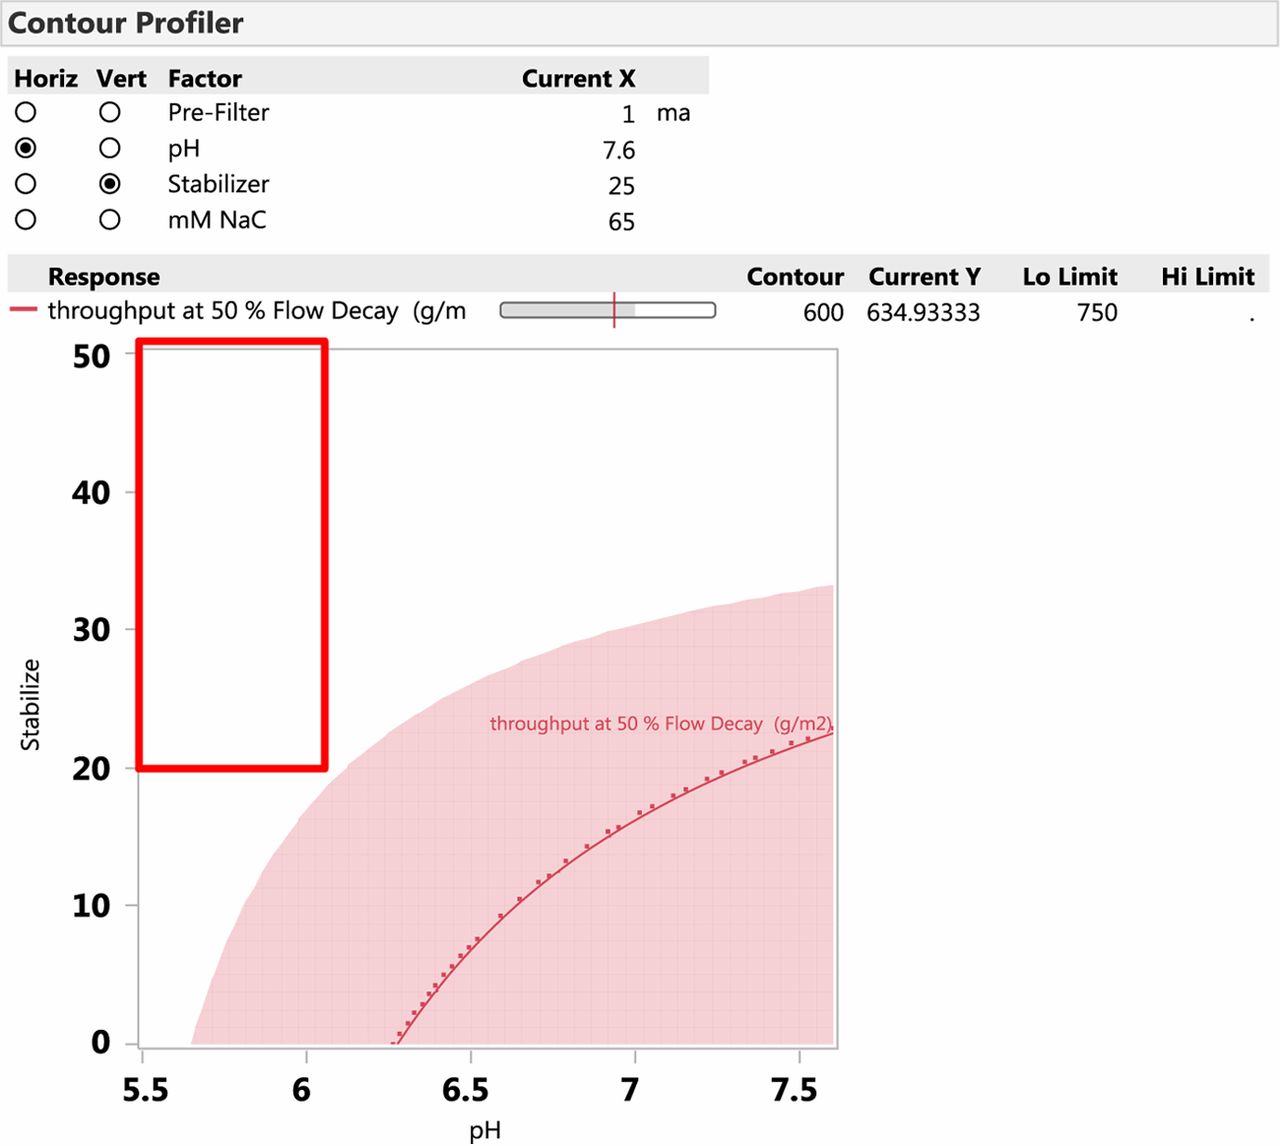
Based on the JMP model, the optimal operating condition for the Virosart® CPV viral filter when the throughput at 50% flow decay is >750 g/m2 (minimum target for commercial manufacturing is 500 g/m2) is determined. Figure 8 shows the optimal operating window when using the Virosart® Max prefilter with the Virosart® CPV viral filter. The plot shows that at a salt concentration of 65 mM, the pH can be varied from 5.5 to 6.0 and the stabilizing agent concentration can be varied between 20 and 50 mM.

Contour profiler showing the optimal operating conditions for the Virosart® CPV viral filter. The nonshaded region in the graph indicates the process conditions where the throughput at 50% flow decay is greater than 750 g/m2. The red box indicates the recommended operating conditions for the Virosart® CPV viral filter.
Virus Filtration and Flow Rate Variation (Thomas R. Kreil and Andreas Wieser; Global Pathogen Safety, Baxalta, Vienna, Austria)
Virus filtration is widely used in the plasma products industry and has become state-of-the-art for biotechnology products. At the 2011 PDA Virus and TSE Safety Forum though, three independent research groups reported similar findings, that is, situations of low pressure and consequently lower filtrate flow rate being associated with some loss in virus removal capacity (8). To address these uncertainties, an approach for the systematic evaluation of the comparability of down-scaled, virus-spiked, and manufacturing-scale virus filtration processes with respect to different flow rates across the membrane has been developed.
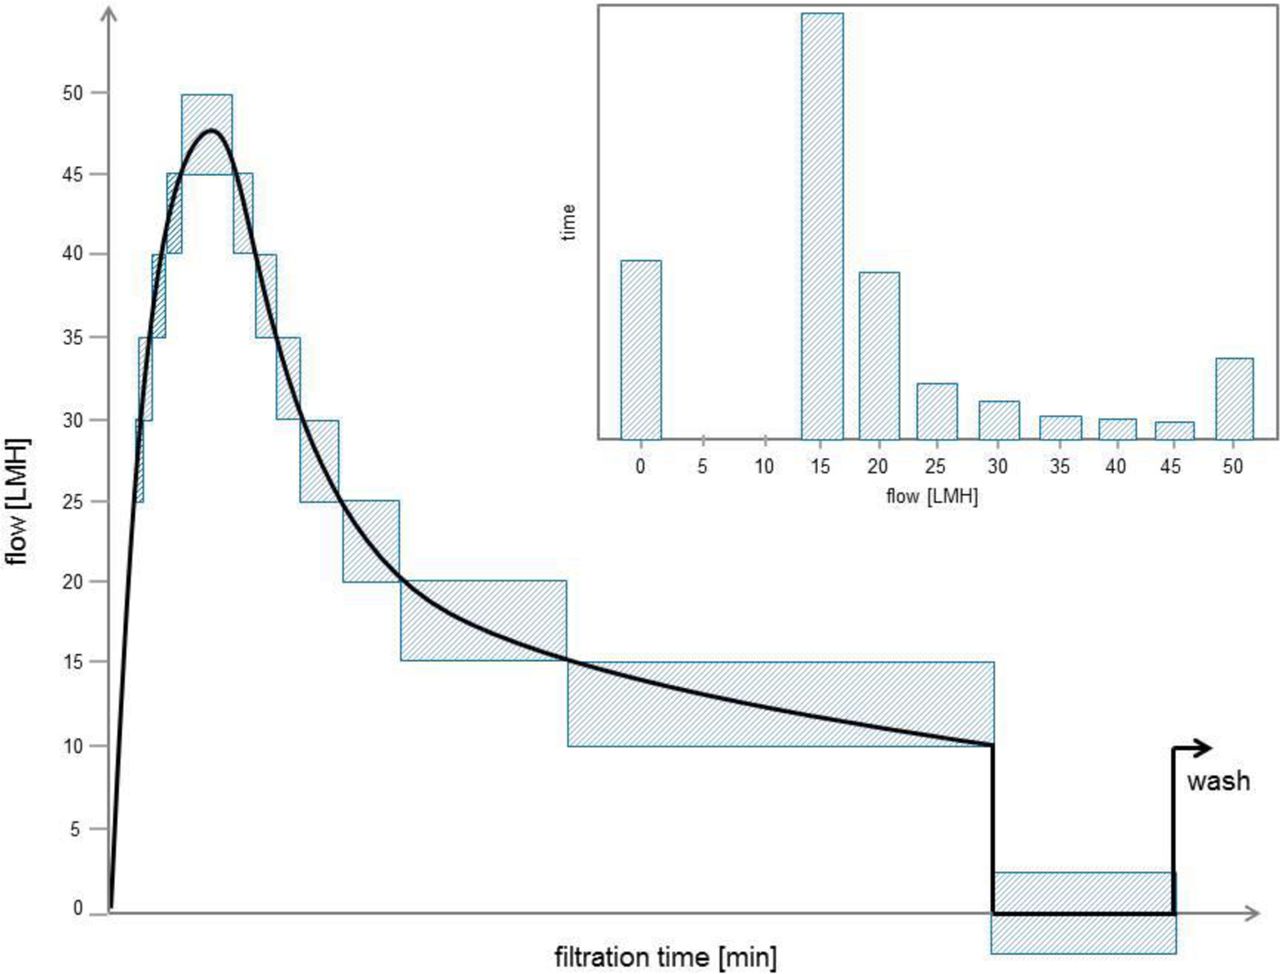
Specifically, the filtrate flow rate in liter per square meter of filter membrane per hour (LMH) that can be recorded continuously by advanced automated filtration systems (9) is plotted against filtration time. The processing time is then divided into LMH segments (Figure 9). The cumulative length of time that the process performed in any filtrate flow rate segment is then plotted against the respective filtrate flow rate pocket (Figure 9, insert). Through this transformation of the filtrate-flow-rate-versus-time curve into a filtrate flow rate histogram, the total amount of time that a virus filtration process remained within certain limits of filtrate flow rate becomes visible. Using the tool, scaled-down virus reduction studies can be designed to cover slower flow rates as well as longer no-flow rate periods than the manufacturing scale processes can, thus explicitly covering potential worst-case scenarios with respect to these parameters.

Conversion of viral filtration flow (LMH) versus filtration time plot to histograph (insert).
The application of this approach to the comparison of data from virus reduction studies and manufacturing-scale filtration processes has been applied to certain products, with subsequent investigations performed to ensure full coverage of the manufacturing-scale processes by small-scale virus removal studies.
Effects of Low Pressure or Depressurization on Parvovirus Removal during Viral Filtration (Sean O'Donnell; Eli Lilly, Indianapolis, IN)
The mechanism of virus removal by viral filtration is primarily size exclusion; however operating conditions can affect virus retention. The influence of operating conditions on porcine parvovirus (PPV) retention using two commercially available viral filters was reported. Several parameters were investigated: pressure, depressurization/repressurization (DPRP), and viral spike concentration. Two brands of viral filters, A and B, were evaluated in the current study. For filter A, a constant pressure of 14.2 psi was used with (Table II), and without (Table III) DPRP at various viral spike concentrations. Grab samples, collected at the beginning, middle, and end of filtration, were collected to monitor PPV breakthrough by TCID50 assay. The results indicate that for filter A, PPV breakthrough was observed when a DPRP was introduced into the filtration. In addition, as the viral spike concentration increased so did the PPV breakthrough. However, when there was no DPRP there was no breakthrough seen with a viral spike concentration of up to 6 log10 TCID50/mL. These results indicate that DPRP should be controlled during the filtration process to avoid virus breakthrough for filter A.
Viral Filtration without DPRP Using Viral Filter A
Viral Filtration with DPRP Using Viral Filter A
Viral filter B was evaluated for the potential effects of pressure and DPRP on PPV breakthrough. Grab samples, collected at the beginning, middle, and end of filtration, as well as filtrate and buffer flush samples were collected to monitor PPV breakthrough. All filtrations in Table IV contained a DPRP and the filtrate and buffer flush pools were collected together. Decreasing the operating pressure or introducing a DPRP during viral filtration resulted in no PPV breakthrough in any sample taken during the filtration. These results demonstrate that DPRP and pressure do not affect PPV retention for filter B.
Viral Filtration with DPRP Using Viral Filter B
Taken together, our study shows that the effectiveness of parvovirus clearance by viral filters can be affected by operating conditions depending on the type of viral filters used. Therefore, DPRP and pressure limits should be investigated to fully understand the critical process parameters so that effective process controls can be set to ensure the product safety.
Pressure Interruptions in Manufacturing—Tempest in a Teapot? (Konstantin Zoeller; Novartis Pharma AG, Biologics Process R&D, Early Phase Development, Basel, Switzerland)
Virus removal by filtration has proven to be a robust step in manufacturing biopharmaceuticals. Interruptions in the filtration process have been shown to result in increased virus passage through the virus retentive filter.
In a manufacturing environment interruptions in nanofiltration are not uncommon. They can be a feature of the process, for example before a recovery flush is applied to the virus retentive filter, or unintentionally, for example if the system is halted due to an alarm.
The question addressed in this presentation is whether interruptions can be adequately tested in a viral clearance study, thus avoiding the need to prevent interruptions in manufacturing. Recently, multiple risk factors for virus passage have been identified and published by multiple authors. They can be categorized into four groups:
Filter properties: Membrane type and pore structure complexity (10, 11)
Load solution properties: High salt level and low pH (only a combination of both) (8)
Process parameters: Flow across membrane (a high flow limits access to other pores) (8, 9, 12, 13) and interruptions (including duration) (8, 10)
Validation design: Virus load on the filter (8)
Looking at the nanofilter properties, Novartis data suggest that there is a higher probability for Planova 20N to show virus passage (80% of cases) compared with Viresolve Pro (22% of cases). Nonetheless, both filter types have been proven to be robust filters with parvovirus reduction factors of at least 4.8 log10.
Asahi Kasei (6) has successfully identified load solution properties (in this case, 100 mS/cm at pH 4) that have a significant impact on virus passage through Planova 20N. This effect is particularly pronounced when combined with membrane loads of >1011 infectious units (IU)/m2. Therefore, as such worst-case conditions are known, these conditions should be omitted in the design of the manufacturing process.
In a real manufacturing process, in the event of undetected contamination, the virus load would typically be below 107 IU/m2. This value has been calculated assuming no viral clearance prior to filtration, an assay detection limit of 10 IU/mL, and a filter load of 1000 L/m2. Therefore, any load above 107 IU/mL in a viral clearance study would certainly represent the worst case for virus retention.
Additional considerations for the design of the validation study would be to use the lowest pressure permitted in manufacturing as one of the conditions evaluated in a robustness study. Published data show that a lower pressure, resulting in a lower flow rate, leads to a lower log reduction factor (LRF), probably by allowing the virus to access other pores in the filter (6, 7). Interruptions planned during the viral clearance study should be at least 30 min to enable a significant effect on virus retention (6, 8).
In conclusion, it is not necessary to prevent interruptions in manufacturing provided that the study is designed in such a way as to reflect the manufacturing process, and under application of sensible worst-case conditions.
Based on current knowledge, these worst-case conditions may include:
- Moderate virus load (approximately 1011 IU/m2)
- Pressure interruption/pause of 30 min at full membrane load
- Lowest pressure permitted in manufacturing
Evaluation of Virus-Retentive Filtration as an Effective Virus Removal Step: Modeling and Outlier Analysis (Valerie Cusick, John Mattila; Regeneron)
Regeneron assessed virus-retentive filtration by a dual layer polyethersulfone small virus-retentive filter for removal of MMV in 22 of its mAb manufacturing processes. This resulted in a statistical model for clearance based on virus quality, virus load challenge, and assay detection limit. Although the filter has been reliable for parvovirus removal, retrospective statistical analysis was performed to determine worst-case conditions that may result in <4 LRF for parvovirus and to build a predictive model for use in future studies.
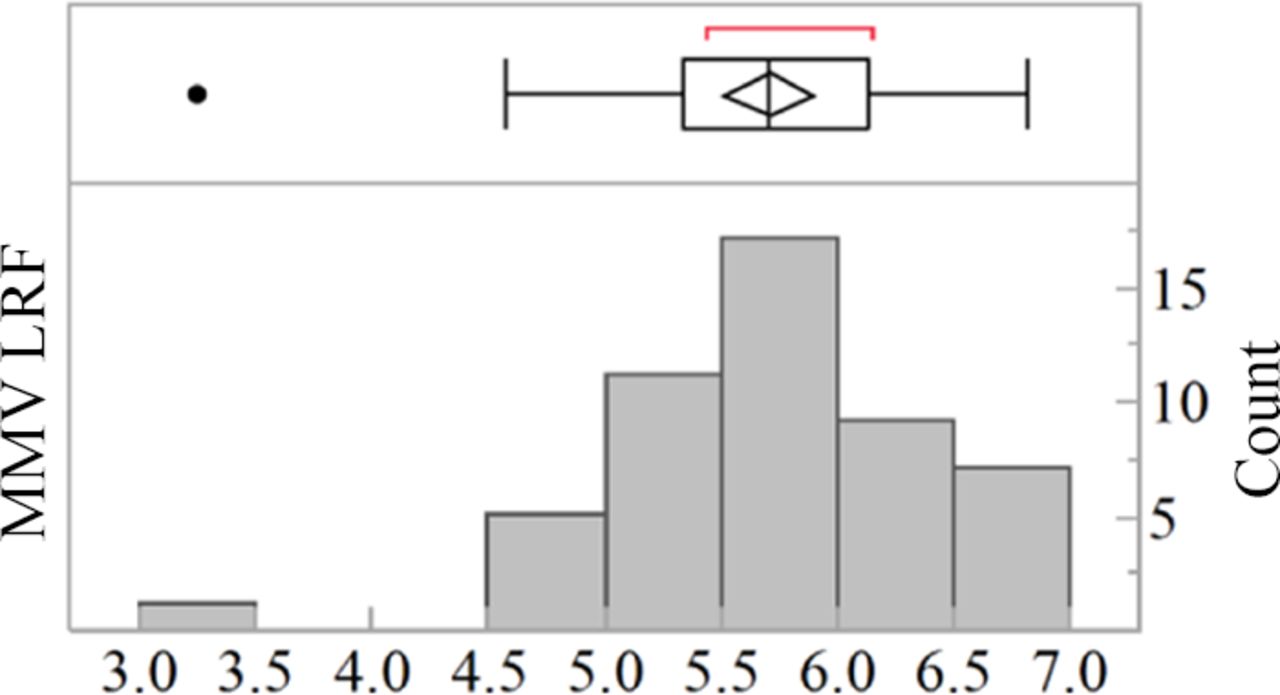
A distribution of the platform data set is shown in Figure 10. The data consist of MMV LRF from viral clearance studies for 22 monoclonal IgG1 or IgG4 antibody programs. The average clearance is 5.7 ± 0.68 log10 and residual MMV infectivity was detected in filtrate pools with a frequency of 20%.

Distribution of MMV LRFs by virus-retentive filtration for 22 Regeneron mAb platform processes. Average clearance is 5.7 ± 0.68 log10 and residual MMV infectivity was detected in filtrate pools with a frequency of 20%.
An initial main effects linear regression model was constructed based on virus quality (purified versus highly purified), feed stream or load pH (6.0–8.5) and conductivity (mS/cm), normalized protein concentration in load, terminal filter flux decay (13–80%), normalized volumetric filter loading, pressure-adjusted initial filter flux (LMH/psi), total virus load amount (log10 Plaque Forming Units [PFU]), and assay detection limit (log10 PFU) (Protein concentration and volumetric loading were normalized by dividing concentration or loading by the highest observed previously at Regeneron.). The regression model was refined by removing nonsignificant terms (P > 0.1), resulting in the simplified model shown in Equation 1. Predicted LRF may be expressed as a function of the significant (P < 0.1) terms, including virus quality, virus load (log10 PFU), and detection limit (log10 PFU). The model accounts for 58% of the variation in the data (R2 = 0.58) with a standard deviation of 0.45 log10.

Equation 1. MMV LRF as a function of virus load, limit of detection, and virus quality. Virus quality provides a 0.4 log10 differential.
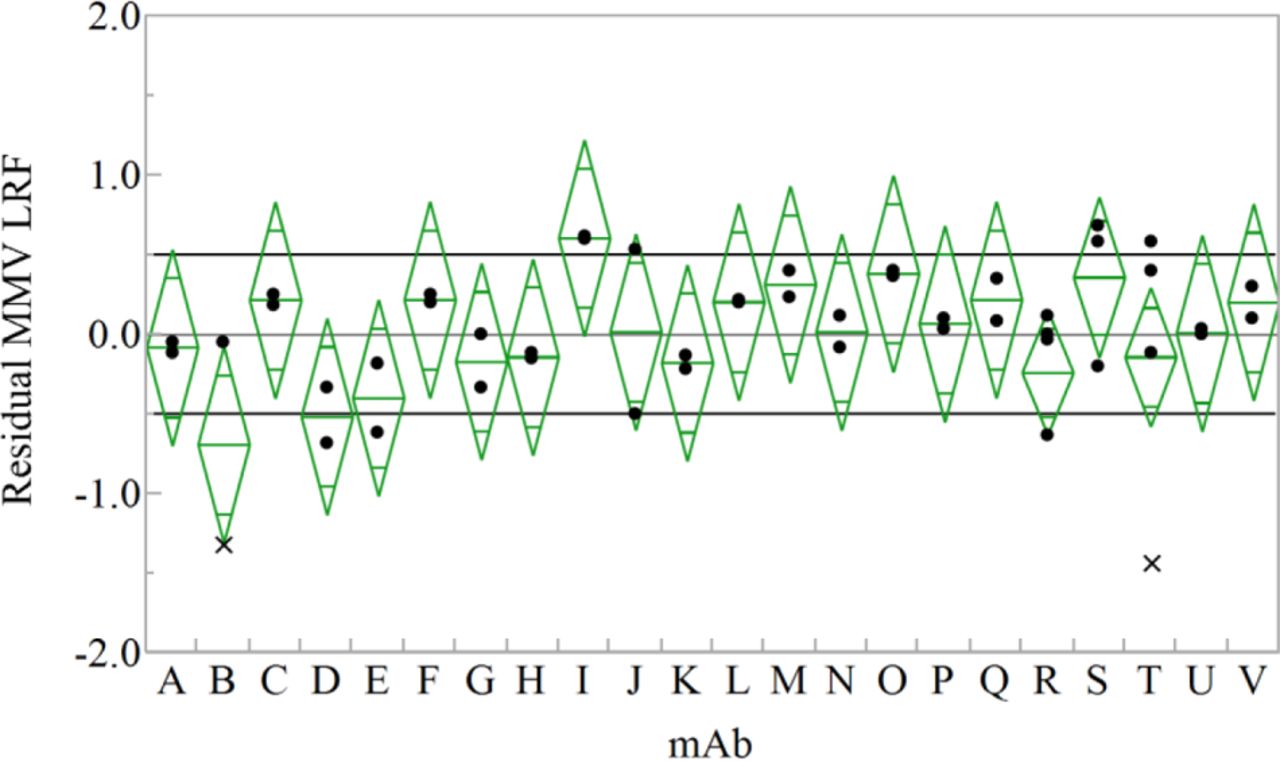
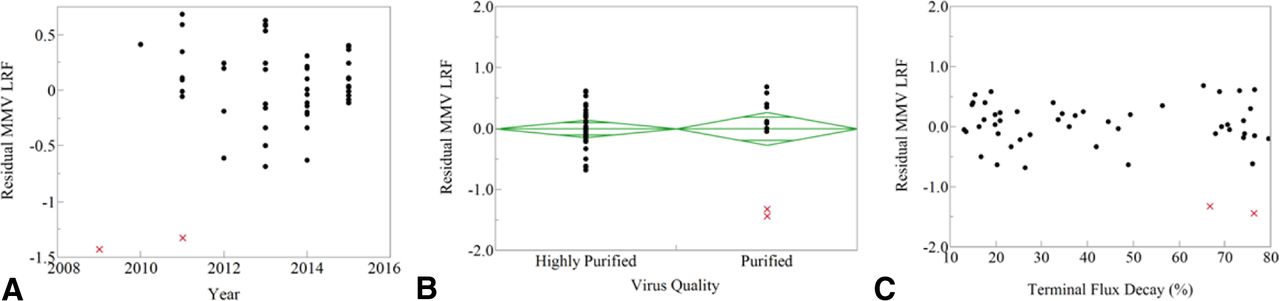
The simplified model residuals (actual LRF minus predicted LRF) were compared for each mAb to identify cases not explained by the regression model (Figure 11). Across 22 mAb programs, all have a mean LRF within 1 log10 of the predicted value, confirming the lack of product specificity for virus-retentive filtration. Two individual outliers from mAb B and mAb T were further evaluated using simple one-way plots (Figure 12). It was noted that the two outliers were from studies that occurred early in the filter's product launch, using virus stock that was not highly purified and resulted in >60% flux decay. Due to evidence of effective clearance for numerous mAbs under similar conditions, the data suggest that low clearance in these two mAbs was likely attributed to raw material variation or handling errors.

Model residuals (actual/predicted) plot of MMV LRF by virus-retentive filtration across 22 Regeneron mAb programs. All mean LRF values (center of diamond) are within 1 log10 of predicted value. Two individual experiments from mAb B and mAb T (marked by x) were more than 1 log10 lower than estimated by the model.

Simple one-way plots evaluating outliers from mAb B and mAb T, marked by x, show commonalities among year of use (A), virus quality (B), and terminal flux decay (C).
Multivariate analysis of platform data resulted in an initial model that shows that non–highly purified virus, a low virus load challenge, and high limit of detection are worst-case conditions (limiting log reduction value [LRV]) for virus-retentive filtration by a dual layer polyethersulfone (PES) membrane. Effective parvovirus clearance is reliably achieved when the virus challenge and detection limit are well designed. Future work may continue to identify worst-case conditions for virus-retentive filtration and support platform claims for parvovirus 1clearance.
Key Conclusions and Next Steps
Viral filtration is recognized as an effective and robust step, and the use of MVM represents a worst-case challenge scenario for viral filtration utilizing a sized-based retention mechanism.
Low-throughput observed in some viral filtration studies with Planova 20N correlated with solution properties of the mAb (e.g., aggregates and hydrodynamic radius) and the buffer composition, even when highly purified feedstocks are employed—similar to observations reported from 2013 VCS Meeting (1). Prefiltration can improve the overall viral filtration performance versus loading (L/m2 or gm/m2). The type of prefilter required is dependent on the impurity challenge.
Several papers emphasized the criticality of matching production conditions to scale-down study (e.g., duration of low pressure pause and timing of pause) and a model has been developed by Kreil et al. to visualize this situation. Incorporation of either low-pressure operation (6.5 psi) or pause has been correlated with some virus breakthrough on virus filter for PPV via a direct comparison of operation with and without a pressure pause. A review of literature and presentations by one company at the 2015 VCS clearly indicates that at least two virus filters, Planova 20N and Viresolve Pro, are both susceptible to virus breakthrough when challenged at extremely high loading (1011 IU/m2), although the impact of the breakthrough on LRV was modest in some cases. Previous literature examples with a range of viruses indicate one can achieve high LRV and acceptable viral filtration performance by limiting virus spike levels to a reasonable range coupled with the use of highly purified virus, which could minimize potential virus passage (14, 15). Additional investigation into the impact of pressure release on various virus filters over a range of operating conditions (e.g., virus loading, duration of pressure pause) should be pursued.
The use of multivariate predictive models to evaluate the impact of operating conditions on LRV has been pursued by multiple firms. This approach combined with an analysis of significant data sets can allow for identification of outliers (and potential root cause) as well as provide support for platform viral filtration claims (when combined with the approach employed in ASTM E55-04).
- © PDA, Inc. 2016


Jump to section
- Article
- Background
- Session Overview
- Investigation of Low Viral Filter Throughput in a mAb Process (Saravanamoorthy Rajendran, Bianca Olson, Ryan Tedstone, Anne Kantardjieff, and Rachael Alford; Alexion Pharmaceuticals)
- Virus Filtration and Flow Rate Variation (Thomas R. Kreil and Andreas Wieser; Global Pathogen Safety, Baxalta, Vienna, Austria)
- Effects of Low Pressure or Depressurization on Parvovirus Removal during Viral Filtration (Sean O'Donnell; Eli Lilly, Indianapolis, IN)
- Pressure Interruptions in Manufacturing—Tempest in a Teapot? (Konstantin Zoeller; Novartis Pharma AG, Biologics Process R&D, Early Phase Development, Basel, Switzerland)
- Evaluation of Virus-Retentive Filtration as an Effective Virus Removal Step: Modeling and Outlier Analysis (Valerie Cusick, John Mattila; Regeneron)
- Key Conclusions and Next Steps
- References
- Figures & Data
- References
- Info & Metrics