
Abstract
We compare frequency modulation spectroscopy (FMS) as a method of headspace water analysis with the method of Karl Fischer coulometric titration (KF), which is widely used in the analysis of residual water in a freeze-dried material. Parameters relating to the type of formulation (amorphous, crystalline) and the freeze-drying cycle (temperature, pressure, time) were investigated in relation to the resulting headspace moisture (HSM) and total water. We describe the effect of stopper treatment and storage conditions on the HSM levels observed using FMS as a non-destructive method, which also allowed individual vials to be reanalyzed at a series of time points as part of a long-term monitoring exercise. The results of this study enabled a better understanding of the effect of stopper type and pre-lyophilization treatment on the HSM levels both immediately after freeze-drying and upon subsequent storage of the sealed vials of lyophilized material at different temperatures. A clear, linear relationship was observed between HSM and KF values for vials containing freeze-dried sucrose, implying a relatively straightforward interaction between water and the lyophilized cake for this material. Moisture mapping of all vials on one shelf of the freeze-dryer enabled further information to be obtained on the relationship of the formulation, vial, process conditions, equipment geometry, and performance on the intra-batch variability in HSM level and dynamics. It is believed that this could therefore represent a potentially useful technique for quality assurance and in the validation of lyophilization cycles, equipment, and scale-up.
LAY ABSTRACT: Lyophilization, also known as “freeze-drying,” is a relatively old technique that has been used in its most basic form for thousands of years (e.g., preservation of fish and meat products). In its more advanced form it is used to preserve many medical products, for example, many vaccines are not stable in solution and therefore need to be dried to allow long-term storage. In order to produce a freeze-dried vaccine a complex understanding of the processes and critical temperatures is required. Once these have been understood the material is dried to give relatively low moisture content (e.g., 2% w/w). This low moisture content is critical for the long-term stability of the product, allowing doctors/chemists to store these goods on site for use when required. This research paper provides further information on a technique called frequency modulation spectroscopy (FMS) that could be used to further our knowledge of the water dynamics within a freeze-dried product, enabling us to increase our understanding of the role various materials and processing conditions play; this in turn could assist in improving quality assurance and ultimately the final product that reaches the consumer.
- Freeze-dried
- Lyophilization
- Karl Fischer
- Frequency modulation spectroscopy
- Headspace
- Moisture
- Crystalline
- Amorphous
- Residual water
Introduction
Lyophilization, also known as freeze-drying, is a method of processing what is initially a liquid product into a dry, solid product. Typically this is carried out to enable longer storage times at more economic and practical temperatures. Freeze-drying a vaccine, for example, can increase product lifetime from just a few hours or days to several months or years; this has clear advantages, reducing the importance and criticality in terms of accuracy for forecasting product demand, choosing production batch sizes, storage facility requirements, transport logistics, and the associated costs of these. The method is used mainly in the pharmaceutical, biotechnology, cosmetic, and food industries.
Freeze-drying requires the removal of water from a material, a process which involves three stages. First, the product is frozen to a defined temperature, and then the free ice is removed during “primary drying” by sublimation under vacuum. Finally, in “secondary drying” (typically at a higher temperature and lower pressure), much of the remaining (bound or otherwise associated) water may be desorbed under vacuum. A freeze-dried pharmaceutical or biotech product will usually consist of a number of components that may be added to the active ingredient(s) in order to improve lyophilization characteristics, including bulking agents, protective agents (“lyoprotectants”), thermal stabilizers, buffer salts, pH adjusters, and surfactants.
For a freeze-dried product, one of the most important parameters to measure is the moisture content. It has a direct effect on the glass transition (1), which has been shown to have a direct correlation with product stability and allows calculation of a safe storage temperature. The residual water content of a lyophilized product is commonly measured in terms of total water. Karl Fischer (KF) titration is a well established and a US Food and Drug Administration-recognised technique. KF titration is generally considered to measure the total water within the vial containing the freeze-dried cake if the sample is 100% soluble in KF medium. KF does not allow the operator to distinguish between one “form” of water and another. Coulometric results are most often quoted as percentage moisture by product weight. The above method is time-intensive and involves destruction of the sample. Frequency modulation spectroscopy (FMS) measures equilibrium free moisture in the headspace of the vial and is a non-destructive technique. The sample can be analysed in less than 5 s, and the same sealed container may be reanalyzed over time. May et al. (2) stated “vapour pressure moisture data provides additional information on the state of dryness of the headspace of the final container vial” and that “this data complements residual moisture results obtained for the freeze-dried cake.” Duncan et al. (3) have shown that a given amount of headspace moisture (HSM) correlates to the degradation of the active ingredient over a period of time. Lin et al. (4) studied the effect that the FMS laser had on the sample; this stability data indicated that laser exposure of the sample did not cause any significant adverse effects on the protein studied. This is important should the method be used for 100% inspection of a freeze-dried batch.
The level of residual moisture in a lyophilized material will not only be a result of the freeze-drying cycle employed, the concentration of the starting material, fill depth, and container type, but it will also be a function of the physico-chemical nature of the ingredients within the context of the final lyophilized cake or powder. Water can be present in a variety of “forms”—free, adsorbed, chemically bound, hydration shells (e.g., of proteins), water of crystallisation—not all of which may be directly linked to the activity or stability of the product in question.
A series of different freeze-dried cakes using a variety of excipients, ranging from purely amorphous to completely crystalline, were analyzed using KF and FMS. Empty vials with no cake or powder were also studied as control samples to exclude excipient effects. The aim was to establish what factors affect HSM and whether a correlation between the moisture measured by KF and FMS could be obtained.
Materials and Methods
Materials
This study was conducted using VCDIN6R clear, tubular, type 1 glass, 6 mL vials (Schott, St. Gallen, Switzerland) and 20 mm diameter lyophilization (igloo-type), bromobutyl stoppers (FDW20Rts); these were manufactured by West Pharmaceutical Services and supplied by Adelphi Tubes Ltd. (Haywards Heath, UK). The vials and stoppers were not capped and crimped; while crimping is important when samples are shipped and transported prior to use, to ensure that stoppers do not become removed accidentally and to prevent tampering, samples used in this study were stored for a relatively short period of time (less than 3 months) and were kept in the same laboratory. A study by Sasaki et al. (5) showed that in the early stages (0–93 days) increases in moisture observed in the vial were due to moisture transfer from the stopper. Stoppers were used with no pre-treatment unless stated; where “oven-dried” is stated, stoppers were dried at 105 °C for 3 h in a laboratory oven (Raven Oven, LTE Scientific Ltd., Oldham, UK). A variety of excipients was used to produce freeze-dried cakes with deliberately different properties. Table I summarizes the material type, critical temperature concentration, fill volume, and supplier.
Excipient Details
Freeze-drying Microscopy
Freeze-drying microscopy was carried out with the Lyostat2 instrument (Biopharma Technology Ltd., Winchester, UK) to determine the applicable collapse (Tc) or eutectic (Teu) temperatures for the materials prior to freeze-drying. Where Tc is noted, this is the temperature of the onset of collapse and thus represents the lower temperature limit of the event; see Table I .
Freeze-drying
A number of freeze-drying cycles were completed with Virtis Genesis freeze-dryers (models 12EL and 25EL, with 12 kg and 25 kg condenser capacities, respectively), both having a total shelf area of 0.5m2. Cycles were conducted based on the critical temperatures of each solution, where primary drying was conducted at least 5 °C below the critical temperature before commencing secondary drying at 20 °C with a pressure of 50 mTorr. A conservative primary drying temperature was used to ensure any HSM variations were not due to partial collapse or microcollapse. Type T thermocouple temperature probes placed at the bottom of each vial were used to monitor the progress of each cycle and to indicate when primary and secondary drying was complete. At the end of each cycle, all vials were sealed under a pressure of 50 mTorr unless otherwise stated. For the moisture mapping study, a whole tray of 242 vials was employed, each vial containing a 7 mm fill depth of 4% (w/v) sucrose solution. The samples were freeze-dried using a cycle that was based on direct contact; the freeze-drying cycle was terminated based on observations of temperature probes placed in vials in direct contact.
Karl Fischer Analysis
Coulometric KF (Cou-Lo Aquamax and Cou-Lo Compact, GRS Scientific, Ampthill, UK) was used to measure the total water within the freeze-dried cake. KF measurements were taken once monitoring showed FMS readings had become constant; the results are given as percentage w/w water.
Weight Measurements
A four decimal place balance (HR-120, A&D, San Jose, CA, USA) was used to measure KF solution and freeze-dried product weight for KF analysis as well as weight changes due to pressure release of vials and stopper weight changes after drying. For pressure release weight changes, the vials were measured when the vacuum seal was intact, the pressure was then released, and the weight measured again in order to calculate the weight difference.
Frequency Modulation Spectroscopy (FMS)
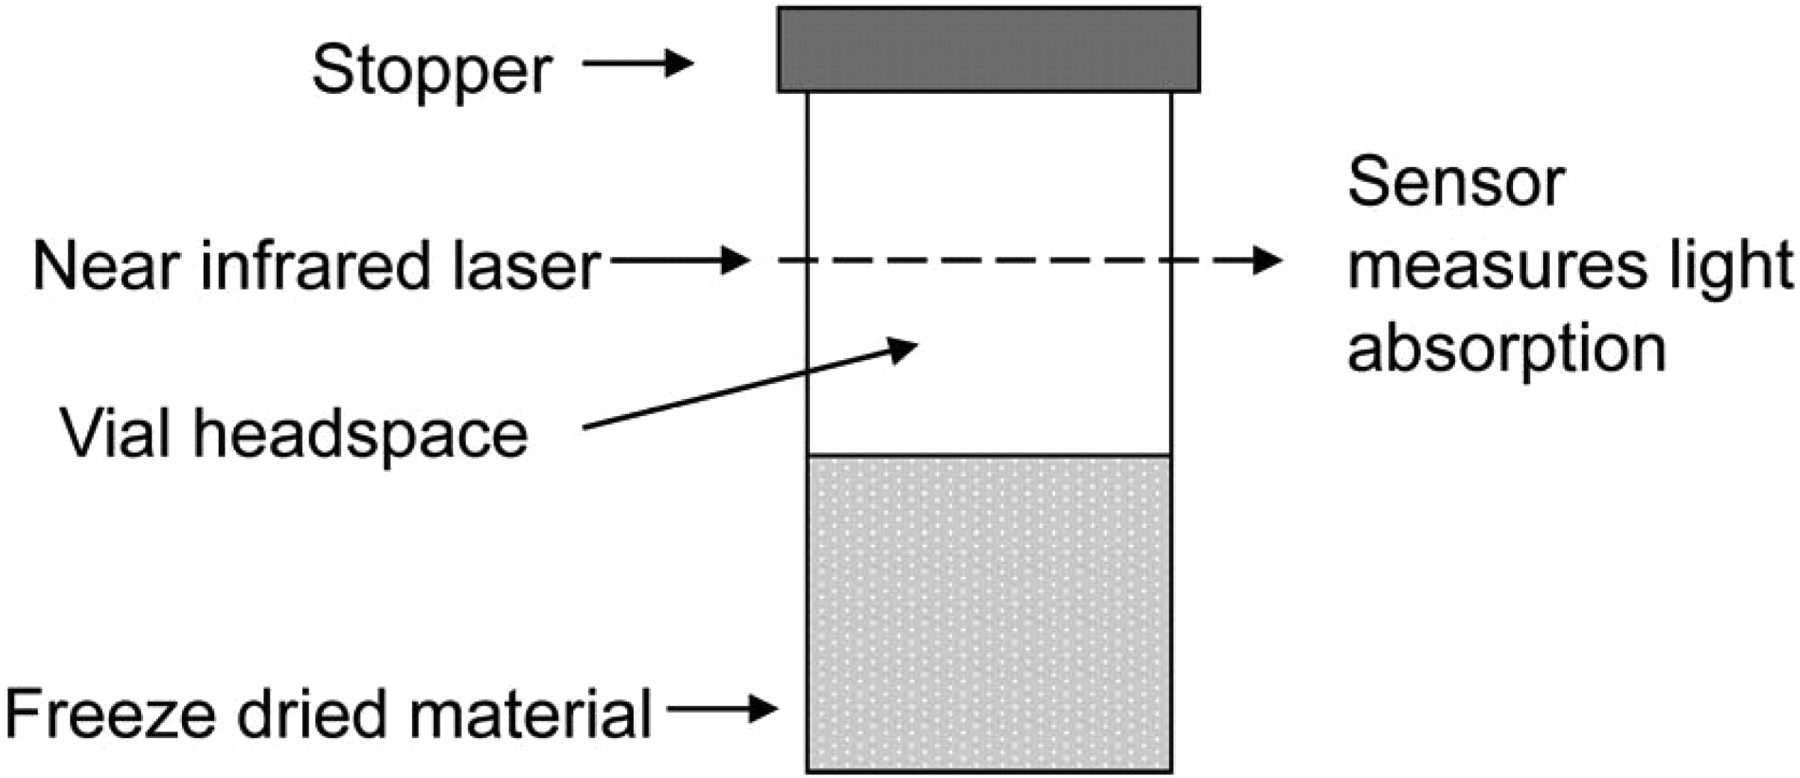
A benchtop FMS (FMS-1400, Lighthouse Instruments, Charlottesville, VA, USA) enables the measurement of water and pressure within the headspace of the vial (Figure 1). The laser is tuned to match the internal absorption frequency of a water molecule at 1400 nm. The amount of laser light absorbed is proportional to the water vapour concentration, and the absorption width of the signal is proportional to the pressure. HSM values are quoted as partial pressure in units of Torr. A nitrogen purge rate of 4.5 L/min was used for all analyses to remove signal noise contributed from background ambient moisture; this value is supported by Lin et al. (4). A set of moisture standards was manufactured by Lighthouse Instruments using the same vials used for freeze-drying, whereby the neck of each vial was heated and formed into a tip to create a sealed ampoule. A more in-depth description of the fundamentals of FMS is provided by Mahajan et al. (6).

Vial headspace measurement.
Results and Discussion
Vial System/Stopper Storage
Freeze-dried products that have been dispensed into vials and dried are generally sealed off from the atmosphere at the end of secondary drying to prevent moisture or other contaminants from entering the product. Vials are predominantly sealed with rubber/bromobutyl/polytetrafluoroethylene (PTFE) stoppers; the material type, coating and specific tolerances will vary with the manufacturer, application, and cost. An important consideration for freeze-drying is minimising the exposure of the product to additional moisture.
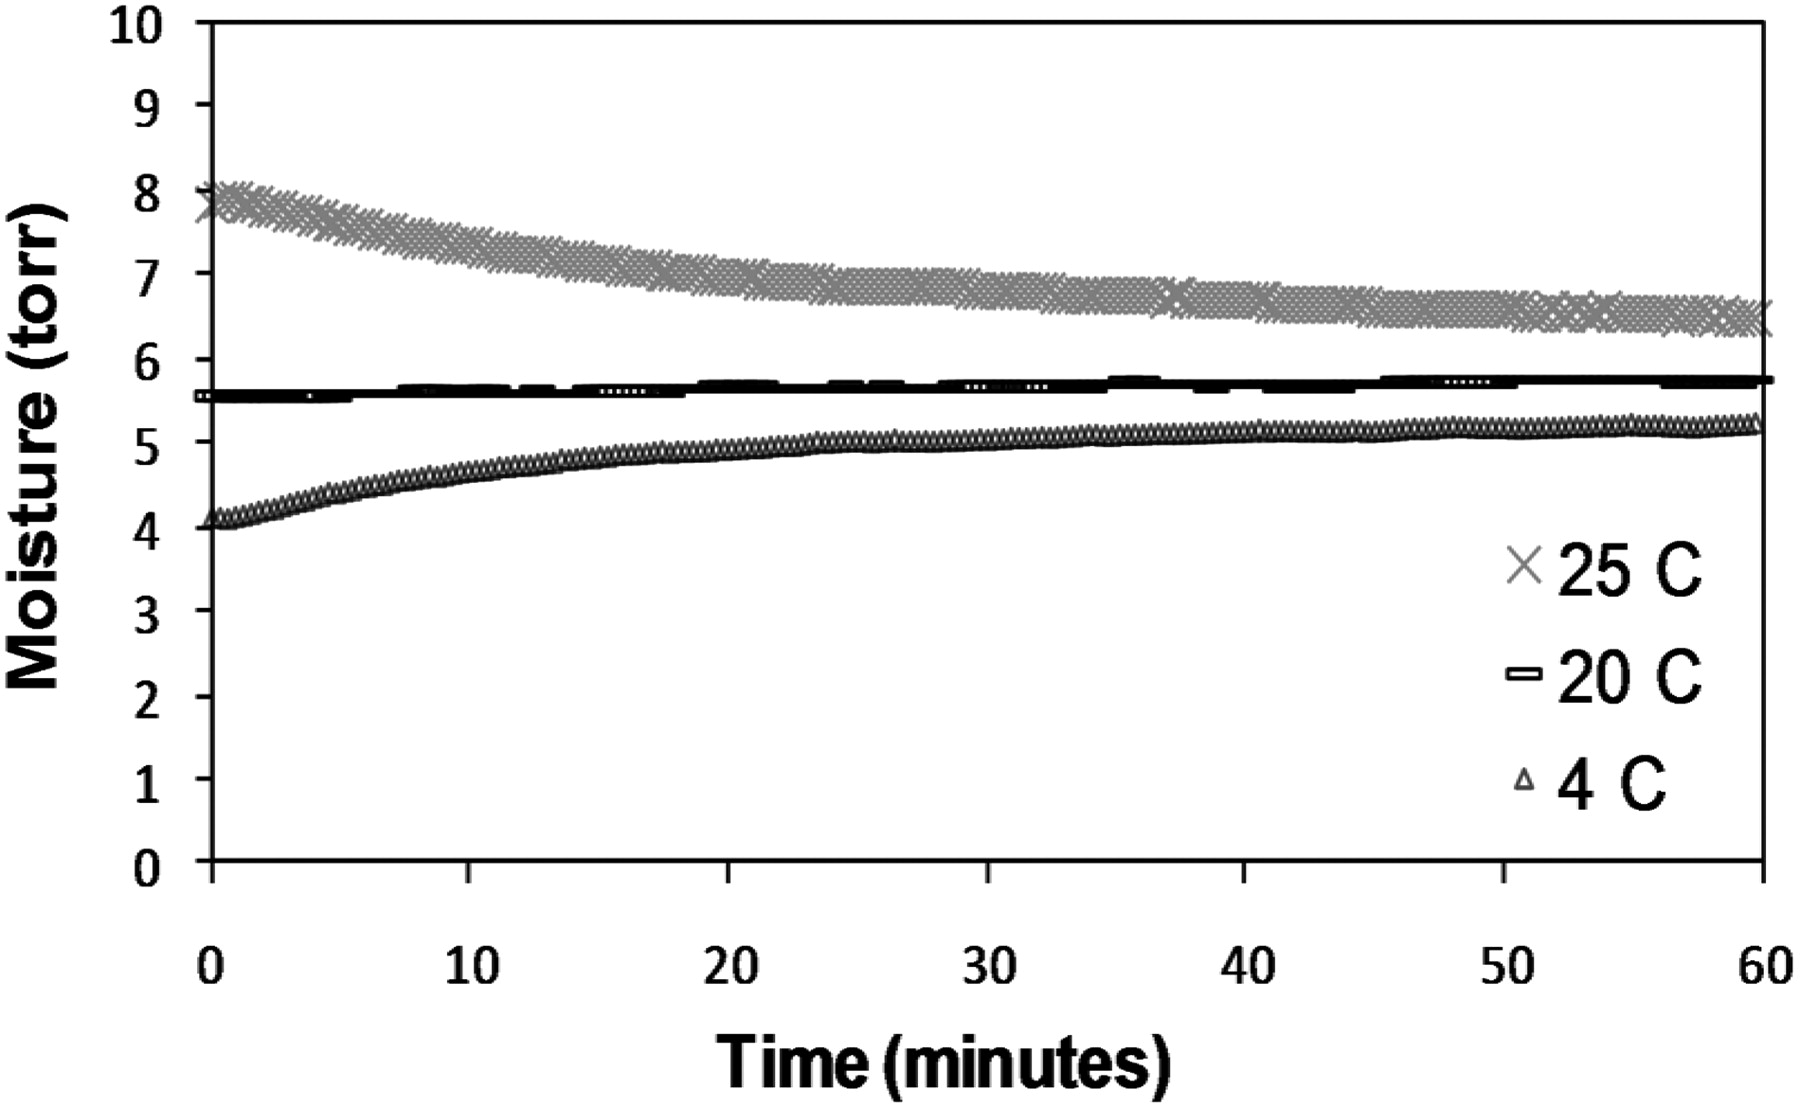
HSM analysis allowed a comparison of stopper treatments and storage conditions and the effect this had on HSM levels. This section of the study involved analyzing empty stoppered vials without any freeze-dried material as a negative control; these samples were studied to exclude excipient effects. Figure 2 shows HSM values being measured every 30 s for 1 h while the container temperature returns to ambient conditions (20 ± 1 °C) after removal from storage (24 h) at 4 °C, ambient, and 25 °C.

Empty stoppered vial HSM levels after storage at 25 °C, 20 °C and 4 °C.
These data indicate that stopper/headspace equilibrium moisture is highly sensitive to temperature, an observation which is supported by Donovan et al. (7). The data clearly shows that temperature affects the stopper moisture capacity/equilibrium; lower temperatures increase the stopper moisture capacity/uptake with consequently lower levels observed in the headspace. A blank control trial was performed on a glass ampoule reference standard (no cake, no stopper, glass sealed). The glass ampoule was formed from a VC6DINR Schott 6 mL vial. The blank control allowed assessment of whether any variations in measurement were due to other effects, for example, condensation on removal of a sample from 4 °C. The reference standard did not show any such moisture variation with constant HSM value of 3.97 Torr, standard deviation (SD) 0.02.
Stopper Drying
Stoppers were dried to minimise residual moisture prior to freeze-drying, which gave an average mass loss of 1 mg per stopper. Dried and un-dried stoppers were compared with regard to the effect on the resulting HSM for a set of blank vials. Measurements were taken on day 0 and day 45 after the end of the freeze-drying cycle. Table II gives the average HSM values for vials with stoppers that had been dried and those that had not been dried. Those that had not been dried revealed an average of 4.25 Torr higher partial pressure of moisture in the headspace. This demonstrates the increased level of moisture ingress from the stopper when stoppers are not oven-dried prior to freeze-drying.
Un-dried and Dried Stopper Data after 45 Days
The above observations emphasise the importance of using the correct stopper type for a product and that the degree of variation in the stopper/quality of the stopper produced is important in ensuring that all vials experience the same environment, which is important for quality assurance purposes.
Calculated Water per Moisture Torr
Differences in HSM (Torr), total headspace pressure (Torr), and weight were measured for five vials both before and after pressure release (stopper removed and replaced) using empty vials in order to quantify the mass of water represented by each Torr of moisture. These results are given in Table III , along with theoretical calculated results for the actual mass of water per Torr and total water in both micrograms (μg) and microliters (μl). It is important to note that the moisture present will vary with the humidity and is therefore not an absolute result.
Theoretical Moisture Calculations
Calculations
 .
The above results indicate that 158 μg of water is in the blank vial after pressure release. It was calculated that 1 moisture Torr is equivalent to 15.25 μg of water. Identifying these types of values enables an estimate to be made of the difference in the amount of water that a cake may hold due to changes in temperature, stopper treatment, and excipients.
.
The above results indicate that 158 μg of water is in the blank vial after pressure release. It was calculated that 1 moisture Torr is equivalent to 15.25 μg of water. Identifying these types of values enables an estimate to be made of the difference in the amount of water that a cake may hold due to changes in temperature, stopper treatment, and excipients.
Results reported by May et al. (2) for the α-interferon vaccine in micrograms were much lower (circa 6.67 ug per vial at −11.8 °C); however the vial/cake/stopper system employed by May et al. (2) were vastly different to those used in the present study in terms of the vial, stopper, and most importantly the presence of freeze-dried material. In addition, May et al. (2) used electro-optical dew point measurements to obtain moisture content in the vial headspace. The condensation temperature of the HSM was determined at negative temperatures and the amount of water was calculated using the ideal gas law. The data shown in Figure 2 for empty vials shows lower moisture levels observed in the headspace at lower temperatures, therefore the dew point measurement could conceivably give artificially low HSM values compared to the actual value at ambient temperature or 4 °C storage conditions.
Initial Headspace Moisture (HSM) and Pressure Changes
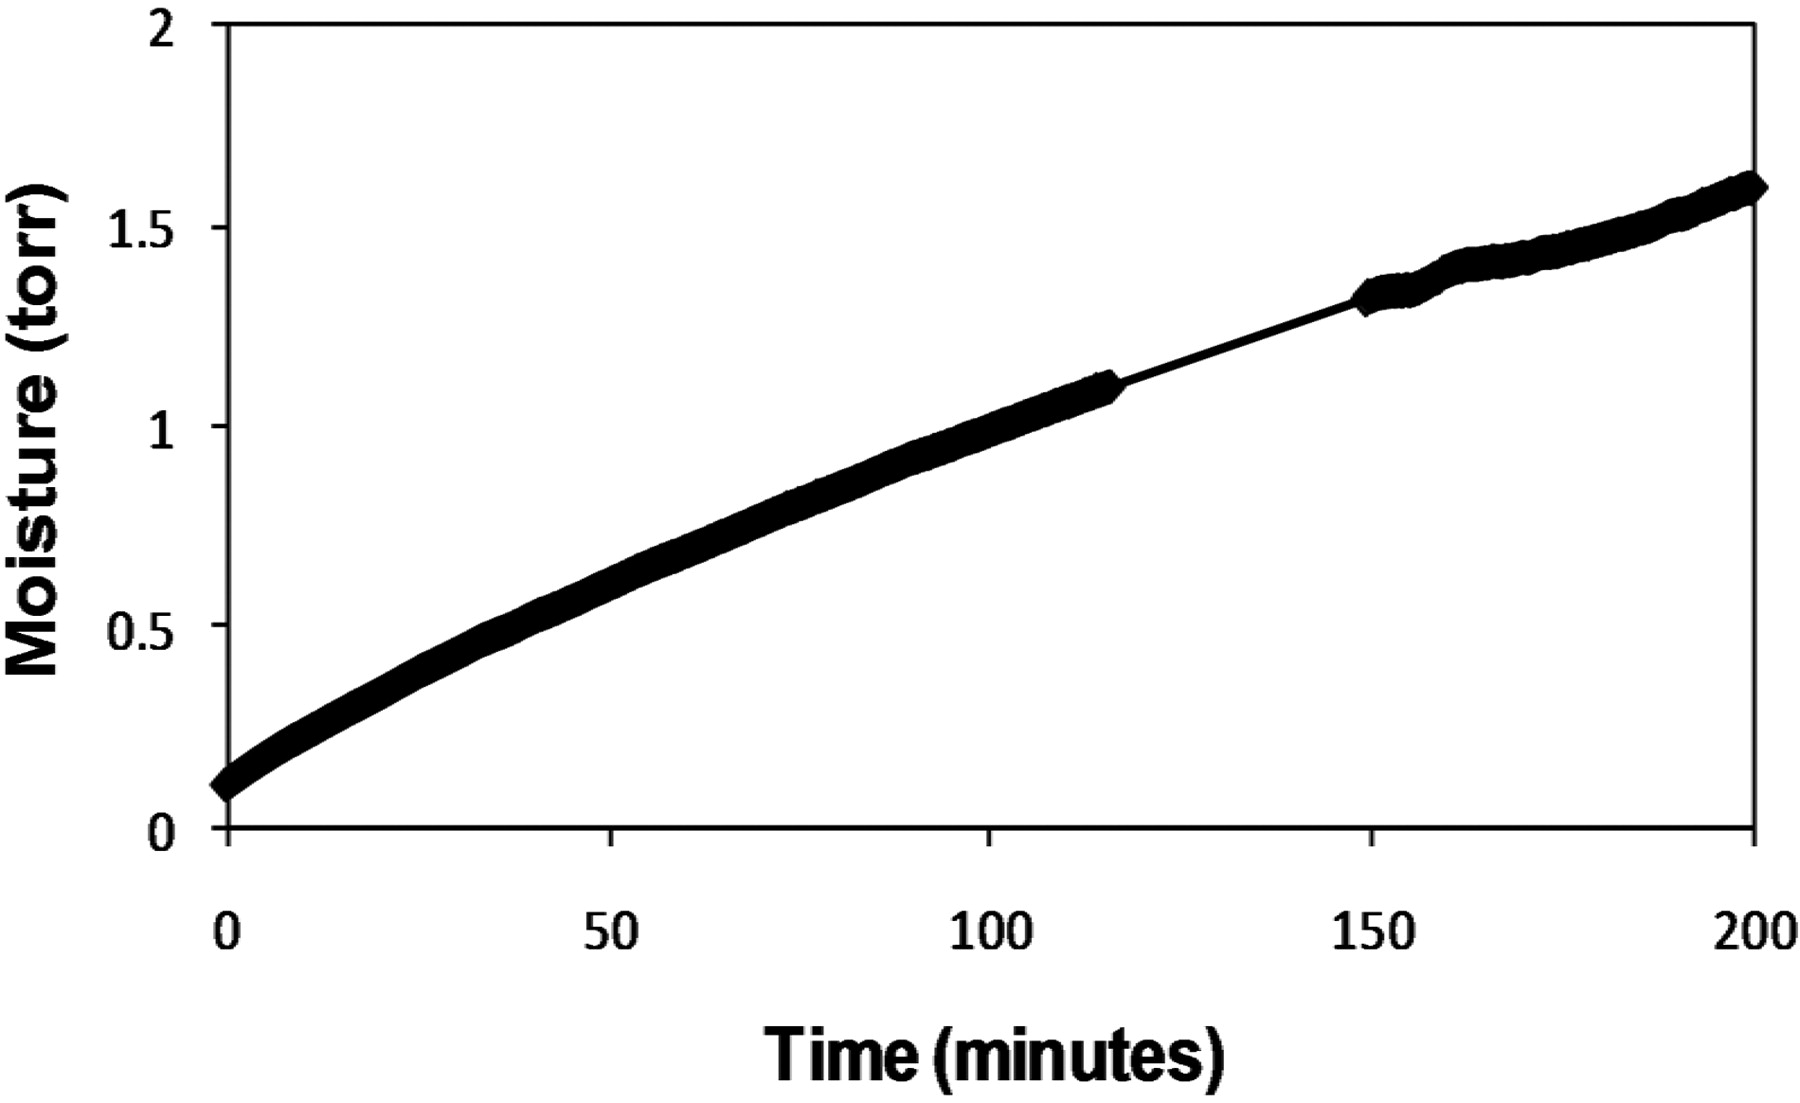
HSM measurements were made directly after the freeze-drying cycle had ended in order to assess the degree of change in HSM in the first few hours. It was noted that the pressure measurements were consistently much higher than the apparent chamber sealing pressure at the time of stoppering. This may be attributable to the low pressure in the sealed vials, in this case 50 mTorr (1/15,000 of atmosphere based on 760 Torr), causing some moisture from the stopper to be pulled into the vial headspace. This would explain the constant increase that can be observed when the vials are measured immediately after the completion of the freeze-drying cycle, as demonstrated by the data for freeze-dried poly-ethylene glycol (PEG) (mw10K) (Figure 3). This is supported by Christ (8), who noted that pressures inside vials were invariably higher than the pressure in the chamber at the time of sealing and that the increase was attributed predominantly to desorption of residual water vapour from the stopper. It is also possible that the seal is not 100% effective until a certain pressure difference is reached between the inside and outside vial pressure. Once the pressure inside the vial is much lower than the outside pressure, the stopper would be held more tightly onto the glass, giving a better seal. The seal will vary with the stopper and vial chosen and their compatibility, though the vial and stopper type chosen for this study is widely considered to give a good fit. It was also observed that a small number of vials (<2%) had a much higher sealing pressure than the rest. This could be attributable to vial and stopper variation within the manufacturers' specified tolerances, with a few of the shortest or widest-necked vials and thinnest stoppers being randomly paired together.

HSM changes in the first 200 min immediately after removal from the freeze-dryer.
Excipient Response to Stopper Moisture
Once the variations in stopper moisture had been qualified, further studies were conducted on freeze-dried excipients, as shown in Figure 4a. These data show that an increase in the HSM was clearly evident by FMS for excipients in vials with stoppers that were not oven-dried prior to lyophilization compared to those that were oven-dried. The HSM value for mannitol vials with dried stoppers (n = 16) was 3.2 Torr, SD 0.55, whereas the HSM value for mannitol with un-dried stoppers (n = 5) was 8.5 Torr, SD 0.31, which is comparable to the data shown in Table II . The HSM value for sucrose with dried stoppers (n = 16) was 1.3 Torr, SD 0.10, whereas the HSM value for sucrose with un-dried stoppers (n = 5) was 3.0 Torr, SD 0.09, indicating that the sucrose data is not comparable with Table II . The apparent disparity in results may be attributable to the difference in the material types, and specifically may be due to the amorphous sucrose and crystalline mannitol within the vials displaying different dynamics of interaction with water, resulting in a marked difference in the observed increase in HSM.
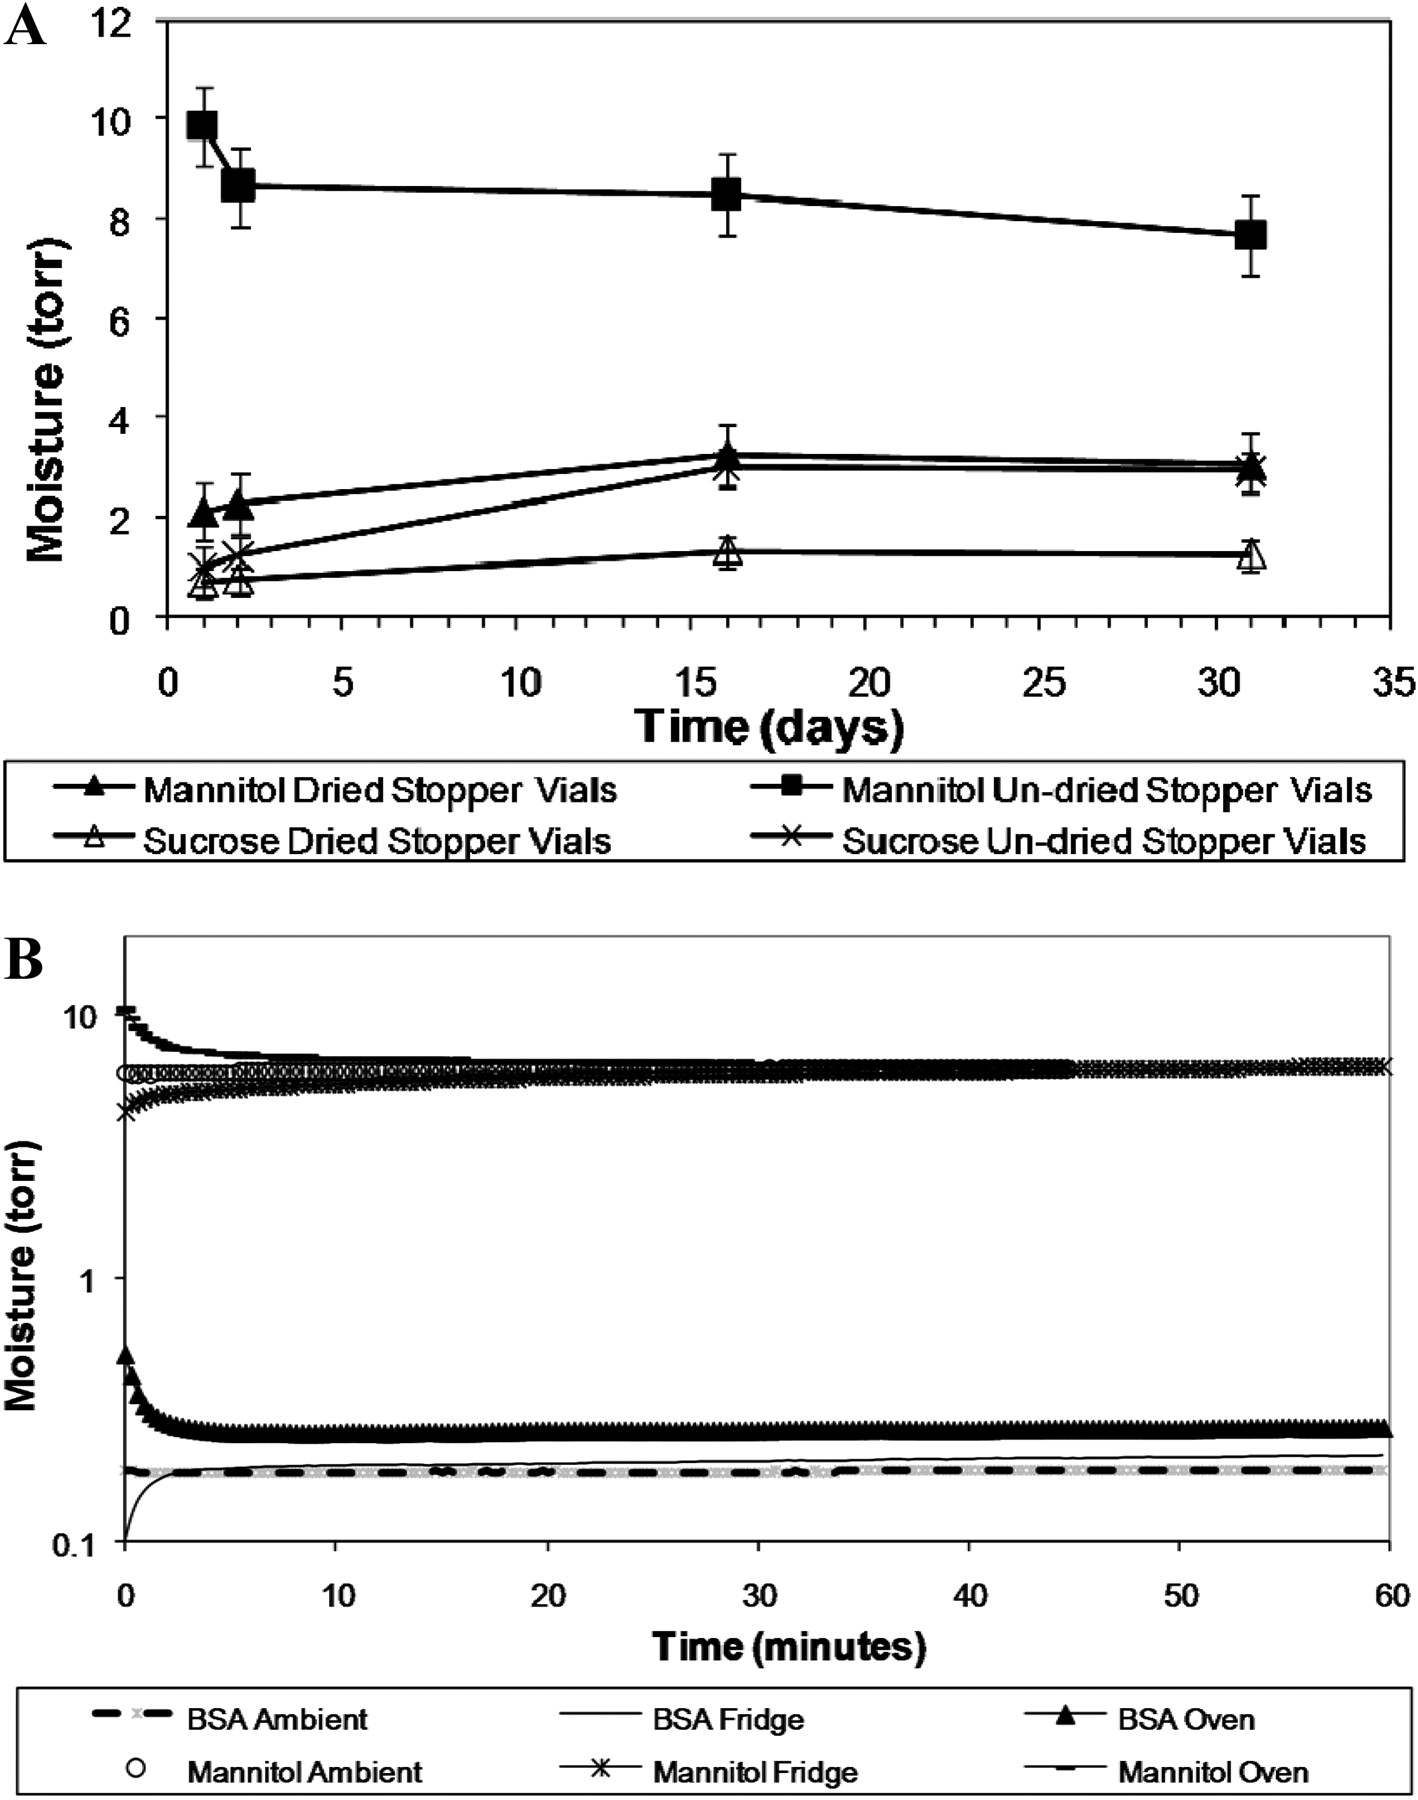
a. HSM over time for sealed sample vials with excipients and a comparison between dried and un-dried stoppers. b. HSM over time (1 h) for sample vials with excipients and stopper after storage at 25 °C, 20 °C, and 4 °C.
A difference in HSM value due to excipient type was also observed for amorphous bovine serum albumin (BSA) and crystalline mannitol, as shown in Figure 4b. Here, both excipients demonstrated a difference in HSM value due to storage temperature resulting from the different stopper moisture capacity at varying temperatures.
Long-term Changes
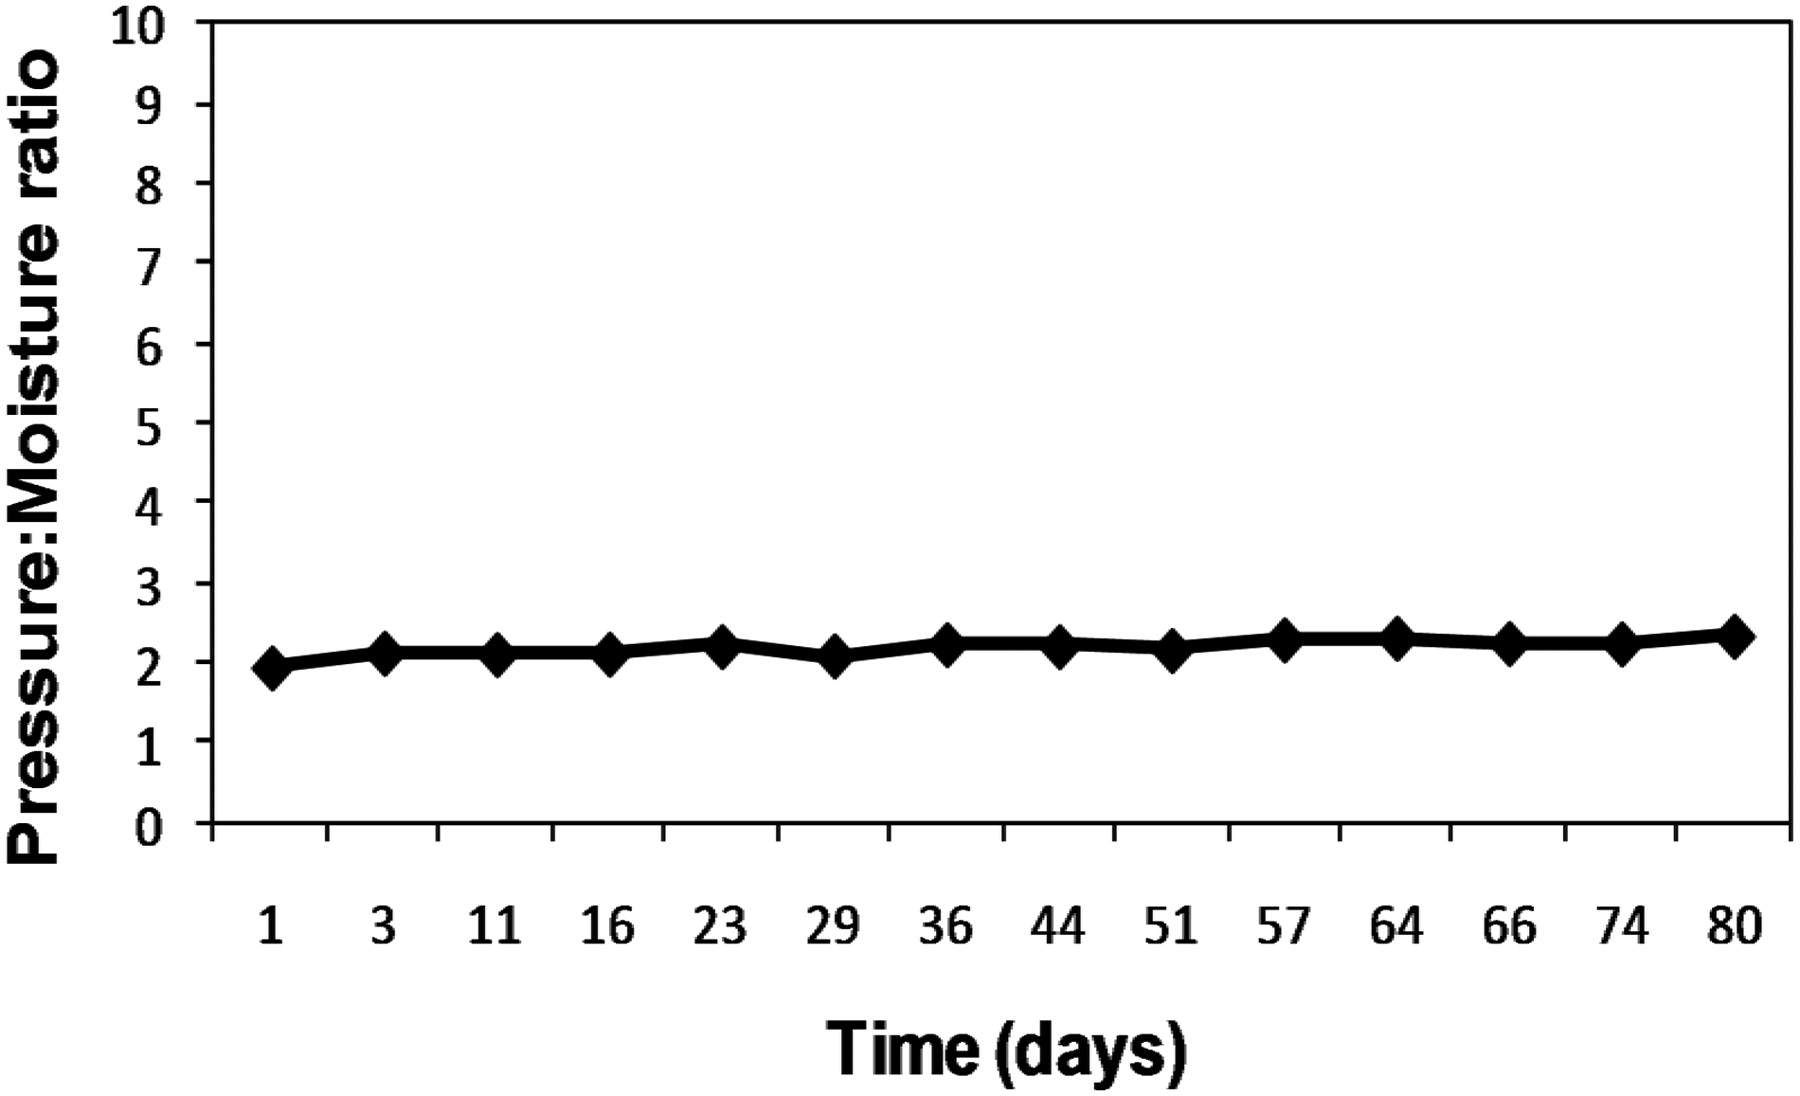
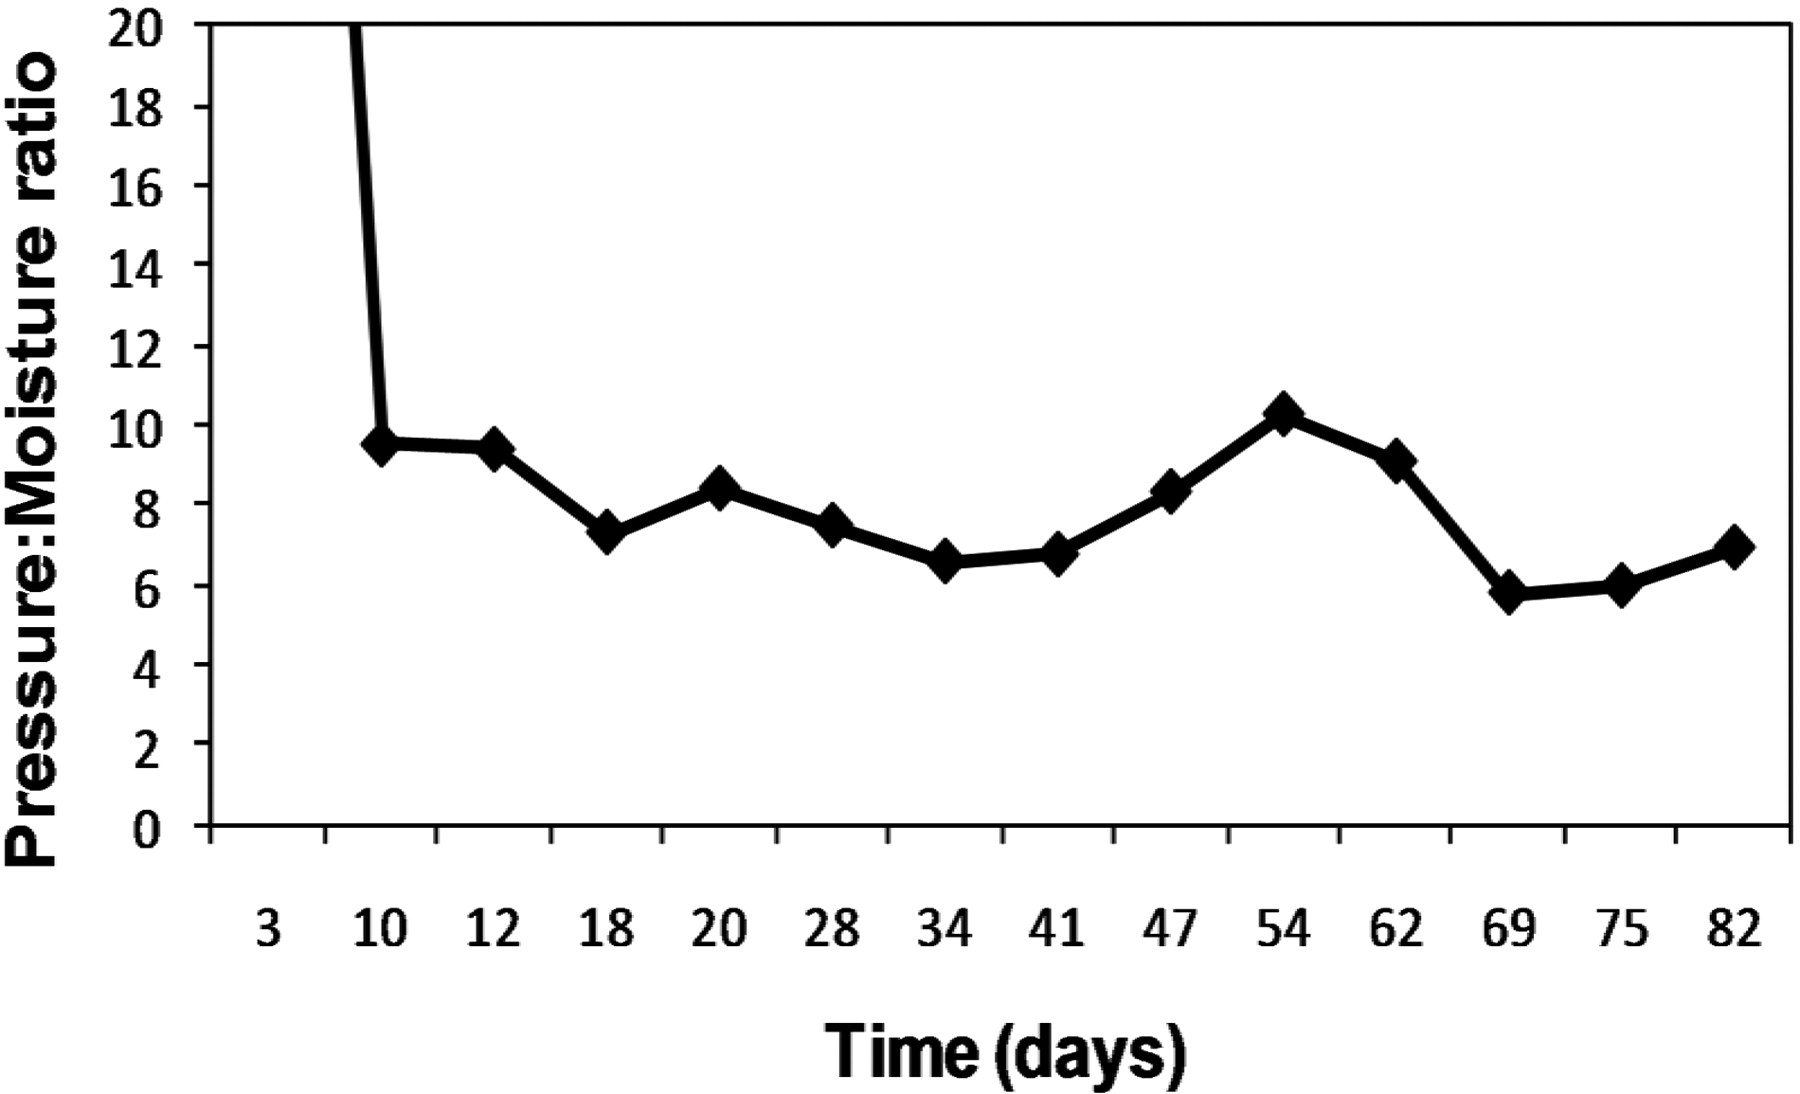
By monitoring the same selection of vials over time, it is possible to see whether any changes can be observed and whether these can be attributed to a physico-chemical change in the material form (specifically, crystallinity and polymorphism). The degree and speed of the observed change is related to the excipient type and its affinity for water, and the time taken for the moisture in the cake, headspace, and stopper to reach equilibrium. This is clearly demonstrated by mannitol (crystalline) and sucrose (amorphous). The freeze-drying cycle for mannitol produced a stable crystalline form of mannitol that has little interaction with the moisture in the headspace. Moisture sorption studies by Fakes et al. (9) demonstrate that lyophilized mannitol is practically non-hygroscopic, which may explain the observation that the HSM equilibrium was reached virtually straight away (1–2 days; see Figure 5). Sucrose is more hygroscopic, which may explain why in the present study up to 2–3 weeks were required for it to reach its moisture equilibrium point at ambient temperature (see Figure 6). Donovan et al. (7) studied changes in the cake moisture and stopper moisture under a variety of conditions and observed that moisture sorption and desorption occurred rapidly in the first 4 weeks. Further to this, Donovan et al. (7) measured moisture uptake in lactose cakes and a consequent decrease in stopper moisture. The increased moisture level observed in the cake supports the data presented here, which suggest that water is absorbed from the vial headspace and through this from the internal surface of the stopper to the cake.

Mannitol pressure moisture ratios.

Sucrose pressure moisture ratios.
Karl Fischer/Headspace Moisture (KF/HSM) Ratios
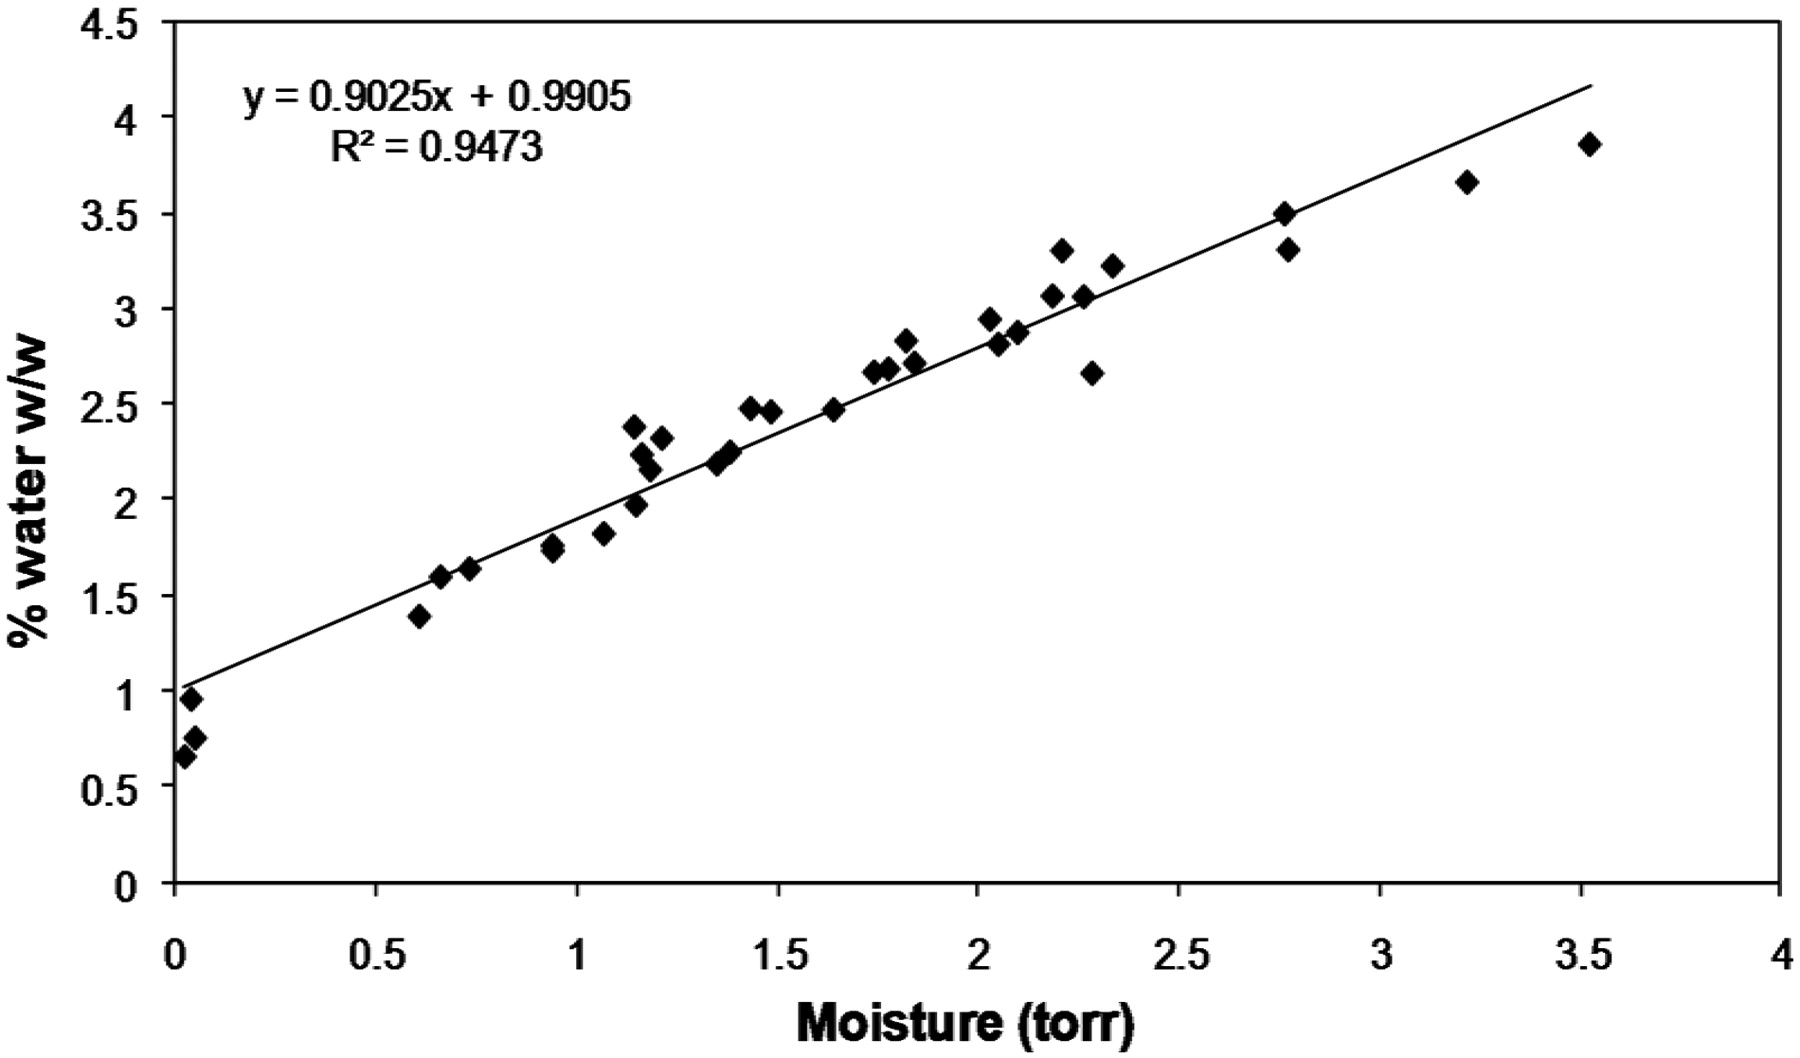
The KF/HSM ratio and correlation plot (Figure 7), along with a study of the intercept and gradient, can reveal important information about the excipient/formulation moisture balance. The KF/HSM ratio represents the natural balance between the equilibrium free water in the headspace and the moisture that resides in the cake; this can be unique to the formulation and processing conditions involved. To minimise interference from temperature and stopper effects, the same stopper type was used and measurements taken at 20 ± 1 °C. The correlation for a 4% sucrose formulation (Figure 7) was r2 = 0.95 over a range of 0.75 to 3.85% water by KF. The percentage water in the cake/sealed system by KF (percentage water w/w) alters the HSM as it changes the equilibrium free water available in the headspace; a study of these differences can provide an insight into the material type and availability of water to change the dried product properties. Table IV shows the equilibrium free water in “moisture Torr” for each “percent w/w” by KF.

KF/HMS plot for freeze-dried sucrose.
Equilibrium Free Water (Torr) for Percentage Water w/w in Sucrose According to Regression Line
Moisture Mapping
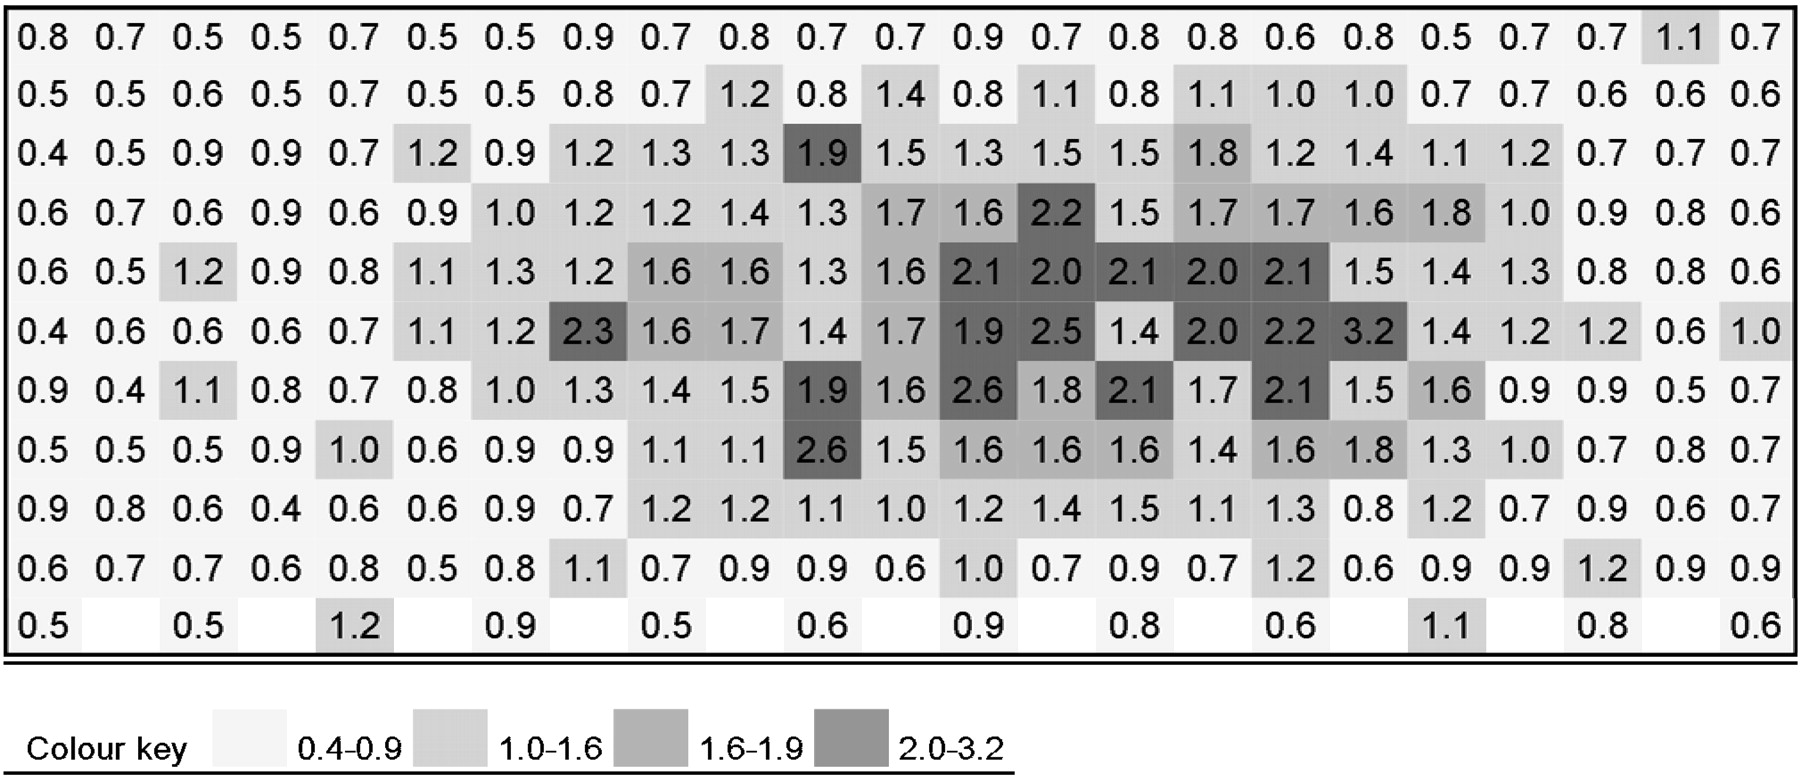
Once a material/system has demonstrated a good KF/HSM correlation then the moisture can be mapped for an entire shelf of a freeze-dryer. The data in Figure 8 represent a moisture map for an entire shelf of freeze-dried sucrose; in this case, the cycle has not been optimised and secondary drying time was deliberately short.

Moisture map for a shelf of freeze-dried sucrose.
This moisture map shows a high variation in HSM, with the lowest HSM value of 0.4 Torr (which equates to 1.3% water by KF) and the highest value being 3.2 Torr (equating to 3.9% water KF); the average value is 1.05 Torr (1.9% KF) and the SD is 0.49. Although the average result may pass a set moisture specification, many within this batch would fail a 2% (w/w) specification limit. The plot indicates that vials close to the edge as well as the front or back of the shelf have moisture contents below 2% (w/w), while higher moisture values were recorded in the centre of the tray. This observation can be explained by radiation and shielding effects; the vials towards the centre of the tray take longer to dry, as they receive less radiative heat from the freeze-dryer walls/viewing window because they are shielded by the vials around them; this explanation is supported by Rambhatla and Pikal (10).
Limit of Detection (LOD)
The LOD by FMS varies with the sealing pressure, as this affects the bandwidth of the signal; the purge rate is also important in order to eliminate any external background moisture, which is crucial to achieve an acceptable signal-to-noise ratio. It has been observed that, at a vial-sealing pressure of 50 mTorr in clear glass vials, moisture levels lower than around 0.02 Torr cannot always be detected by the instrument; a higher grade/moisture-reduced nitrogen gas may alleviate this issue, although this has not been tested to date in the present study. Amber vials also decrease the LOD because the laser light transmission is reduced. This instrument may have some limitations depending on the sealing pressure, moisture level, container type, and excipient/active ingredient type. The LOD did not affect the processing of results for this paper.
Fill Depth Changes
A change in the fill volume will alter the cake depth, material amount, and resulting cake volume/headspace volume ratio, which could in turn have an effect on the HSM content. Table V shows data obtained for different fill volumes for two different cake materials.
Moisture and Pressure Torr Results for Different Fill Volumes and Excipient Type
Freeze-dried PEG is a crystalline material (11) and like mannitol due to its stable crystalline form it is unlikely to absorb or interact with the HSM; therefore a doubling in the fill depth leads to no significant change. Sucrose shows a clear difference in the 1.5 mL and 3.0 mL fill with a significant decrease in the observed HSM. As discussed for Figure 5 above, sucrose remains amorphous on freeze-drying and has demonstrated that it will absorb moisture from the headspace/stopper. Therefore, a greater mass of sucrose from a 3 mL fill leads to an increase in the amount of HSM absorbed, and hence a decrease in the observed HSM value, as shown in Table V . The pressure is relatively constant, but a decrease in the HSM leads to an increase in the pressure/moisture ratio. These data show that a change in the fill volume will not necessarily be apparent using HSM measurements, as fill depth and HSM may not have a linear correlation. KF moisture analysis revealed both formulations and fill depths to have similar percentage w/w moisture content, which was partly due to the conservative cycle allowing both fill depths and formulations to dry sufficiently. In addition to this, it has been observed that cake thickness does not significantly affect secondary drying kinetics (12). It also demonstrates that even though the moisture content for both sucrose fill depths was similar, the greater difference in the HSM readings observed was most likely due to the higher mass of hygroscopic material that was able to absorb the HSM into the cake.
Conclusion
Headspace moisture (HSM) can be dynamic, and it is important to fully understand the factors affecting HSM results. Temperature is an important factor affecting not only the stopper moisture equilibrium but also the level of moisture either available or already within the cake. The excipients play a critical role in the extent and dynamics of water exchange between product, stopper, and headspace. If excipients are hygroscopic, then they will absorb higher levels of any moisture ingress from the stopper and potentially keep the moisture away from damaging the active material; therefore the formulation is important from this standpoint as well as for other established reasons (e.g., suitability of re-hydrated vaccine for injection and protection of active material during the freeze-drying process). If, on the other hand, the excipients in the cake are predominantly crystalline with little or no amorphous content then it is likely that their hygroscopicity is low and therefore any moisture ingress from the stopper may go directly to the active material, with the excipients offering little or no protection from increased HSM levels; in this case, even a small amount of moisture ingress could reduce the stability of the active component and is especially significant for low solid dose products.
This study demonstrates some of the complexities involved in understanding the “nature” of the water present in lyophilized products and establishes the importance of gaining a thorough understanding of the excipients, the various process conditions, temperature, storage, stopper properties, and changes over time in order that HSM values can be fully understood. It is important that the same stopper/vial system set up is used and that if any changes are made then these are studied and any resulting variations assessed.
It has been shown that once the processes are understood for a particular system and set of parameters, then the analysis of HSM could enable 100% inspection of a freeze-dried batch, moisture mapping of a freeze-dryer shelf, and further batch monitoring over time. KF/HSM correlations could be used to gather more information on the freeze-drying process as well as furthering the understanding of the material/moisture interactions within a sealed system. A more in-depth study of KF/HSM ratios and an extension of the moisture mapping research is currently being conducted.
Conflicts of Interest
The authors declare that they have no competing interests.
Acknowledgments
The authors would like to thank Mervyn Middleton, Thomas Peacock, Karen Robinson, and Marc Townell for their assistance with the laboratory work. The authors would also like to thank Derek Duncan and Jim Veale of Lighthouse Instruments for the loan of the FMS-1400 instrument.
- ©PDA, Inc. 2011


Jump to section
Related Articles
Cited By...
- The Application of Noninvasive Headspace Analysis to Media Fill Inspection
- Container/Closure Integrity Testing and the Identification of a Suitable Vial/Stopper Combination for Low-Temperature Storage at -80 {degrees}C
- Headspace Moisture Mapping and the Information That Can Be Gained about Freeze-Dried Materials and Processes