
Abstract
For direct flow sterilizing-grade filtration, a linear scale-up between the performance of discs and pleated filter cartridges has traditionally been assumed. Linear scale-up assumes that the filtration performances, defined here as filter flux and capacity, scale linearly with the membrane area and remains independent of the selected device formats. However, experimental results show that the later assumption does not hold in all cases. In this article, we investigated the effect of solution properties and operating parameters on scale-up with both fouling and non-fouling feeds. For non-fouling solutions, such as buffers, the flux ratio, defined as α, between pleated filter cartridges and disc filters range from 0.5 to 0.85. For complex fouling feeds, such as protein or cell culture media solutions, the ratio of initial flux between pleated filter cartridges and discs was the same as the flux ratio, α. For fouling solutions, the ratio of filtration capacity between pleated cartridges and discs, referred to as capacity ratio, β, was variable. We found that β was sensitive to the particle size distribution of the challenge solution and the mode of filtration operation (constant pressure or constant flux), whereas it was less sensitive to the magnitude of the operating pressure or flux and concentration of the fouling species. For most conditions tested, β among pleated cartridges and discs was within ±20% variation of unity. At the end, we present a modified standard model that accounts for both variations in flux ratio, α, as well as capacity ratios, β, for estimating the requirement for membrane area at manufacturing scale with proteinacious fouling and non-protein/non-fouling feeds. The data show that for cases where filtration is capacity controlled, flux ratios between the pleated filter and disc are not critical. For such cases, the use of a high-area laid-over pleated cartridge construction allows for reducing the number of 10 inch pleated filter cartridges required to process the batch volume.
LAY ABSTRACT: Scale-up remains at the core of a process development. For direct flow sterilizing-grade filtration, a linear scale-up between the performance of discs and pleated filter cartridges has traditionally been assumed. Linear scale-up assumes that the filtration performances, defined here as filter flux and capacity, scale linearly with the membrane area and remains independent of the selected device formats. However, experimental results show that the later assumption does not hold in all cases. We investigated the effect of solution properties and operating parameters on scale-up from membrane disc to pleated filter cartridges. Typical values of flux and capacity ratios and the guidelines on scale-up of direct flow filters from bench-scale to manufacturing-scale are presented. Specifically, we found that the flux ratio for pleated filter and small-scale disc range from 0.5 to 0.85, and capacity ratio for most cases is within ±20% variation of unity, with some exceptions.
- Membrane filtration
- Scale-up
- Pleated filters
- Sterilizing-grade filters
- Feed characteristics
- Effect of operating parameters
1. Introduction
Biopharmaceutical manufacturers commonly use direct flow membrane filter cartridges for sterilization, mycoplasma removal, and virus clearance of culture media; sterile filtration of intermediate or final product solutions; bioburden reduction throughout a process train; and protection of chromatography columns from fouling. Typically, bench-scale “scale-down” studies for initial screening and preliminary filter sizing are conducted with flat membrane discs (often 3–20cm2 in effective membrane area). Large-scale filter area requirements are traditionally determined by assuming a linear scale-up from bench-scale studies and by incorporating an additional safety factor to account for the variations in performance at large-scale. Linear scale-up assumes that filtration area increases proportionally to the volume of biological solution that needs to be processed, for example, an increase of tenfold in the volume would require a tenfold increase in the surface area of the filter. As drug manufacturers seek to improve process economics by sizing filters more accurately, an expanded understanding of the scale-up from discs to pleated filters has become increasingly vital (1). Such an understanding requires consideration of both the flux (flow rate per effective filtration area) through the filter and filtration capacity (volume per unit area processed to a set flux decline in constant pressure mode or to a set pressure limit in constant flow mode) (2).
For non-fouling solutions, where filter sizing is limited by flux only, accurate scale-up requires the use of a permeability or flux ratio. The flux ratio, α, is defined as the ratio of the flux normalized by applied differential pressure through a pleated membrane filter cartridge to that of a disc of the same membrane material (eq 1).
 where J0, disc and J0, cartridge are the initial flux, in units of L/(m2·h), or LMH, for applied pressures of P0, disc and P0, cartridge when tested in disc and pleated filter cartridge format, respectively.
For fouling solutions, where filter sizing is limited by filter capacity, accurate scale-up from a disc to pleated filter cartridge assembly configuration requires the use of a capacity ratio (eq 2). This is defined as β, the ratio of the capacity of a pleated filter cartridge module to the capacity of a flat disc configuration (both expressed per unit of effective filtration areas).
 where Vmax, disc and Vmax, cartridge are the membrane capacities at complete fouling when tested in disc and pleated filter cartridge format, in units of L/m2. Vmax (3) is sometimes also referred to as Vcap (4). Based on the standard fouling model (5), the capacity ratio at complete fouling is the same as the ratio of filtration capacity obtained at a selected value of flux decay (i.e., 90% flux decay).
Several studies have investigated the flow of fluids in pleated filters (2, 6⇓⇓⇓⇓⇓⇓⇓⇓⇓⇓⇓⇓–19). It is well established that for non-fouling solutions, the average flux at a given applied differential pressure across a pleated membrane cartridge is lower than flat discs (2, 6, 10, 17, 19). The lower permeability observed in pleated devices mainly results from the additional pressure drop associated with the upstream support and downstream drainage layers (17). This effect may change with different filter designs and membrane/support layer permeabilities (2, 6, 10, 19, 22). Other factors such as pleat density and pleat compression are also reported to affect scale-up (12).
Although extensive work has been performed on non-fouling solutions, very limited work has been performed on understanding the scale-up for proteinaceous fouling feeds. Among those, Giglia et al. (19) reported that the capacity ratio, β, was within ±10–20% of unity for solutions tested. In another study, Brown et al. (17) reported 30–40% higher filter capacity for 0.2 μm–rated pleated membrane filter cartridges than through discs with 10 g/L pepsin solution in phosphate buffer. This translates to a capacity ratio, β, of 1.3–1.4. In a third study (20), the authors presented data showing that for most of the fluids tested, the scaling factor or the capacity ratio was close to or greater than unity, except for one particular case. It was noted that with cell culture media solutions containing larger than 10 μm size particulates, the capacity ratio was less than 1. A similar effect was observed with filter cartridges incorporating different pleat geometries with the particular challenge solution (20). As is evident from some of the apparent inconsistencies in the conclusions of these studies, an improved understanding of the scale-up from disc to pleated filters is required.
This article describes the investigation on the scale-up among different filter formats for a range of process and filter parameters as summarized in the Materials and Methods section. The article also provide general guidelines on the typical values of flux (α) and capacity (β) ratios for estimating the membrane area required to process a batch in manufacturing.
2. Materials and Methods
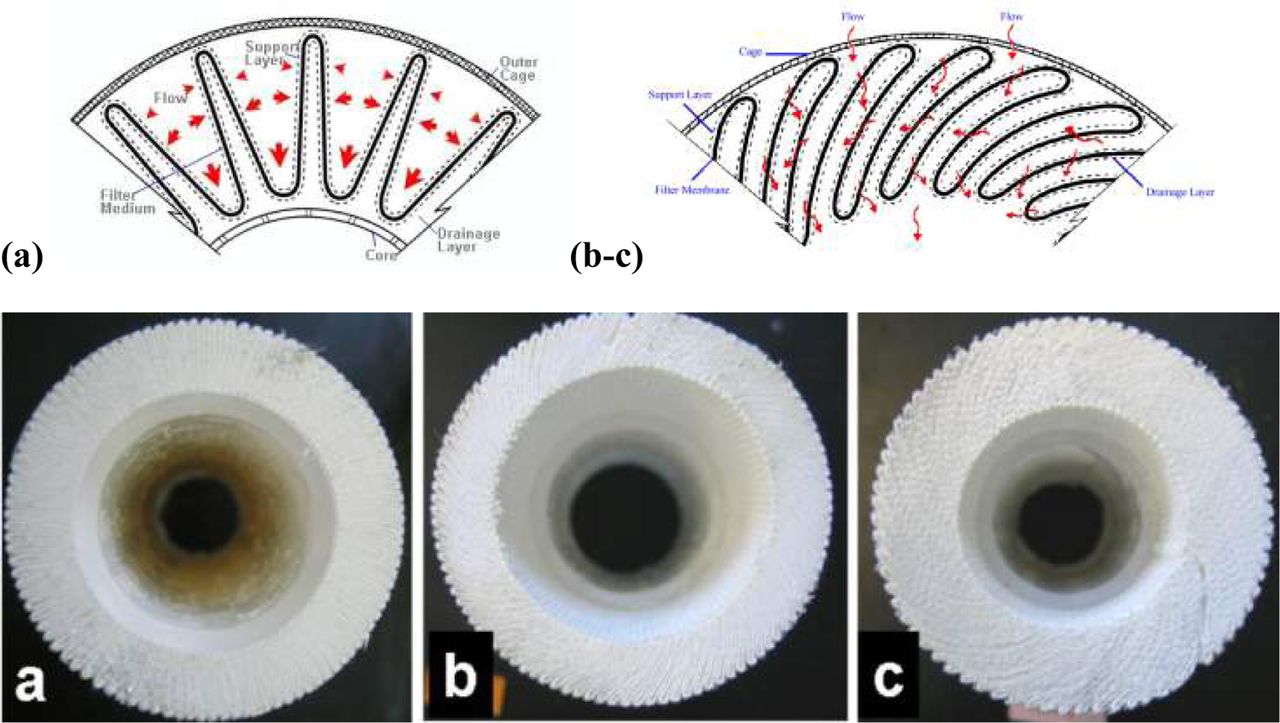
The experimental study conducted involved focusing on three areas. First, for understanding the effect of cartridge parameters, we tested (a) membranes with different pleating configurations (traditional fan pleat versus laid-over crescent pleat, or LOP, Figure 1), (b) pleat heights (by selecting cartridge constructions with different inner core diameter), and (c) relative ratio of the membrane resistance to the lateral resistance of the support layer (by selecting 0.1 μm–rated and 0.2 μm–rated membranes). Second, for understanding the effects of feed properties, we varied (a) the nature of the feed solution (protein, culture media, and hydrolysate), (b) the concentration of the fouling species, and (c) particle size distributions. Third, for understanding the effects of filtration conditions, we varied (a) the mode of filtration operation (constant pressure versus constant flow) and (b) the magnitude of operating pressure or flow rate. In this section, further details to our experimental approach are presented.

Schematic showing pleat structure and flow direction in (a) a traditional fan pleat pleating geometry and (b, c) a LOP pleating geometry with (b) standard-inner core and (c) narrow-inner core geometry.
2.1. Materials
2.1.1. Filters:
The properties of the membrane filters used for the scale-up studies are summarized in Table I. Several sterilizing grade membranes with ratings of 0.2 μm—0.2 μm polyethersulfone (PES)/0.2 μm polyvinylidene fluoride (PVDF), and 0.65 μm PES/0.2 μm PES—and 0.1 μm—0.2 μm PES/0.1 μm PVDF and other similar micron-rated filters—were used. For a selected membrane media, two formats were used: flat disc and pleated filters. Pleated filters themselves were either “star” pleat or LOP (Figure 1) (21). The LOP configuration is further categorized into small and standard inner core configurations with 18 mm and 23 mm inner core radii, respectively (Figure 1). For pleated filters, a 1 inch or 10 inch cartridge elements were used for testing. The selected 1 inch cartridge element used in the study is a direct scale-down version of the 10 inch, 20 inch, and 30 inch filter cartridges. The pleated filter cartridges provide up to a 1000 fold scale-up from 47 mm diameter disc to a 10 inch cartridge element. Depictions of the different pleating formats are shown in Figure 1.
List of Membrane Filters Used for Scale-up Studies
2.1.2. Challenge Solutions:
A list of challenge solutions used is summarized in Table II. Both protein solutions and cell culture media supplemented with peptones were used for filtration studies. The protein solutions were prepared in 0.1 M phosphate buffer (pH 7.4) in 10 kD filtered deionized water (conductivity 0.55 μS/cm). Cell culture media solutions were prepared by supplementing the manufacturer's recommended concentration of 13.4 g/L Dulbecco's Modified Eagle Medium (DMEM, catalogue number D5648-50L, Sigma Aldrich, St. Louis, MO) in 10 kD deionized water with a soy peptone (Hy-Soy T, catalogue number P6463, Sigma Aldrich) or porcine-based hydrolysate (PP3, Proteose Peptone No. 3, catalogue number 211693, BD Biosciences, Franklin Lakes, NJ). Each solution was freshly prepared by mixing its components for 30–60 min in a 500 L tank and was used within 6 h of preparation. Different concentrations of proteins and protein hydrolysates were used to assess the effect of solution concentrations on filtration capacity and the capacity ratio, β. The feed solutions were characterized for size of larger impurities and undissolved suspended particles using dynamic light scattering (DLS, Microtrec, Montgomeryville, PA) and microscopic imaging (CX31 Microscope, Olympus, Center Valley, PA).
Challenge Solutions Used for Filter Capacity Studies
2.2. Methods
2.2.1. Measuring Water Permeability:
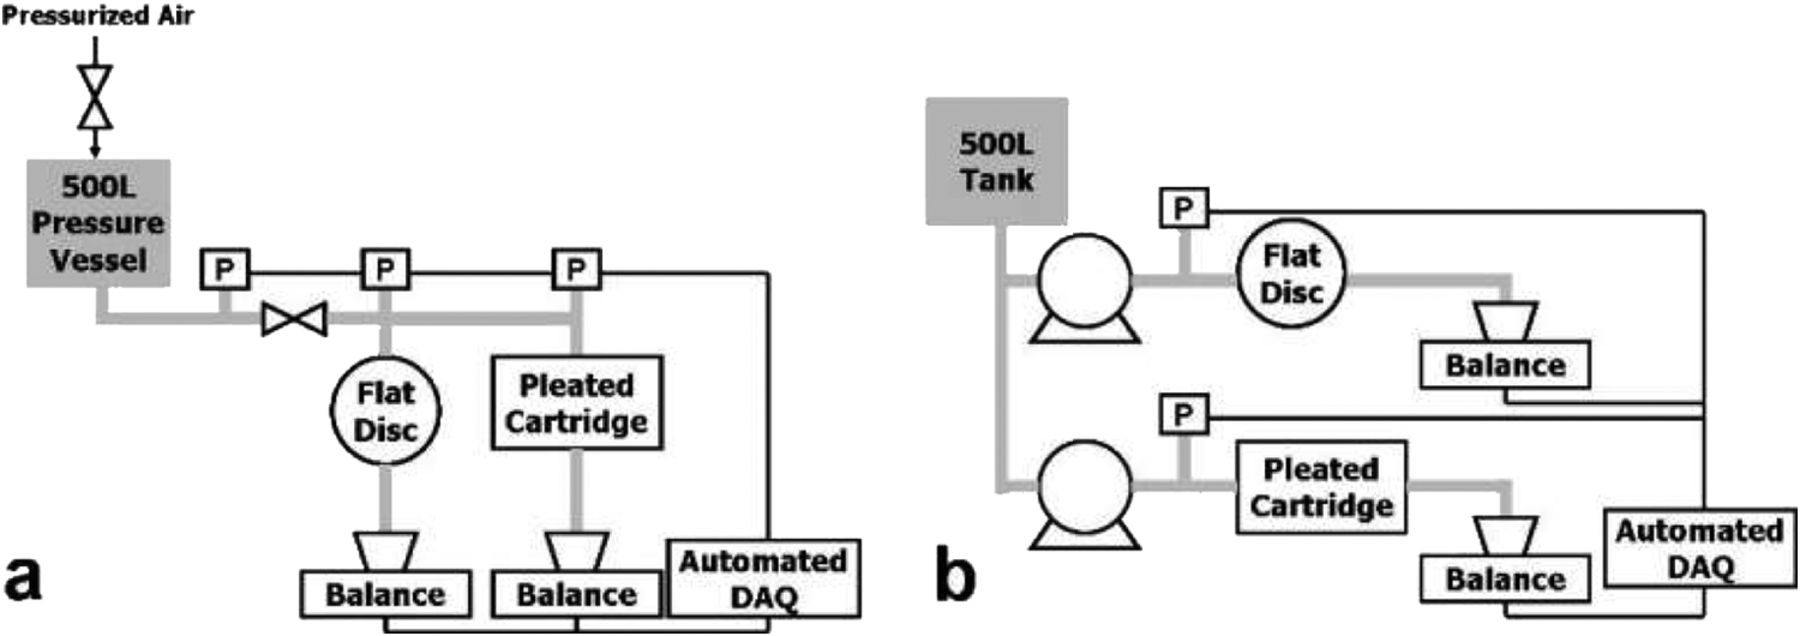
Prior to filtering the challenge solutions (as described in Section 2.1.2), each filter format was characterized via water permeability measurement. Prefiltered deionized water was filtered at a constant differential pressure, and filtrate weight was recorded at regular time intervals using an automated data acquisition system (Figure 2a). The water permeability of each filter was then calculated as the average flow rate per unit membrane area normalized by applied pressure (in units of LMH per psid).

Schematic of the experimental setup for (a) water permeability measurement and constant pressure filtration and (b) constant flow filtration studies.
The permeability was temperature-corrected to the equivalent permeability at 20 °C to account for differences in water viscosity as a result of variations in ambient temperatures (23). A disc and a 1 inch or 10 inch cartridge with each membrane type were run in parallel. After characterizing filters for water permeability, they were removed from the test stand and were kept in deionized water (the membrane disc was kept in its housing). The filters were then used to filter a challenge solution.
2.2.2. Constant Pressure Filtration:
For constant pressure filtration studies, the same experimental setup was used as described earlier for water permeability measurement studies (Figure 2a). The challenge solution was prepared in the 500 L pressure vessel. The filters were reconnected to the equipment. The pressure vessel was pressurized to the selected operating pressure. Filtration was conducted in parallel through different filter formats to ensure a consistent challenge solution. Filtration was stopped when the flow rate through each filter format decreased to 10% of its initial value (i.e., 90% flux decay was reached). Filter-to-filter variability was assessed by repeating this procedure with new filters, for both discs and pleated cartridges, using the same preparation of feed solution. We conducted at least two runs for each filter format and conducted third run when there was feed solution available. The effect of operating pressure on the filtration performance was assessed by performing experiments for differential pressures ranging from 5 to 20 psid.
2.2.3. Constant Flow Filtration:
A schematic of the experimental setup is shown in Figure 2b. For constant flow filtration studies, the same flux was used for all filter formats. The end point of filtration was determined when a differential pressure of 20 psid was reached across the filter. As was the case with constant pressure filtrations, we conducted at least two runs for each filter format and conducted third run when there was feed solution available. To assess the effect of operating flux on scale-up, experiments were performed for operating flux ranging from 250 to 1000 LMH.
3. Results and Discussion
3.1. Flux Ratio
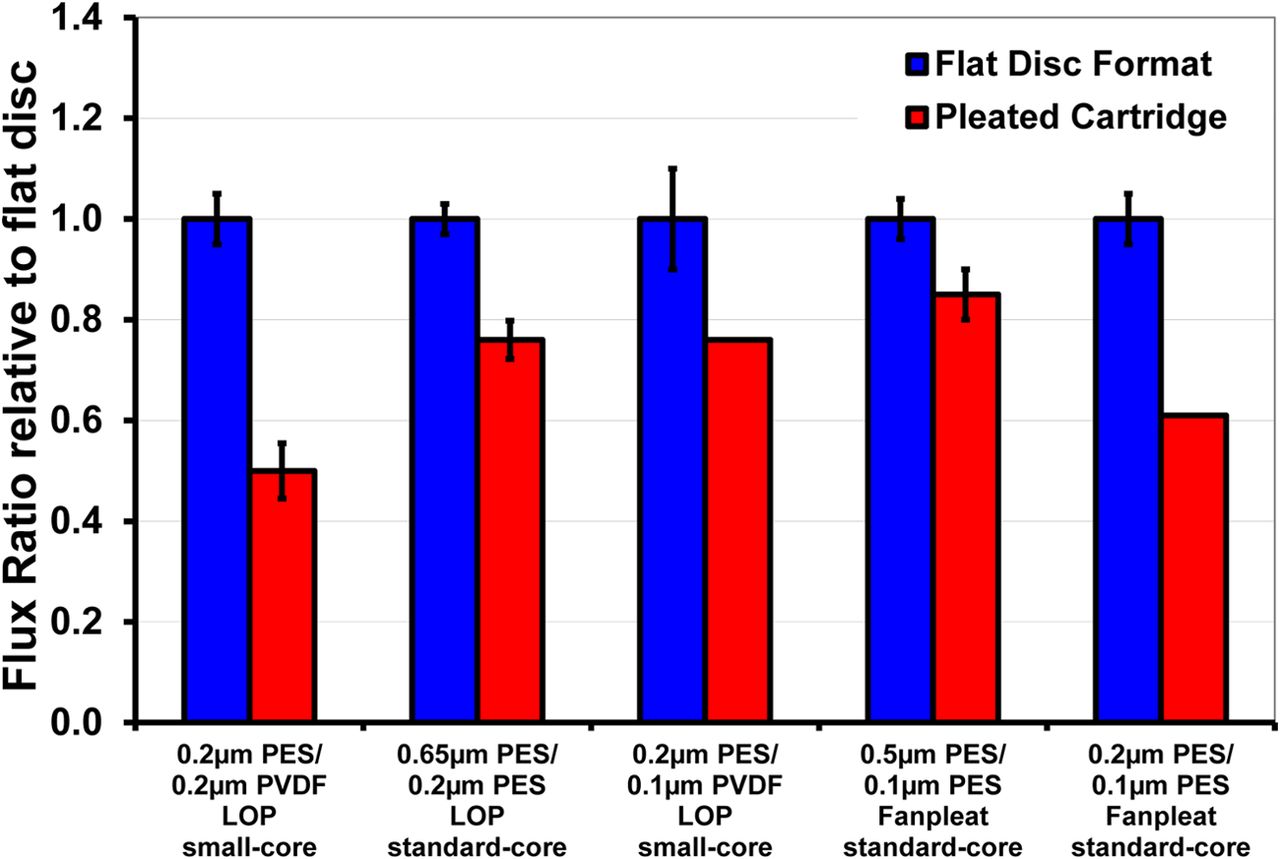
The flux ratios (α) for a pleated filter relative to a flat disc format are shown in Figure 3. The flux ratio ranged from 0.50 to 0.85. To investigate the effect of membrane permeability on flux ratio, we compared 0.2 μm PES/0.2 μm PVDF and 0.2 μm PES/0.1 μm PVDF membrane cartridges. Both cartridges have the same pleat height, similar pleat packing density, and the same support layer material of construction. The 0.2 μm PES/0.1 μm PVDF has lower membrane permeability relative to 0.2 μm PES/0.2 μm PVDF membrane. As the permeability of the membrane decreases, the relative impact of the support layer lateral resistance on the cartridge flow rate decreases, resulting in a higher flux ratio (0.75 in comparison to 0.50). For the investigation of the effect of pleat height, we compared two 0.2 μm–rated (0.2 μm PES/0.2 μm PVDF and 0.65 μm PES/0.2 μm PES) membrane cartridges, where the latter had smaller pleat height. The data suggests that the smaller pleat height contributed to an improved flux ratio (0.75 in comparison to 0.50) (7). This observation is in agreement with Brown et al. (10) on the influence of pleat height and pleat packing density on flux ratio. Brown et al. (10) hypothesized that the lower flux ratio observed in pleated cartridges was due to the limited accessibility of the membrane area in a pleated filter design, which in turn could led to a lower flux ratio for pleated cartridges relative to the disc format.

Plot showing the flux ratios with various filter formats and various sterilizing-grade media. The test fluid was deionized water. The flux ratios ranged from 0.50 to 0.85. Among different filters tested, 0.2 μm PES/0.2 μm PVDF pleated cartridges had the lowest flux ratio. The error bar for both disc and pleated filter shows variability observed among different runs.
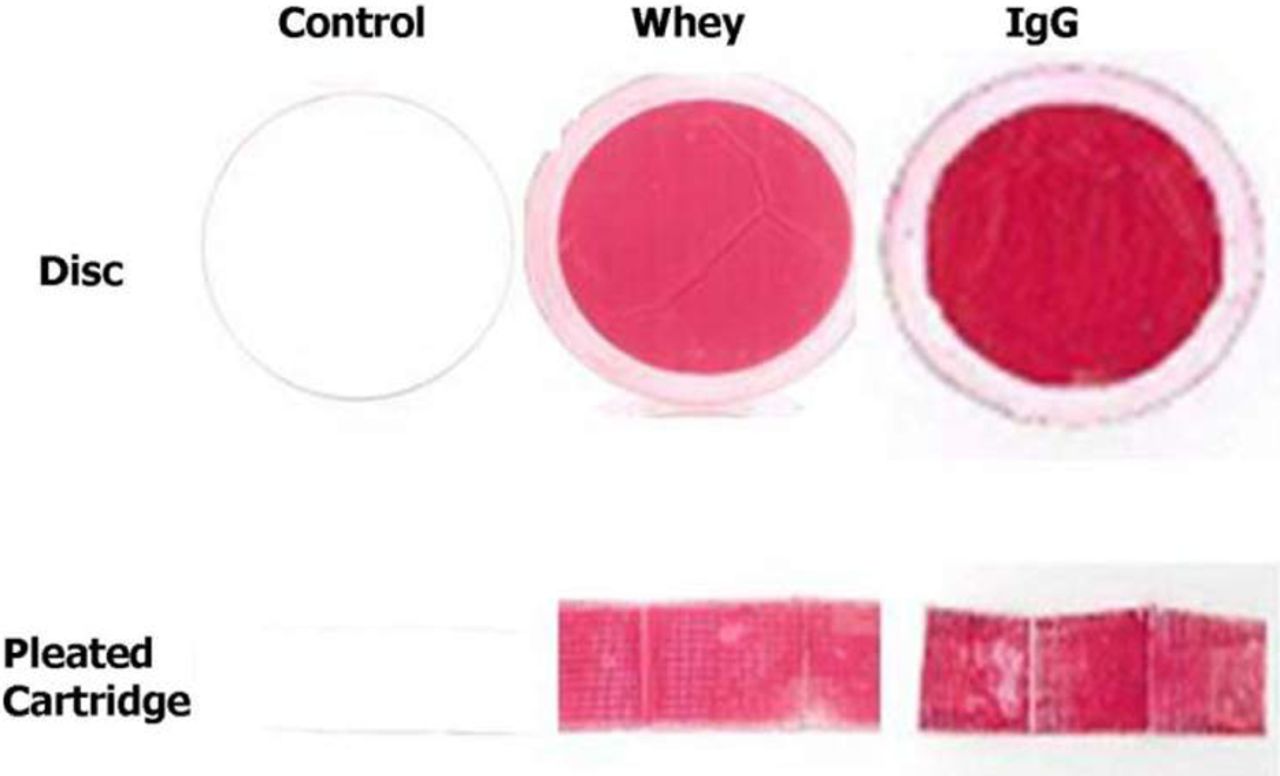
To investigate this effect, we selected the 0.2 μm PES/0.2 μm PVDF “small core” LOP filter configuration, which, among all filters selected, had the lowest flux ratio (Figure 3). Two different protein solutions, 1 g/L bovine immunoglobulin (IgG) and 0.02 g/L bovine whey, were prepared in pH 7.4 phosphate buffer. These solutions were filtered through both disc and pleated cartridge elements under constant pressure mode of operation until the flux across the filters dropped to 10% of its initial value. After allowing the filters to dry at room temperature for 1 week, the cartridges were carefully dissected and then immersed in a protein-staining dye (Ponceau S) solution. The areas where protein was deposited on the membrane stain red, thus identifying the regions within the pleated cartridge that were accessible to protein filtration. The photographs, shown in Figure 4, show nearly 100% coverage of red color for a pleated filter, confirming that majority of the decrease in water flow rates observed with pleated cartridges are not associated with inaccessibility of membrane area, but rather with the hydrodynamic effects in term of an extended lateral path length in the support layer for longer pleats.

Representative samples of membranes after filtering 1 g/L IgG and 0.02 g/L whey through the 0.2 μm PES/0.2 μm PVDF membrane. Post-protein filtration, the membranes were immersed in a protein-staining dye, and protein deposited on the membrane stains red while the membrane remains white. The top layer shows photographs of 47 mm discs and the bottom layer shows photographs of LOP configurations. A uniform red color indicates that all of the membrane area was accessible for filtration.
In summary, we find that (a) for various pleated filters tested, α range from 0.50 to 0.85; (b) losses are more pronounced for pleated cartridges with longer pleat lengths and constructed with higher permeability membranes; and (c) that the flow losses are not associated with inaccessibility of membrane area in pleated filter, but rather with the hydrodynamic effects.
3.2. Capacity Ratio
3.2.1. Effect of Operating Conditions and Solution Properties:
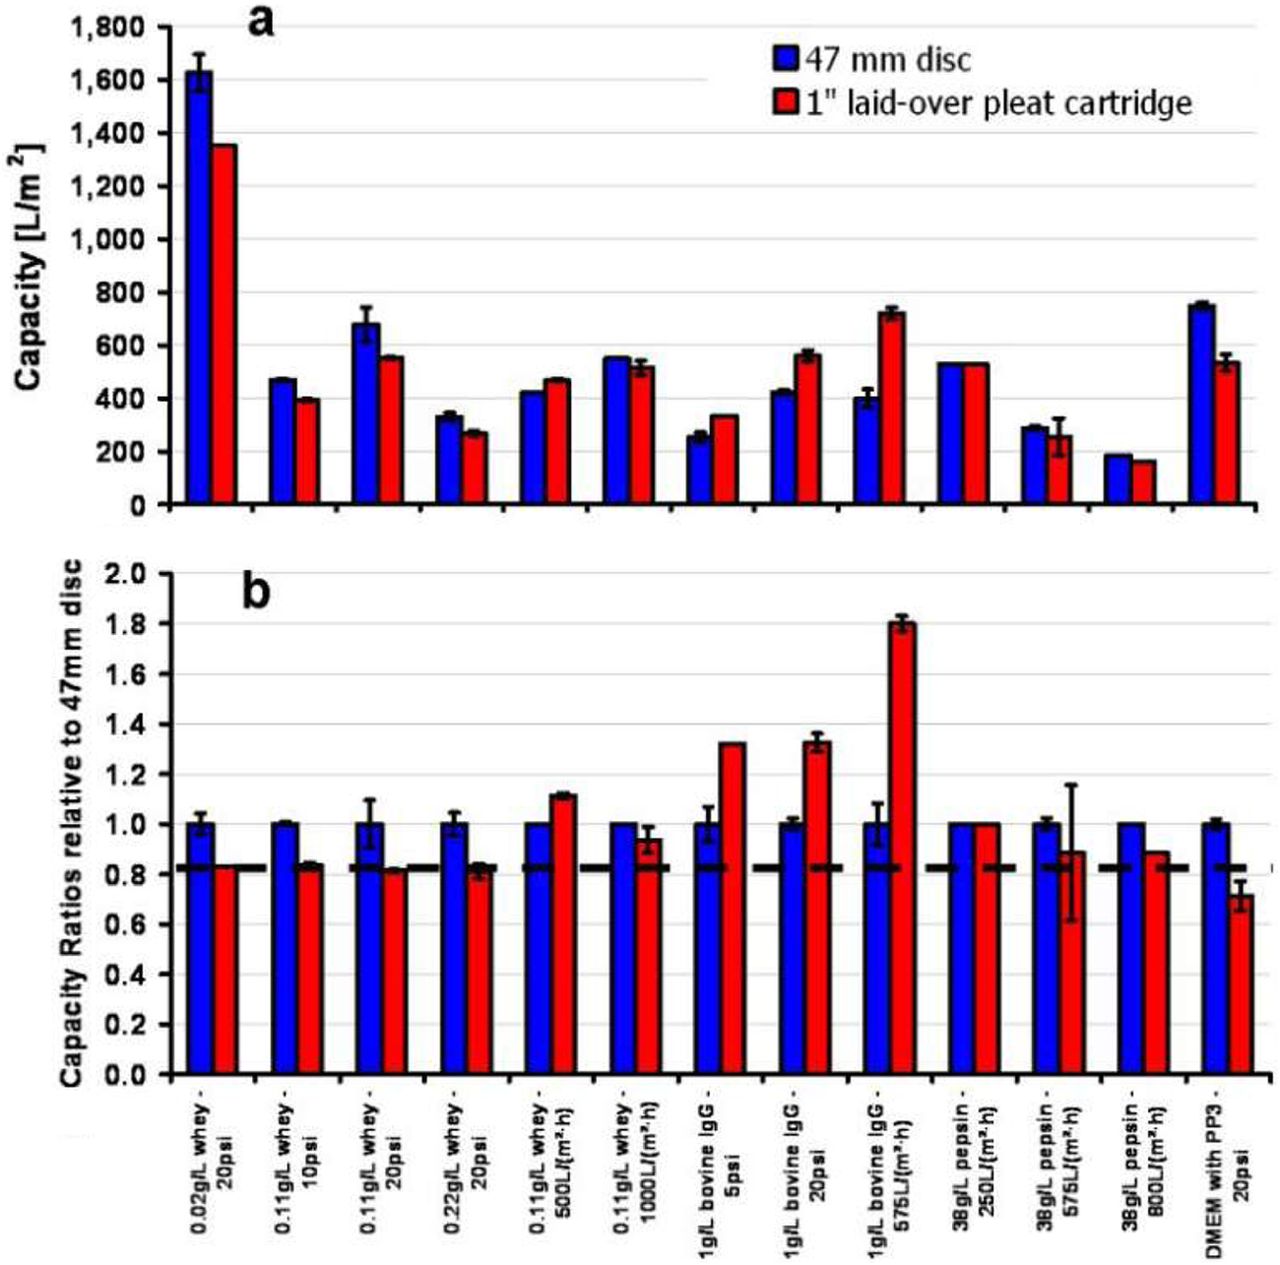
Filtration studies were performed with the 0.2 μm PES/0.2 μm PVDF filter using different operating conditions to understand the effect of operating parameters on capacity ratios. The operating conditions include varying the mode of operation (constant pressure versus constant flux), magnitude of operating pressure or flux values, and the nature (model protein and culture media solutions) and concentration of challenge solutions. The results in Figure 5 show that a wide range of capacity ratios, ranging from 1.8 for a polyclonal antibody (IgG) protein solution to 0.7 for DMEM supplemented with PP3, were observed for the LOP filter configuration.

Plot showing (a) filter capacity, and (b) capacity ratios relative to 47 mm discs, for 0.2 μm–rated (0.2 μm PES/0.2 μm PVDF) membrane filters. The data suggest that the capacity ratio is most sensitive to the nature of the feed solution, as well as to the mode of operation. The capacity ratio is weakly or less sensitive to the magnitude of operating pressure or flux, as well as to the solution concentration. The capacity ratio varied from 1.8 for IgG solution to 0.7 for media (DMEM) supplemented with 11.3 g/L PP3. The dashed line shows that for most cases, capacity ratio relative to 47 mm disc was ≥0.8. The error bar for both disc and pleated filter shows variability observed among different runs.
For the whey solution, the data was produced by varying the pressure from 10 to 20 psid (for fixed 0.11 g/L whey concentration), varying the solution concentration from 0.02 to 0.22 g/L (for fixed pressure of 20 psid), varying the operating flux from 500 to 1000 LMH (at fixed 0.11g/L whey concentration), and varying the mode of filtration operation from constant pressure to constant flux (using fixed 0.11 g/L whey concentration). The results demonstrate that although filtration capacity is affected by the magnitude of pressure and solution concentration, the capacity ratio remained insensitive to both magnitude of pressure and solution concentration (β ∼0.80). Varying the magnitudes of operating flux from 500 to 1000 LMH (at fixed 0.11 g/L whey concentration) showed similar capacity ratios (β ∼1.00 within 10% variability). For a fixed solution concentration (0.11 g/L whey), the mode of filtration operation (constant pressure versus flow) has an impact on the capacity ratio, with a higher capacity ratio observed under constant flow than constant pressure operation.
For the IgG experiments similar trends were observed as made earlier with whey. The data shows that filtration capacity depended on the magnitude of the pressure, whereas the capacity ratio remained insensitive to the magnitude of the pressure (β ∼1.30). The mode of operation (constant pressure versus flow) demonstrated a significant influence on the capacity ratio (with β ∼1.80 under constant flow while β ∼1.30 under constant pressure).
Experiments with the pepsin solution were conducted under constant flux (250 to 800 LMH). The data demonstrated a drop in filtration capacity with increasing operating flux, in contrast to increases observed earlier with whey and IgG, whereas, once again, the capacity ratio remained unaffected (β ∼0.80 within 20% variability). A comparison of the capacity ratios for different feed solutions—whey and IgG, IgG and pepsin (for same mode of operation and operating pressure or flux)—shows that the capacity ratio is strongly dependent on the selection of the feed solution (for example, the capacity ratio is different for whey, IgG, and pepsin). In summary, for a fixed membrane and pleating configuration, following conclusions can be drawn:
The magnitude of operating pressure does not affect β.
The magnitude of operating flux does not affect β.
Varying solution concentration does not affect β.
The mode of filtration (pressure versus flux) affects β.
The nature of the feed solution affects β.
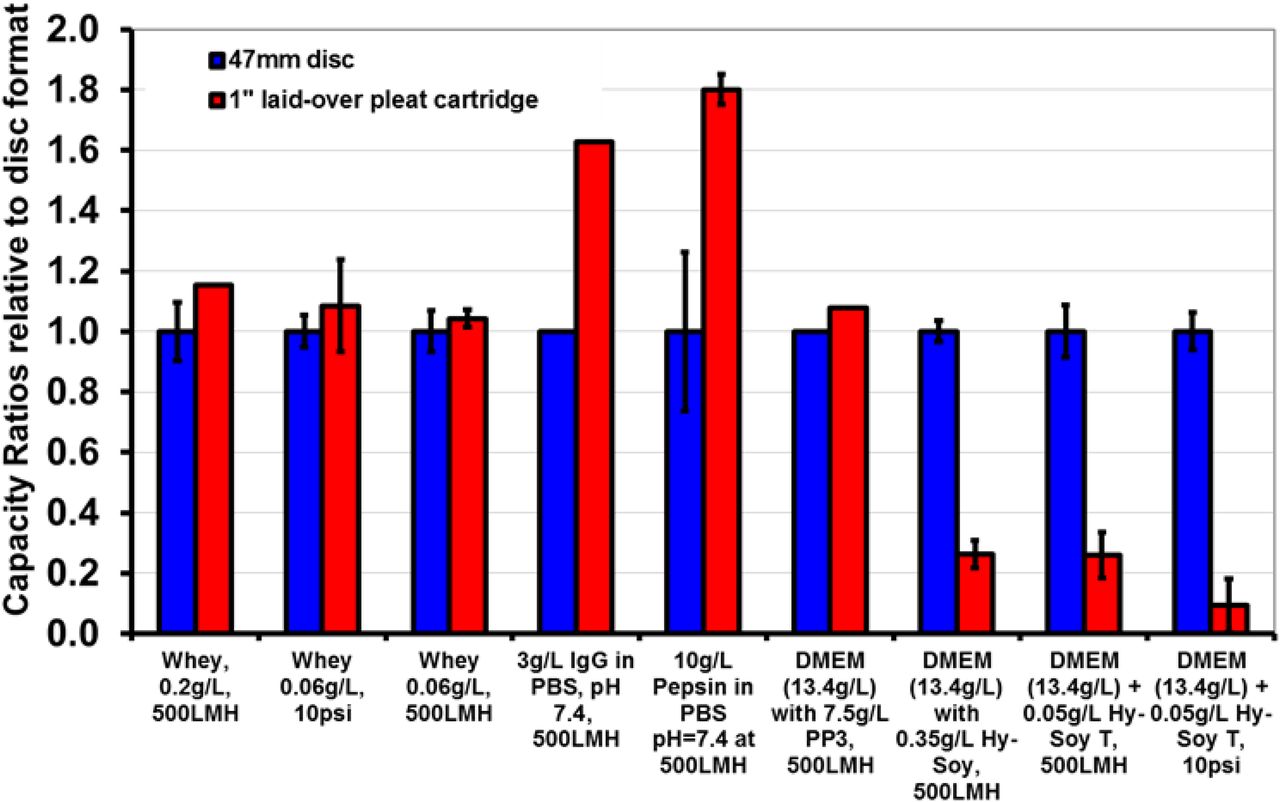
The results of the experiments performed with the 0.1 μm–rated filter are shown in Figure 6. Similar trends were observed as the trends with 0.2 μm–rated membrane experiments. For both whey and DMEM with Hy-Soy T solutions, varying the solution concentration had no impact on the capacity ratio. The capacity ratio was strongly dependent on the nature of the feed solution. IgG and pepsin demonstrated capacity ratios significantly greater than one; whey and DMEM with PP3 demonstrated capacity ratios close to one; and finally DMEM with Hy-Soy T demonstrated a capacity ratio much less than one. The selection of additives (PP3 or Hy-Soy T) in a DMEM solution had a very strong influence on the capacity ratio. The mode of filtration had a significant effect on the capacity ratio for DMEM with Hy-Soy T, similar to what was observed in Figure 5. However, the capacity ratio remained unchanged for whey as the mode of operation changed. This suggests that the impact of the mode of filtration depends on the nature of the solution.

Plot showing the capacity ratios for 0.1 μm–rated (0.2 μm PES/0.1 μm PVDF) membranes for various challenge solutions. For most challenge solutions tested, the capacity ratio lies between 1.1 and 1.8, whereas for media (DMEM) with Hy-Soy T soy peptone hydrolysate mixture, a lower capacity ratio is observed. The tests were performed with a 1 inch LOP cartridge. The error bar for both disc and pleated filter shows variability observed among different runs.
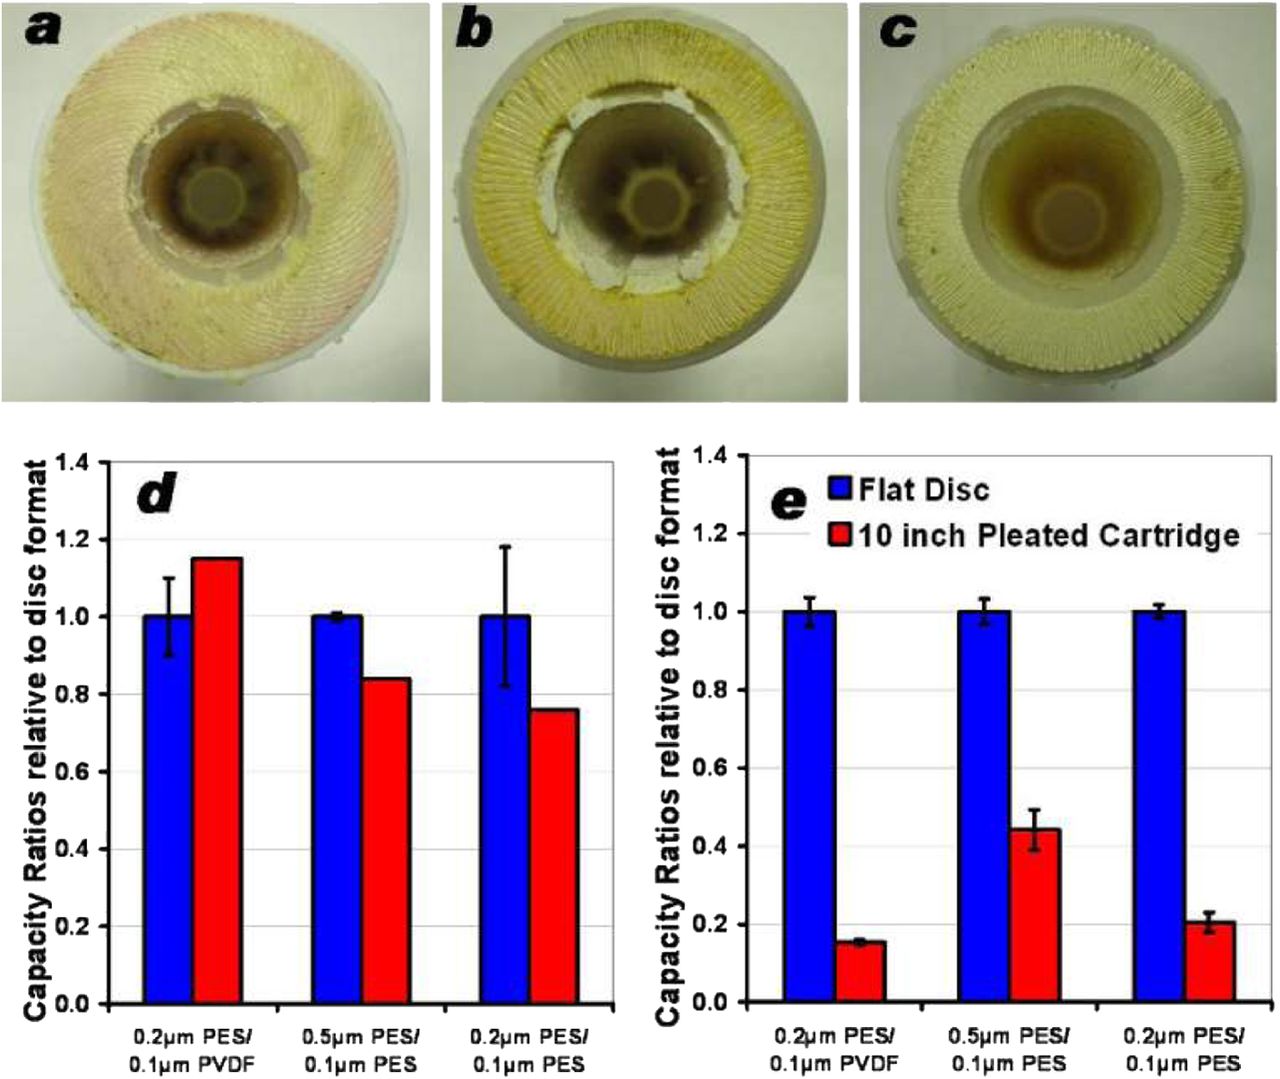
In addition, the effect of pleating configuration on β seems to be a function of the nature of the feed solution. For the three pleating configurations that were investigated during the study (Figure 7), the data in Figures 7d and 7e show that while LOP filters provide for a β ratio greater than 1 for whey solutions, they all show a β ratio smaller than 1 for DMEM with Hy- Soy T. All three pleated filter configurations show much smaller β ratios for DMEM with Hy-Soy T than with whey.

Cross-sectional images of three filters. Photograph in (a) show the cross-section of 0.1 μm–rated LOP 0.2 μm PES/0.1 μm PVDF membrane; (b) 0.5 μm PES/0.1 μm PES, and (c) 0.2 μm PES/0.1 μm PES shows the cross-sectional images of filters with fan pleat layout (Table I). Data in (d) shows that LOP filters provide for a β ratio greater than 1 for whey solutions, and (e) shows lower filter capacity ratios were observed for all three pleated filter cartridges while using culture media (DMEM) solution supplemented with Hy-Soy T soy peptone hydrolysate. The error bar for both disc and pleated filter shows variability observed among different runs.
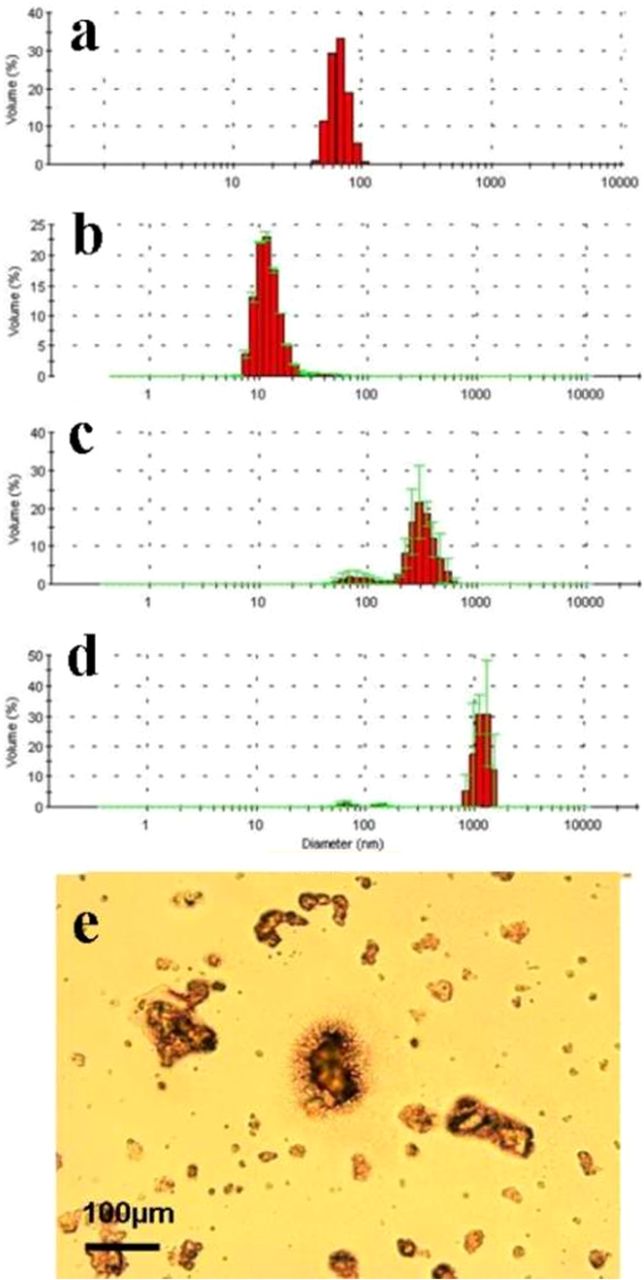
To clarify the impact of the feed solution, the particle size distribution of the three solutions (IgG, whey, and DMEM with Hy-Soy T) were characterized using DLS (measurement range up to 10 μm) and microscopic images. The results are presented in Figure 8. Data suggests a strong correlation between impurities/protein aggregate size (Figure 8) and the capacity ratio, β (Figures 6 and 7). For solutions with particle sizes smaller than the pore size of the membrane, β ratios are much larger than 1. For example, IgG solution demonstrates such ratios for both 0.1 μm and 0.2 μm membranes for both modes of operation. For solutions with particle sizes close to the pore size of the membrane, the β ratios are close to 1. For example, whey demonstrated such behavior for both 0.1 μm and 0.2 μm membranes. For solutions with particle sizes greater than the membrane pore sizes, the β ratios is much smaller than 1. For example, DMEM with Hy-Soy T demonstrate such behavior for three 0.1 μm–rated pleated filters. Figure 8 indeed shows that the larger particles in IgG feed are around 10 nm, in whey around 80 nm and 300 nm, while in DMEM with Hy-Soy T significant presence of particles >10 μm particles were detected.

Plot shows the particle size distributions for (a) 60 nm NIST polystyrene (PS) beads used as control, (b) IgG solution in phosphate-buffered saline (PBS); (c) whey in phosphate buffer; and (d) cell culture media (DMEM) solution supplemented with Hy-Soy T soy peptone hydrolysate. Due to a limitation in measuring particle sizes with DLS (up to 10 μm), a microscopic image in (e) shows the large contaminants in media (DMEM) with Hy-Soy T hydrolysate supplement. The measurement bar was determined using the control image using 10 μm PS particles.
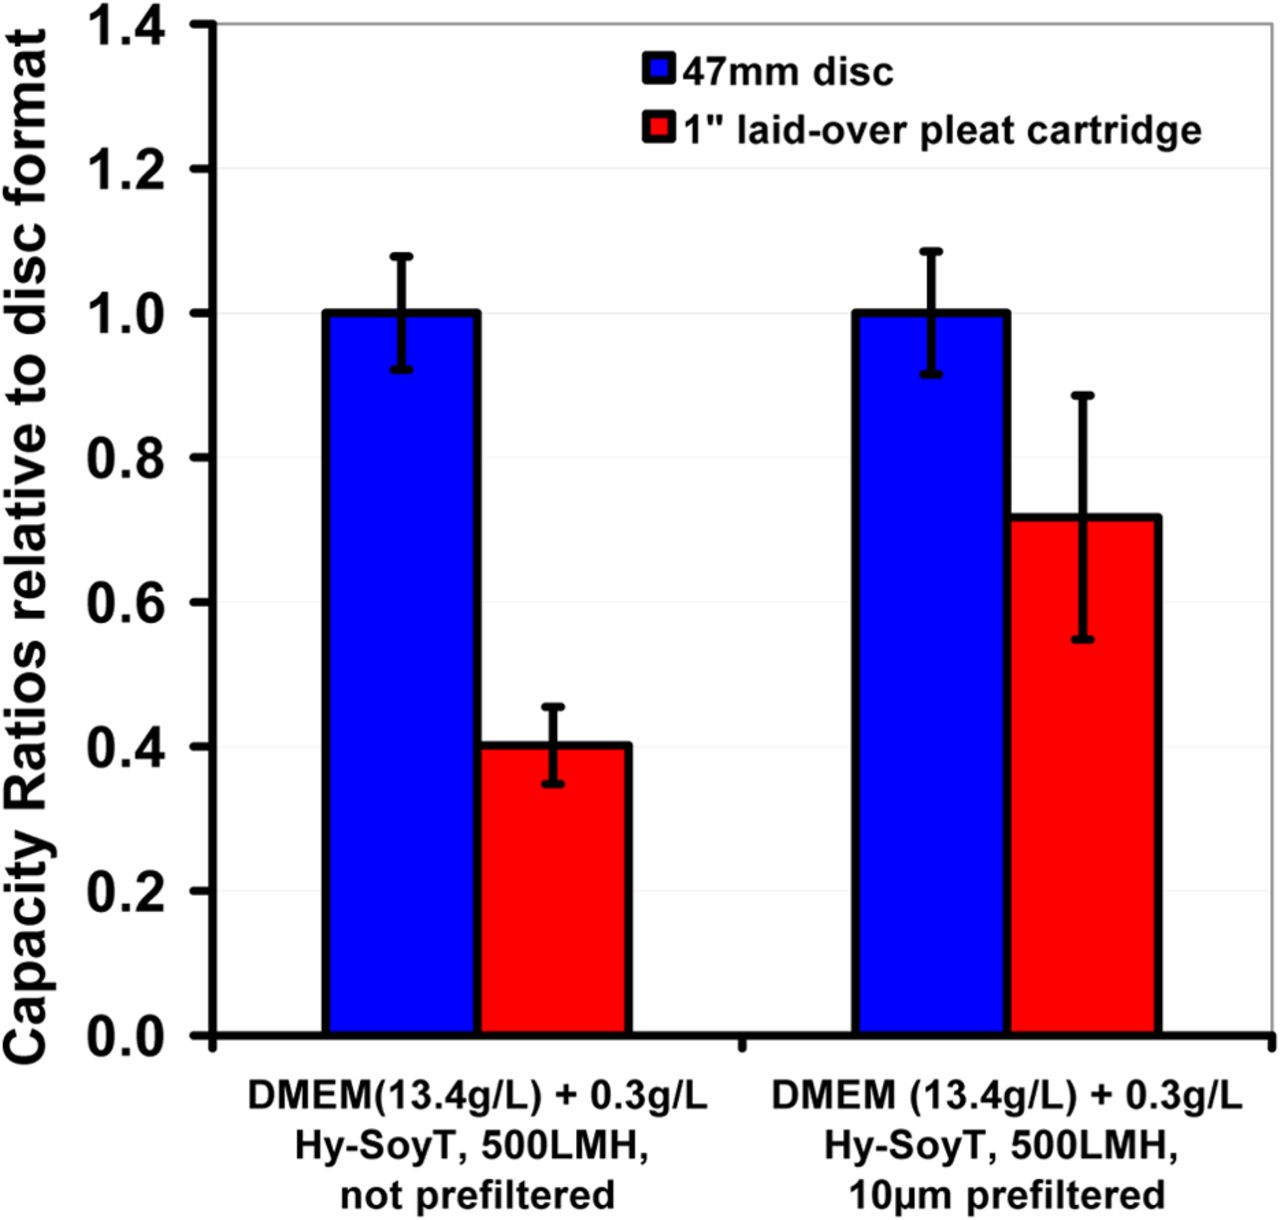
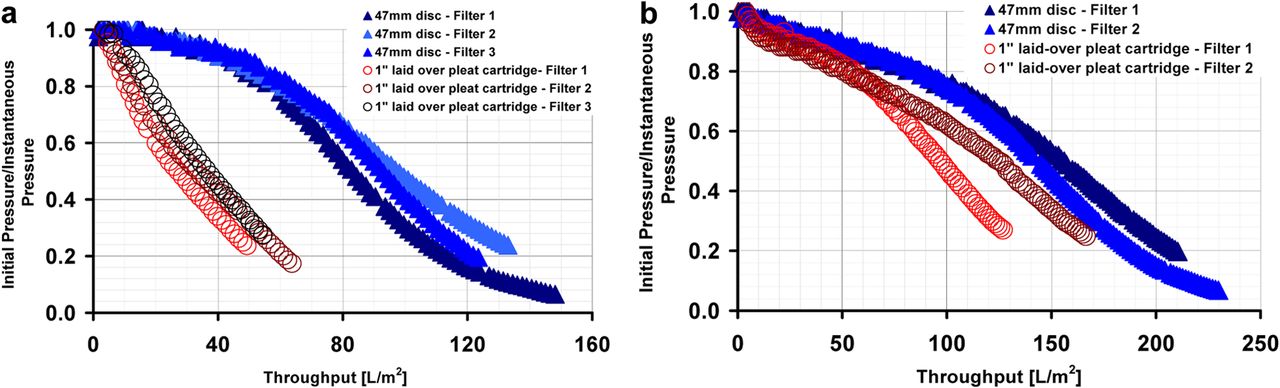
The effects of the larger particles in a solution could be in the blocking of the inter-pleat space, thus making it inaccessible for filtration or the formation of cake within the pleat structure. In both cases, this results in under-utilization of the membrane in pleated filters and in lower β. For such solutions, prefiltration could improve the performance of such filters. This indeed is observed in Figure 9, where an improvement in capacity ratio was observed after pre-filtration of DMEM with Hy-Soy T through a 10 μm–rated polypropylene depth filter. The presence of these large particulates in turn also influenced the membrane fouling characteristics (as observed by the differences in the shape of fouling curve in Figure 10).

Plot shows the effect of pre-filtration on capacity ratio for 0.2 μm PES/0.1 μm PVDF membrane. The data clearly suggest that removal of particulates significantly larger (10 μm or larger) than the membrane's micron rating lead to an improvement in the capacity ratio in pleated filters. The error bar for both disc and pleated filter shows variability observed among different runs.

A plot for inverse of filtration resistance across various filter formats: (a) un-pre-filtered feed, DMEM (13.4 g/L) supplemented with 0.3 g/L Hy-Soy T hydrolysate, and (b) shows results of using DMEM (13.4 g/L) supplemented with 0.3 g/L Hy-Soy T hydrolysate, pre-filtered through a 10 μm–rated filter. The fouling characteristic of a 1 inch LOP cartridge element, dictated by the shape of the curve, is similar to disc for a 10 μm pre-filtered feed. Also, an increase in throughput for pre-filtered feed indicates the presence of ≥10 μm size particles in the initial feed solution. Filtration was performed at 500 LMH operating flux using 0.2 μm PES/0.1 μm PVDF membrane.
In summary, the results show that
Membrane pleating configuration does not affect β.
The size of impurities/aggregates in the feed solution strongly affects β. When larger impurities in feed are
smaller than membrane pore rating, β > 1.
similar or slightly larger than membrane pore size, β ∼1 (within ±20% variation).
larger than membrane pore size, β < 1. In such cases implementation of prefiltration would help improve β.
3.2.2. Summary of Results:
We find that for most conditions, the capacity ratio is within ±20% that of unity, with some exceptions. With solutions containing significantly larger particles than membrane pore rating, a lower capacity ratio, β < 1, can be expected. For such solutions, implementing a suitable pre-filter help improve the capacity ratio. The observed lower β may have resulted from a combination of multiple mechanisms, which include (a) the formation of a cake within the pleat that creates an additional pressure drop, and (b) retention of larger particles blocking the pleat entrance. In both cases a portion of pleated membrane area is not effectively utilized. Also, we find that with some solutions (such as IgG solution, Figures 5 and 6) a significant improvement in capacity ratio, up to 40% to 80% higher, was observed with pleated membrane filters. The observed improved performance in pleated filters could result from a combination of multiple mechanisms, which include (a) pre-filtration of solutions through the drainage layer; (b) differences in the fluid flow distribution in pleated filters, which may provide for a higher shear rate along membrane surface; and (c) potential differences in localized differential pressures across membrane surface. Both the under-utilization and improved performance remain areas that requires further investigation.
3.3. Modified Standard Model for Sizing Filter
A standard blocking model, as presented in eq 3, is a common industry practice for estimating the membrane filtration area required, Ap (in units of square meters), to process a production batch volume of Vb (in units of liters) within a processing time, tprocess (in unit of hours) at manufacturing scale for processing a batch of fluid volume (5).
Two parts of equation 3 reduces to the limits of totally non-fouling and highly fouling feeds and allow for estimating membrane area requirement for a moderately fouling feed. Incorporating eqs 1 and 2 in standard blocking model (eq 3) yield a modified standard model (eq 4).
Ultimately, the scale-up data obtained in the laboratory is used in specifying the number of cartridges that will be used in manufacturing operation. For this purpose, eq 4 could be used to translate the data to the required number of pleated 10 inch cartridge elements (eq 5):
 where Nc is the number of 10 inch cartridge elements required to process the batch volume and A10″ is the membrane area per 10 inch cartridge elements. An example illustrating the number of 10 inch pleated cartridges elements required to process a batch for different scenario is presented in Table III. The data show that for cases where filtration is capacity controlled, flux ratios between pleated filter and disc are not critical. For such cases, the use of a large membrane area in an LOP cartridge construction allows for a reduction in the number of 10 inch pleated filter cartridges required to process the batch volume. For the specific comparison, the numbers of 10 inch cartridges are reduced by a factor of 2. From a practical point of view, this is advantageous as it allows for reduced space requirement for filter inventory, a smaller floor area for the filter housing footprint, and a much easier process operationally. The use of fewer cartridges helps reduce the processing cost further by (a) reduced capital cost (smaller filter housing), (b) reduced cost associated with smaller quantities of water for injection for sterilize-in-place and clean-in-place operations, and (c) reduced filter disposal costs (24). The filter sizing for non-fouling solutions could be obtained by using the flux part of eq 5.
Example Illustrating the Number of 10 Inch Cartridge Elements Required To Process a 20,000 L Batch in 4 h
4. Summary and Conclusions
It was shown that the flux (flow rate per unit membrane area) for pleated membrane filters is lower than for the same membrane in a flat disc format, with flux ratios ranging from 0.50 to 0.85. The lower flux ratios observed in pleated membrane filter cartridges are due to additional pressure drop associated with lateral flow hydraulic resistance between pleats introduced by the support and drainage layers and pleat density (compression) and not due to limited accessibility of the fluid to membrane surface, as hypothesized earlier.
The filter capacity ratio was found to be a strong function of the nature of challenge solution, more specifically suspended particle sizes, and the mode of filtration operation. However, the filter capacity ratio remained less sensitive to the magnitude of the operating condition (pressure or flux), to the concentration of fouling species in a protein or cell culture media solution, and to membrane pleating configurations. For solutions with particle sizes smaller than the pore size of the membrane, capacity ratios were much larger than 1. For example, IgG solution demonstrates such ratios for both 0.1 μm and 0.2 μm membranes for both modes of operation. For solutions with particle sizes close to the pore size of the membrane, the capacity ratios were close to 1. For example, whey demonstrated such behavior for both 0.1 μm and 0.2 μm membranes. For solutions with particle sizes greater than the membrane pore sizes, the capacity ratios were much smaller than 1. For example, DMEM with Hy-Soy T demonstrate such behavior for three 0.1 μm–rated pleated filters. In general, a feed solution with the presence of significantly large suspended particles influenced the capacity ratios of all pleated filters (irrespective of their pleating geometry). For such solutions, implementation of a pre-filtration step not only brings the capacity ratios between membrane disc and pleated filter formats close to 1 but also leads to an increase in the overall throughput performance of the two filter formats. For most conditions, the variation in capacity ratio among pleated membrane cartridges and discs was within ±20%.
We presented a modified standard membrane fouling model that allows for incorporating the flux and the capacity ratios to calculate the membrane area and subsequently the number of 10 inch pleated cartridge elements required to process a production batch based on 47mm membrane disc filterability study data. The data show that for cases where filtration is capacity-controlled, flux ratios between pleated filter and disc are not critical. For such cases, the use of a large membrane area in LOP cartridge construction allows for a reduction in the number of 10 inch pleated filter cartridges required to process the batch volume.
Conflict of Interest Declaration
The authors declare that they have no competing interests.
Acknowledgements
The authors would like to express thank to Manuel Azcarate (Pall Life Sciences, Saint Germain, France), and Tom Watson, Nigel Jackson, Tony Orchard, and Richard G. Gutman (Pall Life Sciences, Portsmouth, UK) for reviewing earlier versions of the manuscript and providing useful suggestions.
- © PDA, Inc. 2015


