
Abstract
Flow cytometry is a complex measurement characterization technique, utilized within the manufacture, measurement, and release of cell and gene therapy products for rapid, high-content, and multiplexed discriminatory cell analysis. A number of factors influence the variability in the measurement reported including, but not limited to, biological variation, reagent variation, laser and optical configurations, and data analysis methods. This research focused on understanding the contribution of manual operator variability within the data analysis phase. Thirty-eight participants completed a questionnaire, providing information about experience and motivational factors, before completing a simple gating study. The results were analyzed using gauge repeatability and reproducibility techniques to quantify participant uncertainty. The various stages of the gating sequence were combined through summation in quadrature and expanded to give each participant a representative uncertainty value. Of the participants surveyed, 85% preferred manual gating to automated data analysis, with the primary reasons being legacy (“it’s always been done that way”) and accuracy, not in the metrological sense but in the clear definition of the correct target population. The median expanded uncertainty was calculated as 3.6% for the population studied, with no significant difference among more or less experienced users. Operator subjectivity can be quantified to include within measurement uncertainty budgets, required for various standards and qualifications. An emphasis on biomanufacturing measurement terminology is needed to help understand future and potential solutions, possibly looking at translational clinical models to engage and enhance better training and protocols within industrial and research settings.
1. Introduction
Cell and gene therapy (CGT) regenerative medicine products are showing demonstrable success in a clinical setting, with significant effort now going into the mechanisms for scale up for both centralized or distributed manufacture (1⇓–3). Although in this context much emphasis has been placed on potential development of bioprocessing platforms, a key concern that has not been considered in detail is the extent of variation in the starting materials and the causes and solutions to these variations in the context of requirements for biomanufacturing process control.
Recent work using hematopoietic stem cells therapy (HSCT) as an exemplar identified that the variation of the prescribed cell dose per kilogram of patient body weight could be up to six orders of magnitude (4, 5); this was supported by a single clinical center analysis that showed refinement to approximately three orders of magnitude (6). A key control element identified during the process development was the variation of biometrology techniques and operator influence on the starting material variation. Flow cytometry (FC) along with other biological assay platforms is becoming more utilized within CGT manufacture and quality control (QC). This is because of the increased number of antigen markers that can be used in a single analysis panel, efforts toward high-throughput analysis, and improved standardization (7).
It has been well documented that between-instrument, -laboratory, and -reagent variations exist, factors difficult to standardize because of the lack of appropriate calibration standards for cellular biological measurement. Efforts have been made through various consortia to remove variability from analysis using standardized reagents, setup protocols, and analysis, so that any remaining variation can be attributed to the donor (8⇓–10). Equally, various proficiency testing schemes exist to monitor and improve the inter- and intralaboratory variation in clinical FC. The most notable are the UK NEQAS schemes for immune monitoring and CD34+ stem cell enumeration in accordance with the International Society of Hematotherapy and Graft Engineering (ISHAGE) protocol (11⇓⇓–14). Distributed stabilized blood samples help monitor comparable performance of clinical laboratories and highlight improvements where necessary.
The variability present in measurement platforms responsible for counting and identifying CGT products needs to be quantified, to demonstrate in process control in accordance with ICH Q7 (Section 8.30 for in process sampling and controls) guidelines for Good Manufacturing Practice (GMP) (15). The measurement uncertainty is needed to quantify the variability of the product (and contributing factors from manufacture) according to ISO 15189 validation of medical measurement laboratories (16). It is also stated that any measurements derived through interpretation require sign-off by the relevant operator, providing traceability to the measurement decision.
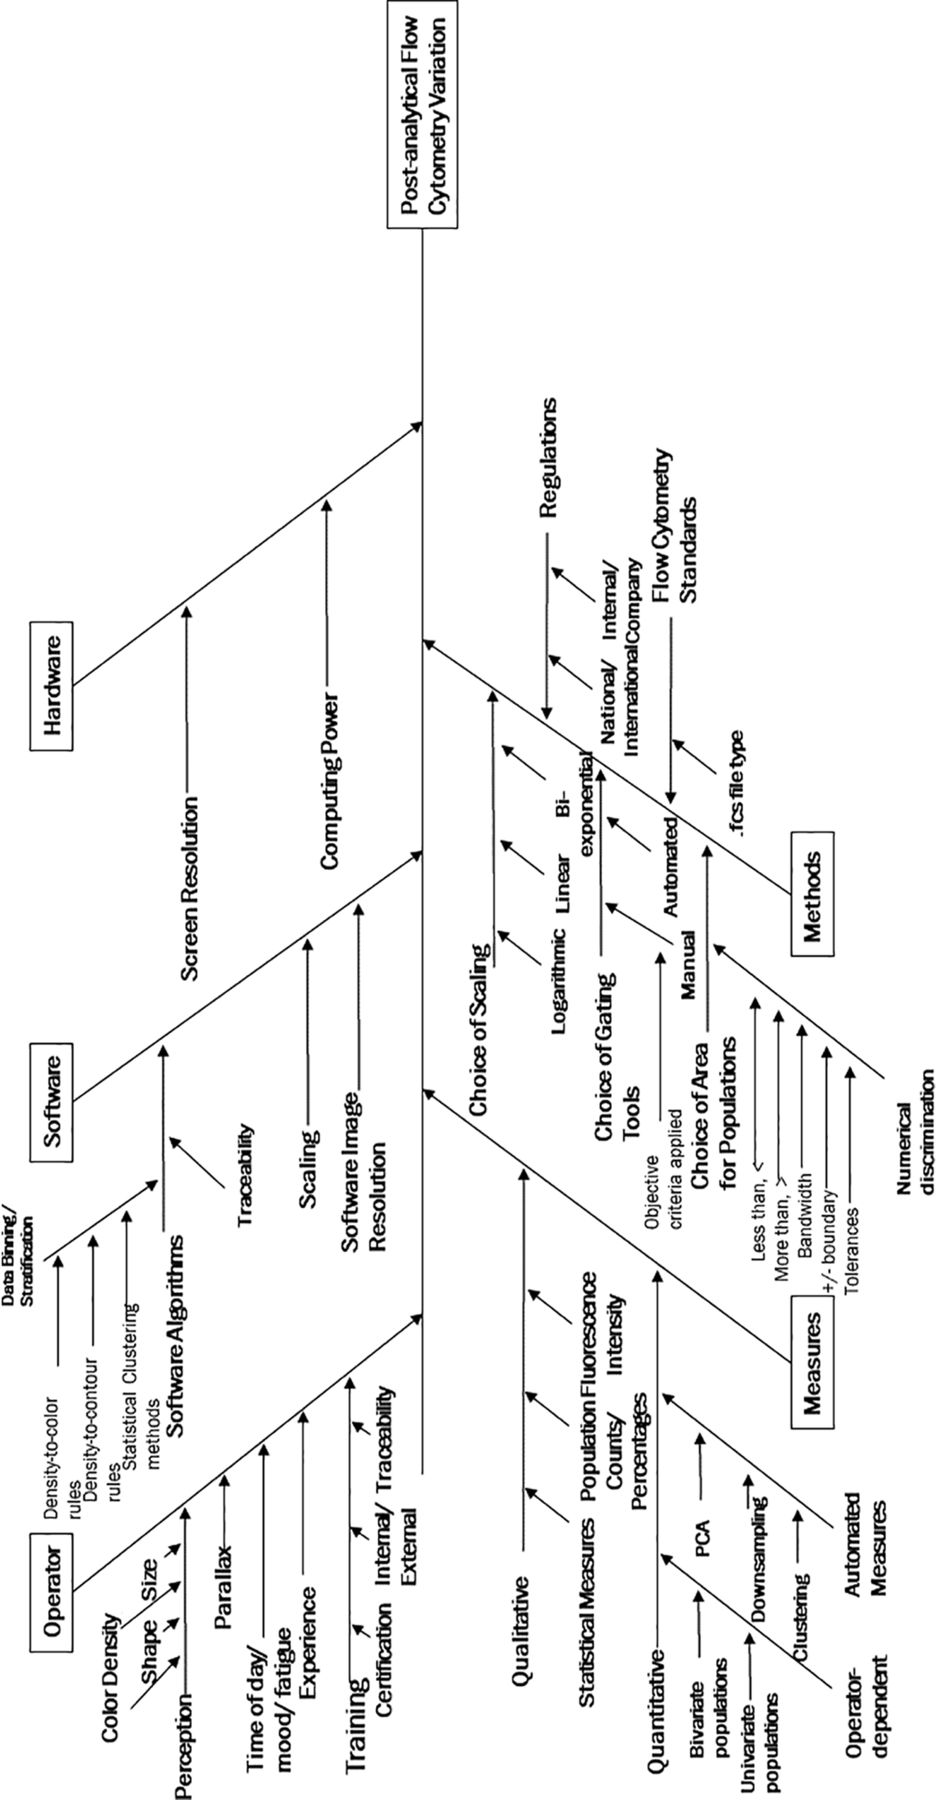
The Ishikawa diagram (also known as a cause-and-effect diagram) shown in Figure 1 documents the potential sources of variability that could affect the final results determined through FC manual gating (17). This is not an exhaustive list but aims to demonstrate the different ways that visualization and interpretation of the data can cause variances, classified as “operator subjectivity”. Even in the data processing software environment alone there are many variables that can be altered by the operator to improve the visualization of plots and then to manually draw gates around the cell populations in question. For more information on the data structure and file type used, please refer to Section 2.2.

Ishikawa diagram listing multiple sources of uncertainty (17). This lists the contributing sources of variation impacting postanalytical flow cytometry variation.
More recently, many efforts have been made to automate the analysis of FC data, recognizing the variation in manual gating and the high dimensionality of the data acquired by multiparameter FC and mass cytometry (18⇓⇓⇓–22). Most efforts have been based on publicly available datasets, with little mention of validation and decision-making within the clinical and manufacturing settings. In some cases, this is faster but ideally requires the user to understand the statistical principles (and machine learning) behind the automation in question; this requires additional understanding of the variables that can be manipulated to generate a set of results. Differences in these automation algorithms produce different results for samples, which have been shown in a series of FlowCAP challenges aiming to identify whether automated algorithms can correctly identify mammalian populations and classify samples (23, 24). These need to be validated against manual methods for correct population identification and precision. However, all machine learning methods may contribute to measurement uncertainty, so it would be important to rigorously test these to understand the output if they are used within a biomanufacturing process control schema.
The research reported here focuses on quantifying variation from participants who are manually gating FC data sets, to provide guidance on the output distribution, as well as defining a representative uncertainty. Measurement uncertainty has been investigated in this article as a complimentary alternative to the standard reporting of coefficient of variation (CV). CV is a useful indicator of final measurement variability; however, it does not break down the measurement variation to identify key contributing components. Measurement uncertainty takes a bottom-up approach, allowing for suitable totals to be calculated for overall variation, supported by data to quickly identify the biggest contributing sources of variability. Within this work, “operators” is used to describe general principles within this article, and “participants” is used whenever a reference to the experimental subjects is made.
The methodology used was based upon gauge repeatability and reproducibility (GRR) techniques, originating from automotive manufacturing Q) and Six Sigma tools, to quantify variation attributed by system or longitudinal components (25). “GRR is the variance equal to the sum of within-system and between-system variances” and is used to combined variance from intra- and interoperator measurements in this instance (25). The application of GRR can then be used to directly inform the requirement for new strategies for biomanufacturing process design and control and range specifications for new products. GRR was used to ensure variability could be fairly quantified through the use of a standard measurand or data set, randomized among other representative data to ensure unbiased analysis from participants. Use of GRR methods and measurement uncertainty to quantify operator variability can have a significant impact on the manufacturing and measurement of CGTs to reduce the inherent variability within quantification and qualification. Better measurement stratification passes on quality to the product and improves patient recovery.
2. Materials and Methods
This section contains information on methodology for creating the files which were analysed by participants, survey construction, participant study methodology and data analysis for measurement uncertainty.
2.1. Cell Selection and Culture
The embryonal carcinoma (EC) 2102Ep immortalized cell line has been suggested as a “ruler line” or “reference standard” for culture and research, because it has an antigen expression profile similar to conventional human embryonic stem cells (hESC) (26). This antigen expression profile was unchanging over 10 passages, and this biological stability makes the cells a good example for quantifying downstream experimental uncertainty because of minimal biological variation (26).
A vial of GlobalStem EC 2102Ep cells (Passage 48) (5 × 10⁶ cells) was removed from a liquid nitrogen cryobank and thawed in a water bath for 3 min until only a visually detectable amount of frozen material remained. The material was mixed in a 1:1 ratio with cell culture media, mixed slowly and seeded onto a T75 ThermoScientific Nunc cell culture flask in 15 mL Gibco Dulbecco's Modified Eagle Medium (DMEM), high glucose, GlutaMAX supplement (Cat 61,965, Lot 1813,259), fortified with 10% v/v fetal bovine serum (FBS). Medium exchange was carried out every 2 days until confluency before passage into two daughter T75 flasks at a seeding density of 6.7 × 10⁴ cells/cm2.
To avoid clumping and to aid dispersion, a 2-step disassociation process was used; cells were trypsinized with 1.5 mL Gibco Trypsin EDTA (0.25%) (Cat 25200,072, Lot 1814,171) for 5 min in an incubator at 37°C with 5% CO2 and quenched with 3 mL of the fortified DMEM to stop the enzyme. Cells were centrifuged at 300 g for 5 min, the waste supernatant was aspirated, and the remaining cell pellet resuspended in 1.5 mL 0.25% Trypsin EDTA and incubated for a further 5 min. After further quenching and removal of the supernatant, the cells were resuspended in the fortified DMEM, with cell counts and viability assessed using a Nucleo-Counter NC-3000 and Via1-Cassettes to stain and measure cells with acridine orange and DAPI dyes. Three repeat measures were taken at each count to obtain a mean cell count and viability before reseeding into the next passage. Cells were passaged through five successions, with an average cell viability of 87% ± 3% over the culture period.
2.2. Flow Cytometry Standard File Generation
A series of Flow Cytometry Standard (FCS) files were generated using the EC 2102Ep cell line in culture through five passages and harvested as previously described. The cells were fixed, permeabilized, and stained using the BD Stemflow Human/Mouse Pluripotent Stem Cell Analysis Kit (Cat 560,477, Lot 7004,890), according to the included method (27). Enough cells were harvested to generate the respective isotype and fluorescence minus one (FMO) controls alongside the stained cells. A total of 1 × 10⁷ cells were harvested and fixed in 1 mL 4% BD Cytofix Fixation Buffer (Cat 51-9006,276, Lot 7004,890), incubated in the dark for 20 min, and washed twice with 1 mL phosphate buffered saline (PBS). The cells were mixed slowly with 1 mL BD Permeablization/Wash (Perm/Wash) Buffer (Cat 51-9006,275, Lot 6232,552) and incubated at room temperature in the dark for 10 min.
After two washes, the cells were split into Eppendorf vials (1 × 10⁶ cells each), suspended in 100 µL Perm/Wash buffer, and stained with the respective dyes: 15 µL Beckton Dickinson (BD) Pharmingen PerCp-Cy5.5 Mouse Anti-Oct 3/4 (Cat 51-9006,267, Lot 6232,550), a stem cell transcription factor marker, 10 µL BD Pharmingen Alexa Fluor 647 Mouse Anti-SSEA-4 (Cat 51-9006,265, Lot 6316,682), an external antigen marker for pluripotency, and 20 µL BD Pharmingen Mouse PE Anti-SSEA-1 (Cat 51-9006,268, Lot 6316,683), an external marker expressed by cell differentiation.
Once incubated for 30 min in the dark, cells were washed twice and transferred into BD Falcon Round Bottom 12 mm ×75 mm tubes (Cat 352,063) and kept covered. Cells were run through a BD FACSCanto II flow cytometer. To reduce the variability of the results, the data were acquired at the same time to avoid variation over time, and the application settings were kept the same on the flow cytometer. This included optical channel voltages to ensure the data were unaffected by additional noise because of amplified signals or poor detection. Daily calibration was successfully completed using Cytometer Setup & Tracking beads (Lot 74,538) (28). These beads were used for instrumental QC of the optics, electronics, and fluidics and to adjust the fluorescence compensation. A viability stain was not included in the FC panel because of viability being assessed with cell counts and the need to keep the gating panel initially straightforward for participants, following the prescribed method within the Analysis Kit (27).
Each tube and respective FCS file were generated using a medium flow rate and by acquiring 30,000 cellular events. Multiple stained sample FCS files were generated to build a library of repeats to use within the variation studies. These were representative of the product samples described in the manufacturing scenario used to describe Figure 2. Files were exported as FCS 3.0 version types for use in FlowJo Version 10.0.8r1 third party analysis software (29) and saved as a workspace.

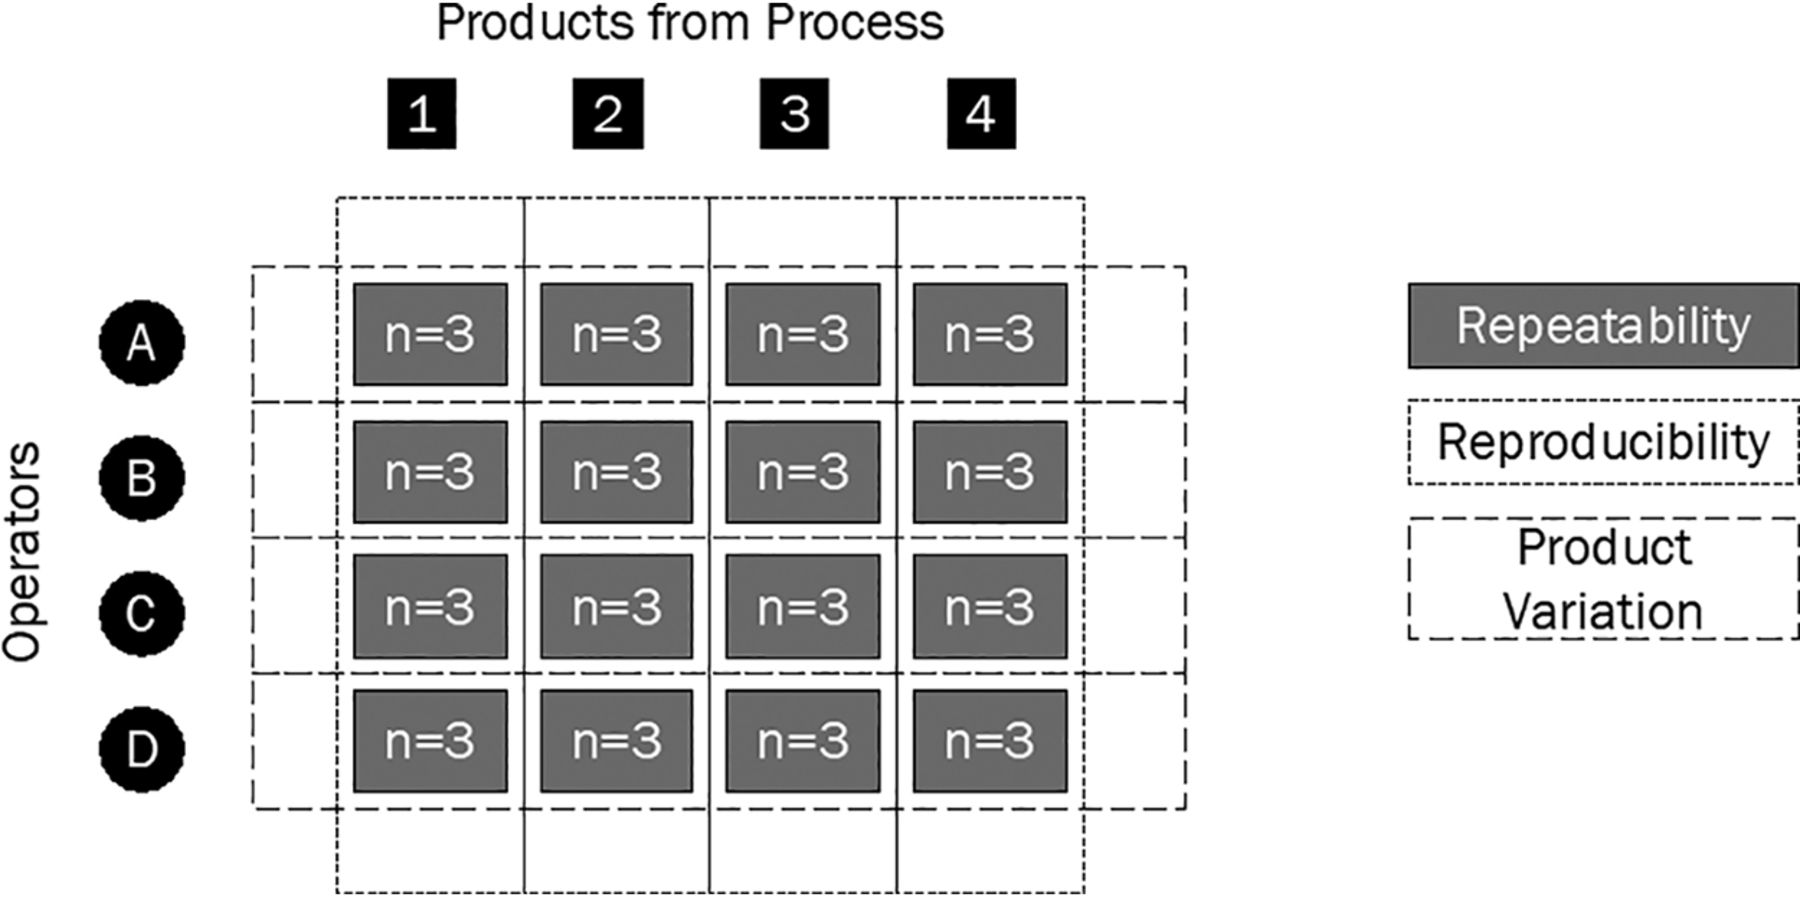
Gauge repeatability and reproducibility diagram to calculate the variability difference between different manufacturing sources; repeatability of measures, between-operator and between-product variation.
To quantify repeatability, the participants were asked to measure samples from a process n times in a random order, to calculate a (two sigma) standard deviation (SD) to represent variability. This gave a snapshot understanding of participant repeatability on that one product, shown in Figure 2 by the gray boxes joining each participant to each sample to be measured. These calculated SDs could be compared against other participants to understand the reproducibility of measurement of a specific sample (short dashed lines). The SDs could also be used to compare product variation from the process, by monitoring these against the other process sample product SDs (large dashed lines). Please note, Figure 2 is representative of the GRR study design and does not depict the total number of participants in this study.
2.3. Initial Questionnaire Design
Ethical approval was obtained from the Loughborough University Ethics Approvals (Human Participants) Sub-Committee for the study, and all participants were informed of the intentions of the study. Before the gating study commenced, the participants completed an online questionnaire to identify differences among participants and understand their experience background. The questionnaire was used to identify key problems the participants have when applying gates and interpreting data from the literature. The participants were asked questions according to the following structure:
personal qualifications,
FC experience and usage,
vision, and
motivational factors.
All participants and their respective data were anonymized at the point of data collection, and the data were stored in accordance with the ethical clearance obtained. All data analysis relating to the questionnaire or gating results was completed anonymously, and participant coding was restructured from previous work to remove the possibility of analysis bias (17). Any questions requiring written text answers were analyzed and qualitatively coded based upon prescribed manual coding methods (30). These codes were counted to measure the frequency of issues reported.
2.4. Flow Cytometry Study Organization
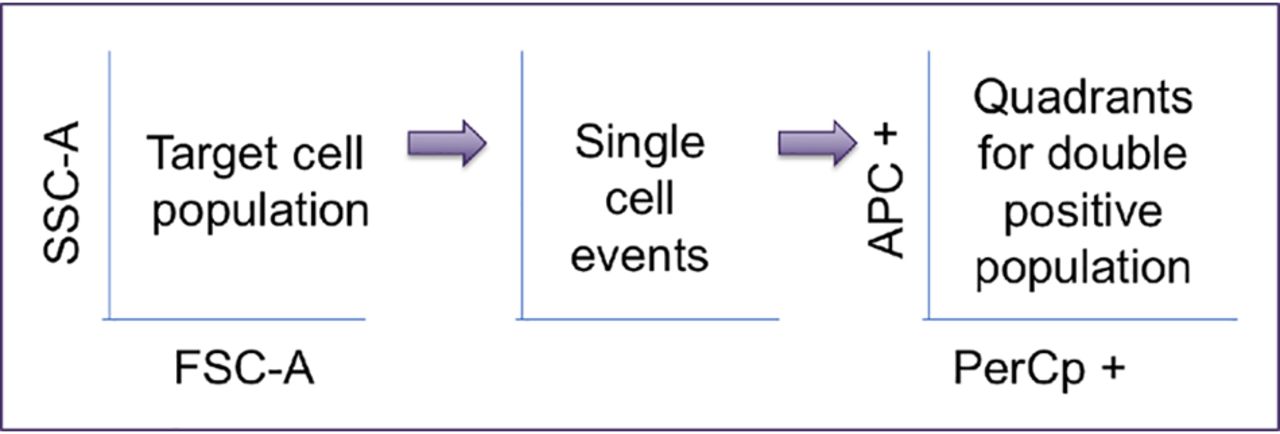
Participants from three separate centers were individually invited to complete the study in a quiet analysis space. Study sessions were 1-hour maximum duration, and participants were shown three FlowJo workspaces that contained a series of fully stained EC 2102Ep FCS files. One identical file was included in each workspace, and the participants were instructed to gate through a three-plot sequence to identify target cells (using Forward Scatter [FSC-A] plot against Side Scatter [SSC-A]), then the option to gate single cells, and finally to apply a quadrant gate to the double positive stem cell marker population to identify the final percentage cell count of respective pluripotent stem cells. An overall schematic of the gating sequence they were asked to follow is shown in Figure 3.

Gating sequence for operators.
The participants were also provided with isotype controls and FMO controls in each workspace to aid gate application and were allowed to use the FlowJo manual gating tools most appropriate to the cell population in hand. Because of the variety of ways in which people gate single cells, these axes were left to the discretion of the participant and their preference. The participants gated each workspace of files separately to ensure a correct quantification of uncertainty through SD calculation in accordance with the GRR methodology principles described earlier.
2.5. Uncertainty Calculation
Once the studies had been completed, the target cell, single cell, and final percentage positive cell population metrics were extracted from the data, using the results from the identical repeated file situated in each workspace. These were then used to calculate a mean number of cellular events recorded, SD, and CV for each gating stage, per participant. Finally, a combined uncertainty (uc) was calculated by combining the individual gate SDs (Type A uncertainties) by summation in quadrature, following the Guide to Uncertainty in Measurement (GUM) principles (31), as shown in eq 1. This combined uncertainty value can be used when calculating larger FC uncertainty budgets. The uc value was expanded with a coverage factor of k = 2 (two sigma), representing a 95% confidence interval for the uncertainty statement, which gave each participant a representative expanded uncertainty (U) figure, shown in eq 2.
 (1)
(1)
 (2)
(2)
3. Discussion
This section covers responses from the initial questionnaire completed by participants, measurementdata from the gating study itself and then a comparison of qualitative and quantitative metrics respectively.
3.1. Questionnaire Results
Thirty-eight participants were split across three separate centers; an academic research facility, a commercial CGT process development group, and the LGC Group. An additional five participants from across the centers took part in the questionnaire; however, they did not take part in the gating study. Their questionnaire results were included to identify information such as popularity of techniques, for example, but these participants were removed if any statistical analysis with gating results was conducted in order not to not skew the results. The questionnaire survey had specific focus on the use of FC for cellular measurement but has wide applicability to other forms of biological and small particle measurement assays.
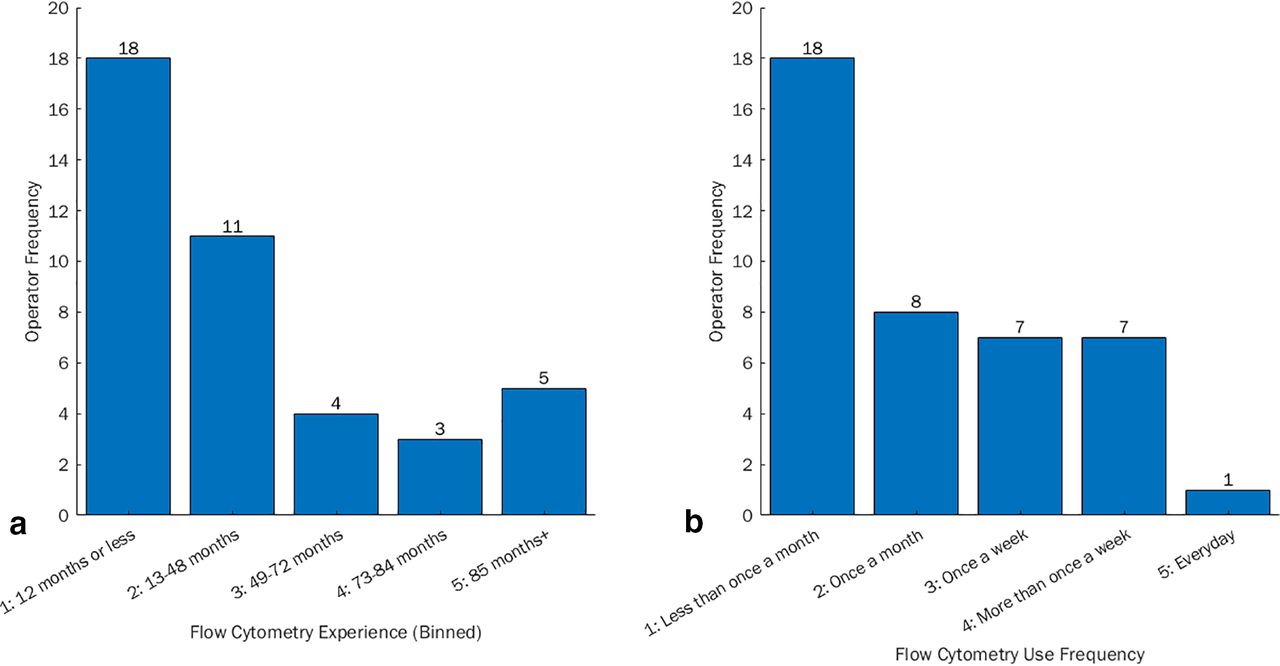
Participants gave an indication of their experience, which was binned into five categories based on how long they had been using the technique. This frequency chart can be seen in Figure 4a, with the majority of participants having <12 months experience with FC. Participants also indicated how frequently they used FC, with the ordinal choices and respective response frequencies shown in Figure 4b. The majority of participants used a flow cytometer less than once a month, but this also encompassed those who were awaiting training.

(a) Frequency of participant experience with flow cytometry (how long they have used the technique) and (b) frequency of participant use of flow cytometry (how often they use the technique).
Overall, 56% of survey participants were trained internally (industry or academic setting). This often took the form of supervisor or peer-to-peer on-the-job learning. Twenty-one percent had received external training in the form of basic use courses that involved instrumental setup and analysis. The remaining participants were awaiting formal or informal training at the time of the survey, and other participants were self-taught from literature/online videos.
None of the participants had official certification status for FC (e.g., Specialist in Cytometry, SCYM); however, this qualification is primarily an American qualification so it was unlikely that the UK participants questioned would hold this. UK Biomedical Scientists can gain Health and Care Professionals Council (HCPC) accreditation to identify high quality within laboratory training and conduct to protect patient safety. Some participants did respond “Yes” when asked about qualifications, but the certificates listed were for manufacturer-specific training courses and were not equivalent to the full SCYM accreditation. The UK Institute of Biomedical Science (IBMS) also offers Certification in Expert Practice for Flow Cytometry and Medical Microbiology (32). Sixty-two percent of participants had previous experience using FlowJo software, with a range in expanded uncertainty results between participants of 8%. Those with no experience had a wider range of uncertainty between participants at 12%. This indicates that familiarity with the software could possibly reduce the variability between the participants; however, this was not significantly different. All personnel were required to undertake formal training for relevant tasks according to GMP guidelines and to review this training regularly with periodic assessment alongside formal documentation of training records (15).
It remains to be determined whether certification is something that is required for those working in QC for CGT products, and possibly for process development. The IBMS certification also requires successful qualification holders to take part in the Credential Maintenance Program (CMP) every three years—to ensure a high quality of practice and relevant understanding (33). Currently, training is only offered at the start of industrial practice; however, a consideration should be made for internal measurement of staff proficiency over time to correlate with best practice.
The initial results from the nominal dichotomous questions and the response numbers of the participants can be seen in Table I. Sixty-three percent of the participants stated that they did not use a protocol to apply gates to FC data. The remainder (37%) of the participants who did were based in an industrial setting where this would be integrated into a standard operating procedure (SOP). More bespoke analytical and research assays will not generally have individual protocols generated because it was reported as taking too much time; however, the overall protocol structure should be heeded in FC training for new users. Method robustness and validation is required when all new protocols are developed to highlight where the method can cause disparity between operators because of misinterpretation. This can highlight different training issues needed but also opportunities for uniformity of analysis.
Dichotomous Responses to Questionnaire Enquiries for Personal, Experience, Vision and Motivational Factors
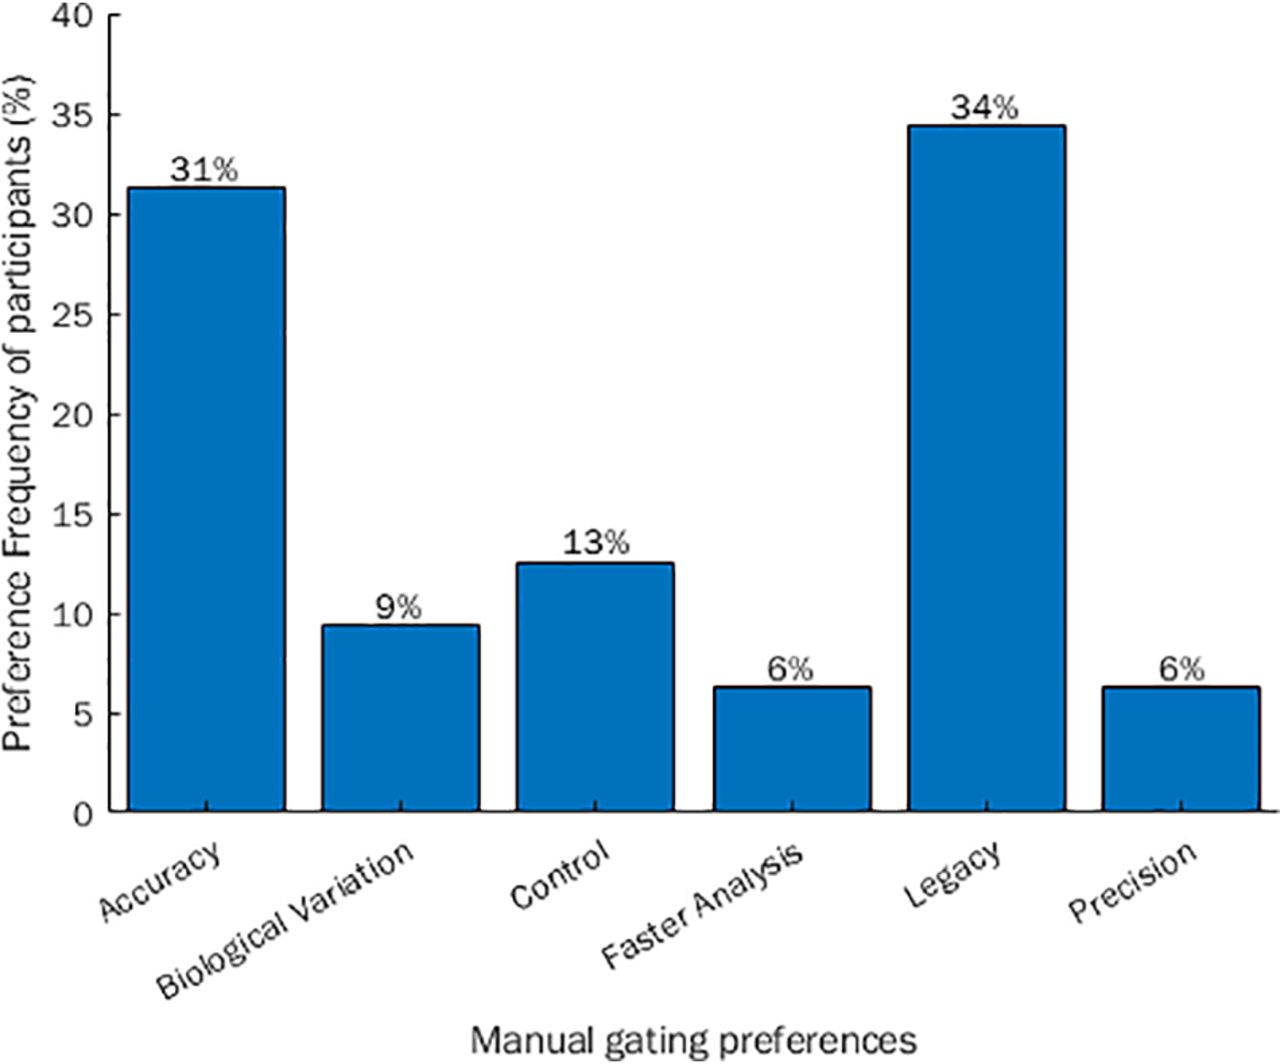
With respect to gating preferences, 85% preferred manual gating to automated gating, with the respective reason codes along with the response frequencies shown in Figure 5. The top three contributors were directly related to influential human and training factors (legacy, accuracy, and control). The primary reason for manual preference was legacy, whereby participants preferred manual gating because this is what had always been used, or for new users, this was their initial perception from shadowing others and observations in literature.

Response frequency and stratification of why participants prefer manual gating to automated gating.
Besides legacy, most felt that manual gating was more suitable for applying “accurate” gates. In this context, accuracy referred to correct identification of the target population in relation to its distance and ease of discrimination from near and neighboring clusters. It should be duly noted that FC is developing as a metrologically accurate technique because of the improvement of reference standards for comparison to a true value using calibrator particles and systems such as equivalent number of reference fluorophore (ERF) units for traceability (7, 34). Manual gating also gave participants more control over the analysis and the participants felt that it was better when dealing with biological donor variation, and that this method was more repeatable and quicker at obtaining an answer, relative to assay dimensionality.
It appeared that the participant protocol was subjective from the point of initial training. There also appeared to be a lexicon issue with participant’s perception of automation. Some participants believed that this was in relation to autotools used within the manual space, which can be used to highlight a specific population, computed as a density bound that an operator has to hover over with a mouse and select. The meaning of “automated gating” in this experimental context was if machine learning or automated intelligence was applied to identify cellular subpopulations or targets, which is often used when the data is highly dimensional. There are a large number of open methods available for computation, and the participant skepticism appeared to come from a lack of understanding with regard to what these methods do to the data. As an operator, it should be very important to understand how it works to obtain the results and the precision of the method. Automation was also not preferred because the operators did not like the distance it put between themselves and the raw data, losing control to understand the sample and draw conclusions.
None of the participants were aware of any visual impairment that could affect their judgment of the gating plots. This was asked because it has been shown in other medical analyses such as magnetic resonance imaging (MRI) scans (35, 36) that color perception can affect interpretation on plots shown on a pseudocolor gradient, depending on the analyst.
3.2. Uncertainty Study Results
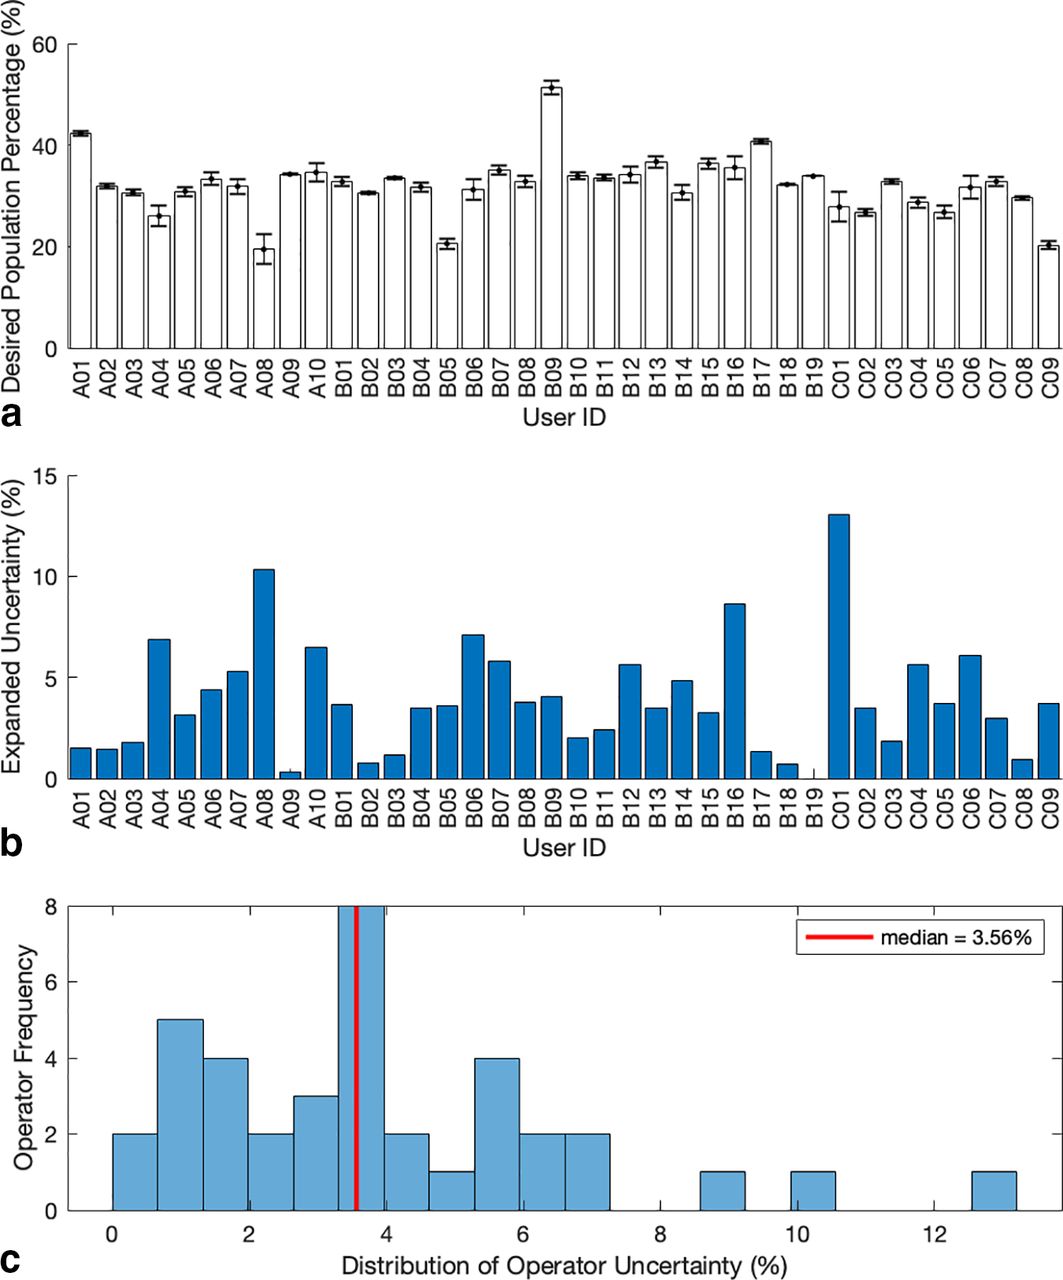
The mean of three repeat measures taken from each participant was used to represent their final single cell, double positive expressing cell count percentage for the FCS file in question. These mean values can be seen in Figure 6a, against each anonymized participant, across three separate centers, coded A, B, and C, respectively. Error bars have also been identified for these results, which represent ± 1 SD as calculated from the repeat measures of each participant.

(a) Individual participant final target population means and standard deviations. (b) Participant’s expanded uncertainty. (c) Non-parametric distribution of participant’s expanded uncertainty results with the median expanded uncertainty shown as the red line.
Quantitatively, this distribution has a mean cell count and standard deviation of 32.1% ± 5.7% (17.7% CV) with a close median value of 32.5%. Although normal in shape, the distribution of this set of results is nonparametric according to the Shapiro–Wilk test for normality (p = 0.003). Calculation of skewness and kurtosis z-scores using IBM SPSS Statistics Version 24 returned values of 1.3 and 4.4, respectively. Both show positive skewness and kurtosis; however, it is only deemed significantly non-normal if the z-score value lies outside of ± 2.58% boundaries, which equates to a statistical significance level of 0.01. Therefore, the departure from normality is likely due to the kurtosis of the sample, where kurtosis is a measure of how much a distribution and normality thereof is affected by extreme values. This is significant, because it identifies why descriptive statistics should be initially evaluated. It can be seen in Figure 6c that the higher values on the right of the scale will have a greater impact on the location value for the whole population.
In this instance, extreme limits represented by the minimum and maximum values of participant average percentage counts were 19.5% and 51.3%, respectively, showing that participant subjectivity could have a profound effect on the results analysis and consequent decisions. An improvement in training and proficiency as shown by many qualified to EQAS level can help reduce this disparity in results, which could have a large knock-on effect when release testing even with standardized protocols, to reduce the interoperator and interlaboratory variability, improving measurement confidence (10⇓–12, 37, 38).
Figure 6b details each participant’s expanded uncertainty, U. This value was used to represent the variability of each participant and could potentially be used to contribute to the development of FC uncertainty budgets if combined with other FC uncertainty sources as illustrated in Figure 1. The descriptive statistics calculated showed a slightly more skewed distribution than the respective cell counts. Shapiro–Wilk testing (p = 0.007) indicated a nonparametric distribution, with greater disparity between the mean and median values at 3.9% and 3.6%, respectively. To represent the overall uncertainty distribution of the results, the median was used because this was closer to the local maxima in frequency, as shown in Figure 6c.
The minimum and maximum uncertainties were 0.3% and 13.1%, respectively (at k = 2), which could help in defining the limitations for variability, proficiency, and training. The uncertainties had a skewness z-score of 3.2 and kurtosis of 2.8, showing large skewness and affect by extreme values. In comparison to the cell count averages, this showed that the result variability was more likely to be affected by the participant precision and reproducibility than actually identifying the correct population. This was the reverse of concerns expressed by the participants about automated analysis of data, stating that automated methods may reproducibly identify the same area, but this area may not be the correct target in question. The second gate that the participants applied was not initially defined, so there were differences between participants. However, this had not impacted the expanded uncertainty of their final analysis, and there was no significant difference between the analysis stratifications.
3.3. Comparison of Qualitative and Quantitative Metrics
A Kruskal–Wallis H test was applied to determine if there were differences in uncertainty among the different experience levels of the FC participants. It was chosen because of the rank-based nonparametric alternative to analysis of variance (ANOVA), to compare the multiple independent experience groups (experience defined as how long they have been using FC as a technique) (39). The participants with “less than 12 months” experience (n = 17), “13–48 months” (n = 10), and “49 months and over” (n = 10), had similar distributions of uncertainty as assessed by visual inspection of box plots. The median experience group scores were similar, 3.7% (≤12 months), 3.2% (13–48 months), and 3.5% (49+ months), with no statistical significance among the groups testing with a χ2 distribution, χ2 (2) = 2.29, p = 0.32. This indicated that there was no significant difference among the experience groups and the uncertainty of their measurements in the context of length of time spent using the technique.
The distributions were similar for all use frequency groups, and the median use frequency scores were also close, ranging from those who used FC for <1 month (3.6%, n = 16), to those who used FC more than once a week (4.9%, n = 6). Although the median uncertainty was higher for those who used a flow cytometer more often, this group contained fewer participants, and there was no statistical significance, χ2 (3) = 1.37, p = 0.713. Although there was no significant difference between the two use frequency stratifications, there was no obvious difference in the because of other factors such as experience or gates chosen in step 2. This showed that overall experience or use frequency of FC did not indicate a lower uncertainty or more refined measurement precision. A power analysis indicated that if this study were to be repeated, 182 participants (91 per usage group) would be needed to determine a significant effect, assuming the distribution shape changed to normal from nonparametric. However, in this instance, 182 participants were not feasible in the time frame, so as many participants were gathered as possible (38 participants).
Relating to previous work (17), it is possible to write a refined protocol to implement right-first-time methodology to keep variance low as a function of operator subjectivity. Validation of this protocol becomes very important, ensuring it is straightforward enough to follow so that operators do not cut corners, actions that could compromise quality. However, this has only been shown on one dimension, so additional uncertainty could be introduced when multivariate plots are used for data analysis. Use of more detailed protocols have been proven to work in other qualitative health care analysis instances, such as computed tomography measurement of fractures and calibration of positron emission tomography/computed tomography (PET/CT) scanners, to reduce the impact of operator-related error, showing that further use of protocols could reduce variance in other health care manufacturing data analysis situations (40, 41). In addition to this, automation efforts are ever increasing, so could potentially help when analyzing highly dimensional data, although these require similar levels of validation.
4. Conclusions
This research was developed to identify the possibility of quantifying operator subjectivity within FC, using GRR as an experimental framework and application of measurement uncertainty methods. An initial median uncertainty value of 3.6% (k = 2) was defined for the basic FC analysis in the context of the analysis of fully stained EC 2102Ep cell FCS files and a three-color FC panel. However, it was suggested that this uncertainty may change as a function of the complexity of the cell model and the higher dimensionality of respective FC panels.
When trying to understand this value in conjunction with study participant experience, there was no initial significance that indicated more experienced FC participants had smaller variation than their beginner colleagues. Uncertainty values were expressed as expanded uncertainties (at k = 2, two sigma) here to monitor participant variance, but the combined uncertainty could be used in conjunction with other FC measurement parameter uncertainties terms to provide a more informed uncertainty budget for an assay. However, it should be noted that this was an initial indication and definitive uncertainties should be calculated on a case-by-case basis where necessary, with a requirement for a full definition of FC variability terms and their relevance. In addition to experience, use frequency showed that although those who used flow cytometers more often had a higher median uncertainty in their results, this was not significant, therefore a more extensive study is needed to support this.
The absolute cell population results had a mean and SD of 32.1% ± 5.7% creating a CV of 17.7%. This interparticipant distribution was normal in shape although impacted by extreme values, which gave a total range in results of 31.8%. This inter-range range was considerable, showing that uniform data can have variance added because of operator subjectivity, so methods to try and control operator gate placement require future investigation to try and control this source of variability. Reference standards can help standardize FC operator testing, to generate some standard data sets for training purposes. This allows interoperator variance to be measured as shown in this paper, for development of better training and learning opportunities. These data sets can also be used to test and validate potential machine learning algorithms against known operator variance. Uncertainty measurement of operators within manufacturing and data analysis scenarios is a continuing research theme of this group, with future publications developing upon this content.
A large majority of the participants surveyed preferred manual gating to automated data analysis options, predominantly because of legacy factors and assumed accuracy. In this sense, accuracy required a different explanation to the commonly accepted current metrology definition. Improvements in reference standards available for FC measurements and analysis thereof are enabling outcomes to have better traceability. The lexicon used for biomanufacturing metrology needs addressing to ensure that terms such as accuracy and precision are understood to be the traditional metrological definition, or whether a biomanufacturing alternative is created. This would encapsulate many data concerns that relate to threshold setting and separation of cellular populations, not just seen in FC, but across many other CGT measurement platforms.
FC training was shown to vary depending on the training source, which could cause analysis bias from the start of an operators understanding of the technique, regardless of whether they have completed any data analysis or not. It also remains to be seen whether certification and recertification seen in other international (US) clinical settings could be an effective model to adopt or influence better training procedures and SOPs in UK-based industrial and research settings.
Conflict of Interest Statement
This research was kindly supported by the EPSRC/MRC Doctoral Training Center for Regenerative Medicine at Loughborough University (EP/L105072/1), GlaxoSmithKline, and LGC.
Acknowledgements
The authors would like to acknowledge all participants that completed the questionnaire and took part in the studies. They would also like to acknowledge Dr. Tamara Lekishvili (formerly LGC) for flow cytometry training and Dr. Amit Chandra and Prof. David J Williams (Loughborough University) for providing the 2102Ep Embryonal Carcinoma Cell line.
- © PDA, Inc. 2021


