
Abstract
This paper describes the use of the BioVigilant® IMD-A™, a real-time and continuous monitoring technology based on optical spectroscopy, to simultaneously and instantaneously detect, size, and enumerate both viable and nonviable particles in a variety of filling and transfer isolator environments during an aseptic fill, transfer of sterilized components, and filling interventions. Continuous monitoring of three separate isolators for more than 16 h and representing more than 28 m3 of air per isolator (under static conditions) yielded a mean viable particle count of zero (0) per cubic meter. Although the mean count per cubic meter was zero, the detection of very low levels of single viable particles was randomly observed in each of these sampling runs. No viable particles were detected during the manual transfer of sterilized components from transfer isolators into a filling isolator, and similar results were observed during an aseptic fill, a filling needle change-out procedure, and during disassembly, movement, and reassembly of a vibrating stopper bowl. During the continuous monitoring of a sample transfer port and a simulated mousehole, no viable particles were detected; however, when the sampling probe was inserted beyond the isolator–room interface, the IMD-A instantaneously detected and enumerated both viable and nonviable particles originating from the surrounding room. Data from glove pinhole studies showed no viable particles being observed, although significant viable particles were immediately detected when the gloves were removed and a bare hand was allowed to introduce microorganisms into the isolator. The IMD-A technology offers the industry an unprecedented advantage over growth-based bioaerosol samplers for monitoring the state of microbiological control in pharmaceutical manufacturing environments, and represents significant progress toward the acceptance of microbiology process analytical technology solutions for the industry.
- Environmental monitoring
- Barrier isolator
- Manufacturing
- Optical spectroscopy
- Viable
- Nonviable
- Particles
- Rapid microbiological methods
Introduction
The term barrier isolator as used in the pharmaceutical industry covers a variety of equipment, including enclosures that provide a microbiologically controlled environment within which aseptic operations can be carried out (1). Over the last 10 years, the installation of isolators has steadily increased, from 84 in 1998 to 373 in 2008 (2), as the pharmaceutical industry looked to minimize the potential for microbial contamination during aseptic processing. Regulatory agencies have also realized the advantages of using barrier isolators, and this is reflected in a number of guidance documents that have recently been published. The Food and Drug Administration (FDA) Guidance for Industry: Sterile Drug Products Produced by Aseptic Processing—Current Good Manufacturing Practice (3) states that aseptic processing using isolation systems separates the external cleanroom environment from the aseptic processing line and minimizes its exposure to personnel. It also states that a well-designed positive pressure isolator, supported by adequate procedures for its maintenance, monitoring, and control, offers tangible advantages over traditional aseptic processing, including fewer opportunities for microbial contamination during processing. Similarly, the EU Guidelines to Good Manufacturing Practice, Annex 1, Manufacture of Sterile Medicinal Products (4) emphasizes that the utilization of isolator technology to minimize human interventions in processing areas may result in a significant decrease in the risk of microbiological contamination of aseptically manufactured products from the environment.
Although isolators reduce the risk of microbial contamination during aseptic processing, an environmental monitoring program and sampling plan is still expected to be in place, especially in areas where microorganisms may gain entry into the isolator through half-suits, gloves, and/or mouseholes (i.e., an opening in the isolator wall where filled product exits the enclosure). From a regulatory perspective, the FDA Guidance for Industry (3) cites that an environmental monitoring program should be established that routinely ensures acceptable microbiological quality of air, surfaces, and gloves (or half-suits) as well as particle levels, within the isolator, and that air quality should be monitored periodically during each shift. Similarly, EU Annex 1 (4) expects that monitoring is carried out routinely and includes frequent leak testing of the isolator and glove/sleeve system.
An environmental monitoring program should be meaningful, manageable, and defendable (5). The program should also provide information about the state of control in the production environment, be capable of reporting the data and corresponding trends, utilize scientifically sound and justifiable methods, and meet the appropriate regulatory expectations. From a manufacturing control perspective, environmental monitoring data should be capable of detecting an adverse drift in environmental conditions in a timely manner that would allow for meaningful and effective corrective actions to be undertaken (6).
Environmental monitoring in isolators is comprised of two components—monitoring viable (i.e., microorganisms) and nonviable particles. Many companies employing isolators utilize sampling technologies for the continuous and real-time assessment of nonviable particles; however, these same firms rely on single-point, growth-based methodologies for the detection and quantification of microorganisms in volumetric air samples. Monitoring the environment for nonviable particulates and microorganisms is an important control function because both are important in achieving product compendial requirements for particulate matter and sterility (6). The use of conventional methods can present a number of challenges. For quantitative procedures in which bioaerosol samplers are used inside an isolator, microbiological media and supplies need to be transferred into the isolator, and after sampling is performed, the media is transferred out of the isolator and brought to the lab where, following an appropriate incubation period (e.g., 3–5 days), the number of colony-forming units (cfu) are obtained and the data interpreted. The process by which microbiological media is transferred into an isolator will need to be qualified such that decontaminating gases (e.g., vapor phase hydrogen peroxide) will not impart any bacteriostatic or bactericidal effects on the media and prevent captured organisms from growing. Next, there may be situations where airborne microorganisms may not replicate and form cfu when cultured on artificial media, even though they are present. This may be due, in part, to organisms being stressed as a result of nutrient deprivation, or damaged after exposure to sub-lethal concentrations of chemical or physical antimicrobial agents (7). Microorganisms in this state are commonly referred to as being in a viable but non-culturable (VBNC) condition, in which the artificial medium and/or incubation conditions are not optimal for cellular resuscitation and subsequent proliferation (7–18). Furthermore, commercially available bioaerosol samplers may be limited by their design, in that the aerodynamics of many systems limit the efficiency and consistency of capturing microorganisms on an agar plate, and high air flow rates, shearing forces, and/or desiccation may damage microorganisms, resulting in reduced or no microbial growth (19–22). For these reasons, the pharmaceutical industry should look towards developing innovative approaches to the detection and quantification of microorganisms in isolator manufacturing environments. In this case, the use of rapid microbiological methods (RMMs) may offer significantly reduced time-to-result or results in real time for microbial detection and quantification during environmental monitoring (23–25).
The evaluation of a novel, optical spectroscopic technology designed to simultaneously detect, size, and quantify both viable and nonviable particles in real time has been previously reported (26). During these studies, the BioVigilant IMD-A was compared to conventional viable (MAS-100™) and nonviable (CLiMET® CI-450t) air samplers, and it was determined that the IMD-A was capable of enumerating both viable and nonviable particles in controlled and uncontrolled environments, sampling large volumes of air in a continuous monitoring mode, and obtaining the results in real time. This paper assessed the ability of the IMD-A to simultaneously and continuously detect viable and nonviable particles in a variety of static and dynamic isolator operating conditions, including the transfer of sterile components, an aseptic fill, and filling interventions. Additionally, the IMD-A was used to monitor an isolator environment in the location of a simulated mousehole and when a breach in isolator glove integrity was artificially created.
Materials and Methods
Materials
This study utilized the BioVigilant IMD-A, an optical spectroscopy air sampling technology that relies on Mie scattering, in which scattered light is concentrated in a forward direction, and the scattered portion of the light is proportional to the particle size. When airborne particles are processed through the IMD-A, the system detects and quantifies particles within a 0.5–15 μm range. At the same time, a 405-nm laser intersects the particle beam, and causes particles of biological origin, such as vegetative bacteria, yeast, and spores, to autofluoresce, due to the presence of cellular NADH, riboflavin, and dipicolinic acid. Data is acquired instantaneously and the system is capable of analyzing a single volumetric air sample or operating in a continuous monitoring mode. The system has a total airflow rate of 28 liters of air per minute (LPM), has an experimental collection efficiency equal to 50% for the IMD-A concentrator (using 1.0-μm particles) and has an experimental d50 equal to 1.0 μm for the IMD-A concentrator (26). The supplier has also performed comparative studies with air samplers, and has submitted a Drug Master File to the U.S. FDA containing results of an extensive microbiological validation (including accuracy and precision) as specified in United States Pharmacopeia (USP) Chapter 〈1223〉 (27). A full description of the technology may be found in the Encyclopedia of Rapid Microbiological Methods (28). A picture of the commercially available IMD-A instrument and an example of the data display screen may be found in the Materials section in Part I of this evaluation (26).
Methods
All reported studies were conducted in Eli Lilly and Company's Parenteral Product Development Facility located in Indianapolis, Indiana. Within this facility, a variety of manufacturing isolators were utilized, including those used for aseptic filling, the transfer of components and supplies, and the autoclave, dry heat oven, and lyophilizer interface enclosures. The surrounding environment where the isolators are located is unclassified and is not controlled for viable or nonviable particulates. The data acquisition software for the IMD-A can be programmed to sample a volume of air in either cubic feet (ft3) or cubic meters (m3). The sample size for these studies was set at 1 m3 of air, which is the volume at which the European Commission (4) and the FDA (3) set active air monitoring acceptance levels (Tables I and II). Action levels for nonviable and viable particles were manually configured within the software to reflect current expectations for an ISO 5 (Class 100, Grade A) environment (Tables I and II). Alert levels were arbitrarily chosen that were slightly lower than the action levels for the nonviable particles. The viable particle alert level was the same as the action level. A video camera was also attached to the laptop, and the software was programmed to capture and archive a video record synchronized with the acquisition of particle counts in real time.
FDA Air Classificationsa
EU Air Classifications
Static Monitoring in Filling and Transfer Isolators:
Initial studies assessed the ability of the IMD-A to detect viable and nonviable particles during static monitoring of a 3-glove and an 8-glove transfer isolator, and a 12-glove filling isolator. Characteristics of the isolators are given in Table III. Because the IMD-A is too large to fit inside a typical isolator, it was necessary to monitor the air through a sampling tube. For this purpose the vendor-recommended sample tubing was obtained from BioVigilant (Teflon; less than 8 feet in length; 1/2 inch i.d. [internal diameter]). One end of the tubing was attached to the IMD-A air inlet on the top of the instrument, and the other end was inserted into each isolator via a small transfer port such that the end of the sampling tube was located within the turbulent air flow stream near the return high-efficiency particulate air (HEPA) filter (Figures 1–6). Each isolator was decontaminated using vapor-phase hydrogen peroxide (VPHP) according to previously validated cycles followed by an aeration phase such that the residual VPHP levels were at or below 1 ppm. During VPHP decontamination, the sampling tube was closed to the IMD-A, and the instrument was not in operation. Following aeration, the isolators were run under standard operating positive pressure and there were no manual or automated activities taking place inside the enclosures (i.e., operations inside the isolators were at rest or under static conditions). Prior to monitoring, air was collected through the IMD-A to purge the sampling path of particles that may have been introduced during set-up of the sampling line. This purging procedure was also performed prior to the start of every phase of testing described in this paper. When it was determined that the level of particles was reduced to an acceptable baseline, continuous monitoring of a minimum of 28 m3 of air was initiated. All of the data was collected and archived on the laptop that was controlling the IMD-A instrument, and it was possible to review the rolling and average counts for each particle (i.e., ≥0.5 μm, ≥5.0 μm, and viable) per cubic meter of sampled air.
Isolator Dimensions and Operating Parameters

(1) 3-glove transfer isolator. (2) 3-glove transfer isolator sampling tube placement. The sampling tube is inserted into the isolator via a small transfer port (arrow denotes sampling tube location). (3) 8-glove transfer isolator. (4) 8-glove transfer isolator sampling tube placement. The sampling tube is inserted into the isolator via a small transfer port (arrow denotes sampling tube location). (5) 12-glove filling isolator. The filling isolator is located in the center; the 3-glove and the 8-glove isolators are docked to the filling isolator on the right and left side, respectively. (6) 12-glove filling isolator sampling tube placement. The sampling tube is inserted into the isolator via a small transfer port and held in place using a ring stand and clamp (arrow denotes sampling tube location).
Transfer of Sterilized Components into the Filling Isolator:
Autoclaved filling equipment components (e.g., stoppers, stopper bowl, cap bowl, filling needles) were transferred into the 8-glove transfer isolator via an autoclave interface isolator (Figure 7). The transfer isolator was then docked with the filling isolator (Figure 8) and as components were moved into the filling isolator, the IMD-A was used to monitor this activity (Figure 9). Dry heat oven sterilized/depyrogenated glass vials were transferred (in stainless steel vial cans) into the 3-glove transfer isolator via a dry heat oven interface isolator (Figure 10). The transfer isolator was then docked with the filling isolator (Figure 11) and as the vial cans were transferred into the filling isolator; this activity was monitored (Figure 12). During both of these transfer activities, the IMD-A sampling tube was located inside the filling isolator at a location close to the rapid transfer port (RTP) opening (Figures 9 and 12). The filling isolator was continuously monitored prior to docking the transfer isolators when the RTP doors were opened, during the transfer of components, and when the RTP doors were closed.

(7) Autoclave interface isolator (left) and 8-glove transfer isolator (right). (8) 8-glove transfer isolator (left) docked to the filling isolator (right). (9) Transfer of autoclaved components from the 8-glove transfer isolator into the filling isolator. The arrow denotes sampling tube location. (10) Dry heat oven interface isolator (right) and 3-glove transfer isolator (left). (11) 3-glove transfer isolator (right) docked to the filling isolator (left). (12) Transfer of sterilized components from the 3-glove transfer isolator into the filling isolator. The arrow denotes sampling tube location.
Dynamic Monitoring of the Filling Isolator during an Aseptic Fill:
An isokinetic probe was designed based on the isolator's vertical air flow velocity and the IMD-A sampling flow for use in monitoring critical areas under unidirectional laminar flow. The velocity of the unidirectional air flow in the isolator was measured at 0.48 m/s, and the resulting velocity of the air stream entering the isokinetic probe was 0.46 m/s. The probe design is shown in Figure 13. The probe was attached to the end of the IMD-A sampling tube.

(13) Isokinetic probe design. (14) Location of isokinetic probe during aseptic fill monitoring. The probe is located just to the right of the filling needle. The vial accumulation table can be seen to the right of the probe; the vibrating stopper bowl and stopper station are located to the left of the filling needle (see arrow). (15) Monitoring the transfer of vial trays into the filling isolator. Note the location of the isokinetic probe behind the accumulation table (see arrow).
First, the filling line was assembled using the sterilized components that previously had been transferred into the filling isolator via the 3-glove and the 8-glove transfer isolators. Next, the isokinetic probe was positioned directly next to the filling needle (Figure 14). The air was sampled through the probe to ensure that all particles introduced into the sampling line during set-up were removed. A sterile water aseptic fill was conducted with a single filling needle operating at a line speed of 10 vials per minute and a fill volume equal to 10 mL. During the fill, the vial accumulation table, vibrating stopper bowl, and the vial stopper station were in operation. Additionally, new vials were transferred from the 3-glove isolator into the filling isolator via the RTP and placed onto the accumulation table during the fill. We monitored the filling line until 1 m3 of air was sampled and 350 vials were filled (approximately 35 min). Following this run, we relocated the probe behind the vial accumulation table and monitored the opening of the RTP door, the transfer of vial cans from the 3-glove isolator into the filling isolator, and the subsequent closing of the RTP door (Figure 15).
Monitoring during Interventions:
The isokinetic probe was used to monitor the isolator during a variety of aseptic processing interventions, including changing the filling needle, simulating a stopper bowl replacement, and re-positioning vials on the accumulation table.
The first test involved changing the needle used during the aseptic fill with a new, autoclaved needle that was previously transferred into the enclosure via the 8-glove transfer isolator and RTP. Continuous sampling was performed when the Tyvek/Mylar pouch containing the new needle was opened, when the existing needle was detached from the filling line, and when the new needle was attached to the line and reseated into the needle holder (Figure 16). Following this activity, the same intervention was repeated using a non-sterile needle that had been transferred into the isolator (via a small transfer port) after sanitizing the pouch with sterile 70% isopropyl alcohol (IPA).

(16) Filling needle replacement. Note the location of the isokinetic probe directly below the filling needle holder (see arrrow). (17) Location of isokinetic probe during stopper bowl replacement. The probe is located directly in front of the stopper bowl (see arrow). (18) Stopper bowl replacement (see arrow for probe location). (19) Accumulation table monitoring and vial repositioning. Note the location of the isokinetic probe in the foreground (see arrow).
The next intervention involved a simulated stopper bowl replacement. The isokinetic probe was repositioned directly next to the stopper bowl (Figure 17), the stopper bowl detached from its support base, the bowl lifted over the probe, and the bowl moved to the other side of the isolator (Figure 18). After holding the bowl at that position for approximately 10 s, the bowl was returned to its original location and reattached to its support base.
The last intervention involved using sterile forceps to randomly knock over glass vials located on the vial accumulation table and then manually realigning them in the upright position (Figure 19). This intervention was conducted while the accumulation table was rotating and all of the filling equipment was in operation. Additionally, the filling line was stopped and restarted, and new vials were removed from their trays and added to the accumulation table during the course of monitoring this intervention.
Monitoring Isolator Exit Ports:
Isolators often include a mousehole or other exit port through which product is discharged, opening the isolator to the outside environment. Sufficient overpressure should be supplied on a continuous basis to prevent potential ingress of surrounding room air by induction. Induction can result from local turbulent flow, causing air swirls or pressure waves that might push extraneous particles into the isolator (3). Two locations were identified where the ability of the IMD-A to detect particles entering the isolator as a result of induction or loss of positive pressure was assessed: a discharge chute for retrieving filled vials during in-process testing and a simulated mousehole.
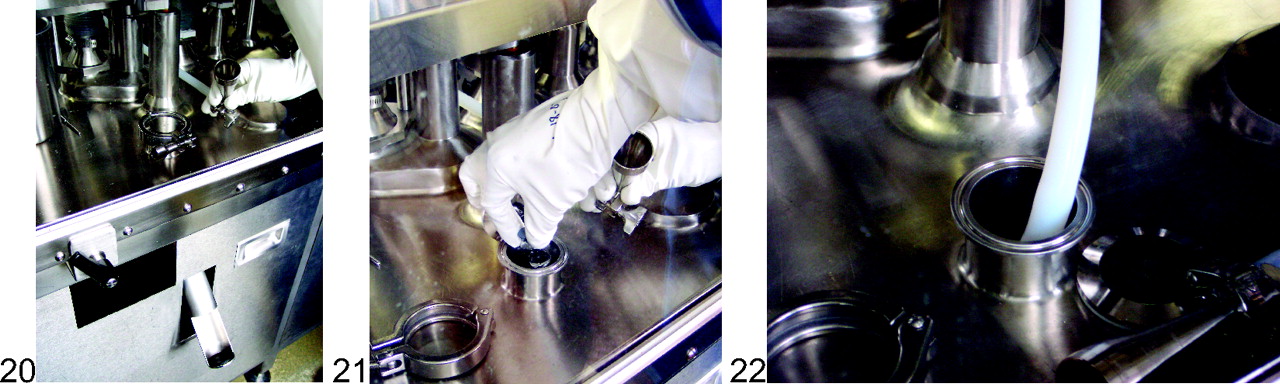
Initially, the isokinetic probe was used to monitor 0.1 m3 of air at the opening of the vial discharge chute (Figure 20). During this activity three filled vials were dropped through the chute opening (Figure 21). Next, the isokinetic probe was removed from the sampling tube and the tube was inserted halfway into the discharge chute (approximately 4 inches, or 10 cm) to assess whether there was sufficient positive pressure to prevent the ingress of room air into the inside of the chute (Figure 22).

(20) Vial discharge chute. Note the opening to outside room air at the bottom of the chute. (21) Transferring three filled vials through the discharge chute. (22) Sampling tube inserted into the vial discharge chute.
Following the discharge chute study, a simulated mousehole was created for the purpose of monitoring the immediate vicinity of a physical opening in the filling isolator. Because the isolator did not have a mousehole design typical of what would normally be found in production isolators, a 5-inch (12.7-cm) diameter rapid transfer port was opened. Initially, 0.1 m3 of air was monitored with the isokinetic probe located approximately 3 inches (7.6 cm) inside the isolator (Figure 23). Following this sampling run, the probe was repositioned in such a way that the probe opening was in the middle of the mousehole at the isolator–room interface, and another sampling run was initiated. After monitoring for 1 min, the probe was pushed beyond the isolator–room interface until the probe was outside of the isolator (Figure 24) while the sampling continued.

(23) Simulated mousehole. The isokinetic probe is inside the isolator. (24) The isokinetic probe is outside the isolator and sampling room air.
Monitoring Glove Interventions and Loss of Glove Integrity:
The principle challenge in aseptic processing is to maintain a consistently high level of microbial control over the environment (29). Personnel represent the greatest source of microbial contamination in an aseptic process; it has been estimated that more than 99% of all microorganisms detected in cleanrooms are of human origin (29). The use of advanced aseptic processing environments, such as isolators and restricted access barrier systems (RABS), have significantly reduced the microbiological risk associated with the presence of operators in critical manufacturing areas. Gloves are an integral component of both RABS and isolator systems, and because gloves are used in many applications including interventions, glove sterility and integrity represent the greatest weakness in these very capable systems (30).
It has been suggested that a breach in glove integrity can be of serious consequence to product being manufactured in an isolator environment (3). Therefore, current guidance on the management of isolator integrity includes the preventive maintenance, inspection, and testing of isolator gloves, sleeves, and suits (1, 3, 4). Glove leaks can occur via mechanical damage through contact with sharp equipment and tools or broken glass, clamping in mechanical installations, heavy use and aging, resulting in cuts or holes in the glove material (31). Furthermore, experience with filler isolators shows that many perforations or leaks in gloves and sleeve assemblies are caused by interventions with stopped machinery. Leaks in the sleeve are very common, and typically arise from overstretching, wear-through caused by leaning on the glove port ring, and untrained or inappropriate handling by the user (31). For these reasons, a study on the ability of the IMD-A to detect the ingress of viable and nonviable particles, as a result of a loss of glove integrity, was performed.
Monitoring Glove Integrity:
The FDA Guidance for Industry states that a monitoring and maintenance program should identify and eliminate any glove lacking integrity and minimize the possibility of placing a sterile product at risk. Therefore, it is recommended that with every use, gloves should be visually evaluated for macroscopic physical defects and that physical integrity tests should be performed routinely (3). The FDA's assertion that a breach in glove integrity can be of serious consequence during the manufacture of sterile drug product was assessed by monitoring an isolator environment when gloves with known physical defects were being used.
To accomplish this, pinholes were created in Hypalon glove fingertips using a sharp instrument, and the resulting pinhole sizes were confirmed with a Skan HSPG-3 glove tester. Gloves with two pinhole sizes (75–100 μm and 200–250 μm) were separately evaluated using a novel approach that encouraged the movement of particles from the surrounding room air into the glove assembly and the isolator environment. First, a particle count baseline was established by securing a clamp to the finger that contained the pinhole, attaching the glove to the isolator glove gauntlet, and monitoring the isolator air with the end of the IMD-A sampling tube in close proximity to the pinhole (Figure 25). During this phase of testing, the operator's hand was not inserted in the glove. After establishing the baseline count, the clamp was removed and the air continued to be monitored. Next, the operator donned a latex glove, sanitized the latex glove with 70% IPA, inserted his hand into the isolator glove, and held the fingertip with the defect directly over the sampling tube. After a short monitoring period, the operator randomly moved and flexed his fingers, rubbing the tip of the pinhole with an adjacent finger, and opened and closed his fist (Figure 26). Following these activities, the operator withdrew his hand, removed the latex glove, reinserted his bare hand and repeated his finger movements as described above. The operator then held the fingertip pinhole directly over the sampling tube (with his bare hand still inserted in the glove) while a second operator created a negative pressure environment (0.13–0.2 inches of water) by quickly pulling out the RTP on the end of the transfer isolator (Figure 27). This activity was performed to force air from the outside surrounding room through the pinhole and into the IMD-A sampling tube. The testing was conducted in sequence with the IMD-A operating continuously and without interruption.

(25) Pinhole monitoring with clamp on glove. (26) Pinhole monitoring with hand inserted. (27) Creating a negative pressure environment by pulling out the RTP. (28) Monitoring with cut fingertip and sanitized gloved-hand inserted. (29) Monitoring with cut fingertip and bare hand inserted. (30) Monitoring with all glove fingers removed. (31) Monitoring with glove removed.
Following the pinhole studies, a number of scenarios were designed that represented a catastrophic loss of isolator glove integrity and used the IMD-A to monitor these events. The first scenario involved cutting ½ inch (1.3 cm) of glove material off the end of a fingertip and holding the exposed hole directly over the IMD-A sampling tube. After monitoring the exposed hole, the operator inserted a sanitized latex gloved hand into the isolator glove, held the fingertip over the sampling tube, and then flexed his finger (Figure 28). Next, the operator removed his gloved hand, reinserted a bare hand, held the bare fingertip over the sampling tube, and flexed his finger (Figure 29). This was followed by generating a negative pressure (via the RTP as previously described) while the exposed bare fingertip was held over the IMD-A sampling tube. Testing was conducted in sequence with the IMD-A operating continuously and without interruption.
This experiment was immediately followed by the operator cutting off all the glove fingers to the base of the glove, reinserting his bare hand, and flexing his fingers over the sampling tube while the IMD-A continuously monitored the air (Figure 30). Following these activities and while the IMD-A continued to monitor the isolator environment, the operator completely removed the Hypalon glove from the gauntlet, reinserted his hand back into the isolator, rapidly moved his hand, flexed and snapped his fingers, and grasped the tip of the sampling tube (Figure 31). Lastly, the operator attempted to introduce a large particle load into the isolator by removing his hand, rubbing his fingers on his mustache, reinserting his hand again, and rubbing his fingers directly over the sampling tube.
Results and Discussion
The data generated during this comprehensive evaluation demonstrated that the BioVigilant IMD-A technology was capable of simultaneously and continuously detecting, sizing, and enumerating both viable and nonviable particles during all of our active air monitoring tests.
Static Monitoring in Filling and Transfer Isolators
Recovered particle counts for continuous 1-m3 air samples for the 3-glove transfer, 8-glove transfer, and the 12-glove filling isolators are shown in Table IV.
Static Monitoring in Isolators
Similar viable and nonviable particle counts were observed for both the 3-glove and the 8-glove turbulent flow transfer isolators when continuously monitoring 28 m3 of air. In the 12-glove unidirectional flow filling isolator, substantially lower counts were observed for the ≥0.5-μm nonviable particles and the ≥5.0-μm nonviable particles. A review of the raw data for the filling isolator demonstrated that during the course of the 29-m3 sampling run, a total of 44 0.5-μm nonviable particles and a single 3.0-μm nonviable particle were detected. No 5.0-μm or larger nonviable particles were detected during this run. Furthermore, the time at which the particles were detected was random throughout the run, and no two particles were detected at the same time. For all isolator runs during this study, the nonviable counts were well within the expected recoveries for an ISO Class 5 (Grade A, Class 100) area for both ≥0.5-μm (3520; Tables I and II) and ≥5.0-μm particles (20; Table II) per cubic meter of air.
The mean viable particle count per cubic meter of air was zero (0) for all of the isolators evaluated during these studies, and the results are aligned with EU Annex 1 (4) guidelines that allow an average active air level <1 cfu per m3 (refer to Table II in this paper). These results are also consistent with similar data recently reported by Bhupathiraju et al. (32), where no viable counts were detected in a Grade A cleanroom environment when 35 L (0.035 m3) of air were monitored using the IMD-A. However, during the current extended monitoring studies, where at least 28 m3 of air were sampled, the instrument detected a very low level of individual viable particle events even though the reported mean count was zero particles per cubic meter. Seven (7) viable particles were detected during the 3-glove transfer isolator run, eight (8) events occurred during the 8-glove transfer isolator run, and six (6) events occurred during the filling isolator run. Similar results were reported during the continuous monitoring of HEPA-filtered air in three separate IMD-A instruments in Part I of these evaluations, where low levels of viable particles were detected (26). In the current study, the viable particle detection events were random across the continuous monitoring period (more than 16 h) for all three isolators, and a subsequent review of the raw data demonstrated that each event was attributable to a single viable particle being detected, ranging in size between 0.5 and 1.0 μm. It is also interesting to note that there was no apparent trend of grouping of viable particles being detected at any given time during the entire sampling run for each isolator. These results are only applicable to the isolators evaluated during our studies, and it is possible that monitoring other isolator environments may provide a different set of data (e.g., no viable particle counts). For this reason, a comprehensive evaluation using the IMD-A may be warranted for each isolator where environmental monitoring will be routinely performed.
These results contradict what the industry has historically observed within aseptically-controlled areas (i.e., typically no detection of viable particles within ISO Class 5 environments). Although HEPA filters are not 100% efficient, there is no known data demonstrating that microorganisms are able to pass through these filters (33). Akers and Agalloco contend that it is impossible to determine what level of microorganisms is actually present in these environments with any degree of certainty (34). These conclusions should be of no surprise, as the methods historically used for active air sampling in HEPA-filtered environments may not be sensitive enough to detect very low levels of airborne microorganisms that may actually be present. In fact, USP Chapter 〈1116〉 states that the method for quantitative microbiological air sampling (described in the chapter) may not have sufficient sensitivity to test the environment inside an isolator (6).
One explanation for why an extremely low level of viable particles was detected in the current studies is that the IMD-A platform is a more sensitive technology for the detection of microorganisms as compared with growth-based methods, especially for VBNC organisms, as previously discussed. The IMD-A detects microorganisms based on the presence of cellular viability markers, namely, riboflavins, NADH, and dipicolinic acid, instead of relying on the same microorganisms having the ability to grow on agar media. If we assume that a proportion of the airborne microorganisms collected during our studies were physically stressed or in a VBNC state, then this may explain why we observed low levels of viable particles in an ISO Class 5 environment when we would historically observe no colonies on agar medium (from the same area). It has been previously suggested that stressed and VBNC organisms may be responsible for the underestimation of airborne cells in environmental monitoring samples (35, 36). Nagarkar et al. reported the presence of oligophilic bacteria in considerable numbers in cleanrooms where the counts on conventional media were zero (37). This is further supported by additional studies demonstrating that other viability-based RMMs, such as flow cytometry (38) and solid-phase cytometry (39) detect greater numbers of microbial counts when compared with growth-based methods. A second explanation centers on collection efficiency of airborne particles. The IMD-A concentrator provides a substantially higher experimental collection efficiency and a lower experimental cut-off (d50) size than most conventional bioaerosol samplers (26). This may explain why low levels of viable particles were observed in the current study as well as higher viable counts in the IMD-A when compared with an MAS-100 air sampler in Part I of these evaluations (26). Furthermore, it is now practical to continuously monitor for viable particles over an extended period of time, which has not been possible (without significant challenges) using agar-based bioaerosol samplers.
Lastly, the FDA Guidance for Industry (3) and European Commission EU Annex 1 (4) allow up to 3520 particles that are ≥0.5 μm in size per cubic meter, and EU Annex 1 allows up to 20 particles that are ≥5.0 μm in size per cubic meter, in ISO 5 or Grade A aseptic areas. Airborne microorganisms can exist either as planktonic, free-floating entities or in association with a nonviable particle that acts as a vehicle for microorganisms, representing sizes that may fall within the same range as the nonviable particles that we currently allow to be present in HEPA-filtered environments. Therefore, one could consider that very low levels of viable particles may have always had the potential for gaining access into HEPA-filtered environments, and the IMD-A technology is capable of detecting and quantifying these particles in real time. Agalloco and Akers state that although isolators are superior to a staffed cleanroom with regard to excluding microbial contamination, isolators are not perfect, and despite any decontamination treatment they are given they cannot be considered sterile (29).
Not surprisingly, these conclusions raise the question of whether there will be any regulatory impact on our current manufacturing processes by using the IMD-A for routine active air monitoring. Fortunately, recent regulatory discussions and published documents provide guidance on this topic. First, a review of the footnotes in the FDA Guidance for Industry (3) Air Classifications table (Table I in this paper) suggests that samples from Class 100 (ISO Class 5) environments should normally yield no microbiological contaminants; however, these values represent recommended levels of environmental quality, and it may be appropriate to establish alternate microbiological action levels due to the nature of the operation or method of analysis. The authors interpret this as a means to scientifically justify the modification of our existing viable particle acceptance levels if we use a more sensitive method for environmental monitoring (i.e., one that provides higher viable counts as compared with the current or conventional method). Next, a number of regulatory representatives have recently approached this question both in print and during speaking engagements at international forums on rapid methods and pharmaceutical microbiology. For example, Brenda Uratani, Ph.D., consumer safety officer for the Center for Drug Evaluation and Research (CDER) at the FDA, provided guidance on modifying acceptance levels during her presentation at the 2007 PDA Global Pharmaceutical Microbiology Meeting (40). Uratani indicated that (i) the FDA expects higher counts will be recovered when using RMM technologies, especially if the methods are more sensitive than conventional methods; (ii) if a firm uses a RMM for air monitoring, the 1-cfu/m3 specification may be changed, because this was originally based on the less sensitive, agar-based method; and (iii) a GMP evaluation of the new method and the results (e.g., higher counts) must be driven by good science. Paul Hargreaves (technical manager, U.K. Medicines and Healthcare products Regulatory Agency) recently presented an overview of revisions to EU Annex 1 during the 2008 PDA/EMEA conference (41). During his discussion on continuous monitoring, Hargreaves stated that more excursions are found as all events are now being monitored, and that alert limits and out-of-trend limits may need to be revised when implementing continuous monitoring. Although these discussions did not focus solely on viable particle monitoring, Hargreaves did infer that the majority of the pharmaceutical industry has not introduced 21st century technologies for the counting of microorganisms, and that a future revision of EU Annex 1 may consider specific requirements in this area. Finally, in a publication on alternative microbiological methods and pharmaceutical quality control, Drs. Hussong and Mello (new drug microbiology staff, Office of Pharmaceutical Science, CDER, U.S. FDA) directly addressed the use of new microbiological methods, environmental monitoring, and changing acceptance levels (42):
Differences can also be expected when changing between air sampling systems. Since several environmental sampling methods exist, the “total count” method used should be the most sensitive, which means it would yield the greatest counts. Increased detection sensitivity will certainly improve microbial count data. This presents us with a dilemma. If data are to be compared over time, then test methods must remain the same, which is fundamental to trend analysis. However, to accelerate data collection, methods must change. Some changes will be insignificant (and test method validation may show no difference), and some will change data greatly. Often, new methods rely on a completely different body of information, some may be direct measurements, some indirect. In either event, previous acceptance criteria may not be applicable. Therefore, implementation of newly developed, or more rapid, microbiology methods may also require establishment of new acceptance criteria. Ultimately, trending of data may be lost in order to bridge the gap between “old” and “new” data analysis.
Based on what these global regulators have suggested, if the IMD-A detects a greater number of viable particles (compared with conventional, agar-based methods), and sufficient data will be generated to determine what the new baseline level is, a modification of the existing acceptance levels may be justified when the IMD-A is routinely used for active air monitoring. This strategy is further supported in USP Chapter 〈1116〉 with respect to the methodology and instrumentation for the quantification of viable airborne microorganisms (6):
It generally is accepted that estimation of the airborne microorganisms can be affected by instruments and procedures used to perform these assays. Therefore, where alternative methods or equipment is used, the general equivalence of the results obtained should be ascertained. Advances in technology in the future are expected to bring innovations that would offer greater precision and sensitivity than the current available methodology and may justify a change in the absolute numbers of organisms that are detected.
Transfer of Sterilized Components into the Filling Isolator
EU Annex 1 (4) indicates that the transfer of materials into and out of an isolator is one of the greatest potential sources of contamination, and the FDA Guidance for Industry (3) states that the ability to maintain integrity of a decontaminated isolator can be affected by the design of rapid transfer ports (RTPs). Various adaptations, of differing capabilities, allow for the transfer of supplies into and out of the isolator, and multiple material transfers are generally made during the processing of a batch. Therefore, properly maintained and operated RTPs are an effective transfer mechanism for aseptic transfer of materials into and out of isolators (3). Recovered particle counts for continuous air sampling during the transfer of sterilized components into the filling isolator are shown in Table V.
Transfer of Components into the Filling Isolator
During the manual transfer of components from the 8-glove isolator into the filling isolator, we detected one (1) ≥0.5-μm nonviable particle and no (zero) ≥5.0-μm nonviable or viable particles. During the manual transfer of components from the 3-glove isolator into the filling isolator, we did not detect any viable or nonviable particles for the duration of the sampling run. It is also interesting to note that during these studies, no particles were detected during the opening and closing of the RTP doors, suggesting that this activity may not adversely introduce particles into an isolator during routine operations.
Dynamic Monitoring during an Aseptic Fill
The FDA Guidance for Industry (3) recommends that measurements to confirm air cleanliness in critical areas be taken at sites where there is the most potential risk to the exposed sterilized product, containers, and closures. Additionally, the particle counting probe should be placed in an orientation demonstrated to obtain a meaningful sample, and air in the immediate proximity of exposed sterilized containers/closures and filling/closing operations would be of appropriate particle quality when it has a per-cubic-meter particle count of no more than 3520 in a size range of 0.5 μm and larger when counted at representative locations normally not more than 1 foot away from the work site, within the airflow, and during filling/closing operations. We chose to monitor key critical operational zones within the isolator during an aseptic fill, and designed an isokinetic probe for this purpose, taking into account isolator air flow velocity and the sampling flow in the IMD-A. The use of an isokinetic sample head is an EU requirement during the active air monitoring of a unidirectional airflow system (4).
During the continuous monitoring of the critical area immediately adjacent to the filling needle during our aseptic fill, we did not detect any viable particles and observed a very low level of nonviable particles over the entire sampling run (Table VI).
Monitoring Aseptic Filling
During this time, the vial stoppering station, vibrating stopper bowl, and the vial accumulation table were in operation. Following this run we relocated the isokinetic probe to the rear of the accumulation table, and while the filling line was in operation we opened the RTP door, transferred new vial cans from the 3-glove transfer isolator into the filling isolator, and closed the RTP door. During this sampling run we observed no viable or nonviable particles (Table VI). These results demonstrated that the IMD-A was capable of continuously monitoring an aseptic filling operation within our isolator.
Monitoring during Interventions
During aseptic processing, operational interventions may increase the risk of introducing viable or nonviable particles into critical areas and may lead to a compromised process and/or product. We engineered a number of interventions during our aseptic fill and continuously monitored these events using the IMD-A. Recovered particle counts during these studies are shown in Table VII.
Monitoring During Interventions
Monitoring the filling station during the replacement of both sterile and non-sterile filling needles yielded no detectable viable or nonviable particles. The fact that we found no viable particles during the non-sterile needle change-out was surprising; however, these results can only be interpreted as no airborne microorganisms being detected during this intervention, and can not address whether there were microorganisms on the surface of the non-sterile needle and/or the interior of the non-sterile pouch. Similar results were observed during the disassembly, movement, and reassembly of the vibrating stopper bowl, where no viable or ≥5.0-μm nonviable particle counts were observed, and only a single ≥0.5-μm nonviable particle was detected. However, the IMD-A detected two (2) viable particles during the course of the 45-min sampling run when we monitored the manual disruption and repositioning of glass vials on the accumulation table. A subsequent review of the raw data and video archive (data not shown) demonstrated that the two viable particles were approximately 0.5 μm in size and were detected 25 min apart from each other. Although we were unable to attribute these results to a specific activity or event, such as tipping over or repositioning vials, adding new vials to the accumulation table, or starting and stopping the line, we could use the IMD-A to assist in a more detailed investigation into the source of these types of viable particles if they are observed during the set-up of a new isolator filling line or during the routine monitoring of an existing line.
Monitoring Isolator Exit Ports:
Recovered particle counts for the continuous monitoring of the vial discharge chute and the simulated mousehole are shown in Table VIII.
Monitoring of Vial Discharge Chute and Simulated Mouse Hole
During the manual transfer of three filled vials into the vial discharge chute, no viable or nonviable particles were detected by the IMD-A. Similarly, no particles were detected when the IMD-A sample tube was inserted into the discharge chute. These results demonstrated that there was sufficient positive air pressure (0.25 inches of water) inside the filling isolator that prevented the ingress of uncontrolled room air into the vial discharge chute. Similar results were observed when the IMD-A monitored the simulated mousehole when the isokinetic probe was located inside the isolator and at the isolator–room interface. However, when the probe was extended beyond the isolator–room interface, the IMD-A instantaneously detected and enumerated both viable and nonviable particles (ranging from 0.5–10 μm in size; data not shown) originating from the surrounding room. The final data acquisition screen showing the particle counts before and after the probe was extended into the room is shown in Figure 32. Although the simulated mousehole may not accurately reflect actual mousehole designs used in production isolators, and eddy currents or wave trains may have been artificially created when the probe was extended into the surrounding room, the results clearly demonstrate the ability of the IMD-A to immediately detect viable particles that might enter an isolator environment in the event of a catastrophic loss of isolator integrity and/or loss of positive pressure at an exit port or similar opening.

Data acquisition during simulated mousehole testing. There were no detectable viable or nonviable particles while the probe was sampling air at the isolator–room interface (flat line). Viable and nonviable particles were immediately detected when the isokinetic probe was extended into the room.
The FDA Guidance for Industry (3) states that air quality should be monitored periodically during each shift, and that it is recommended to monitor exit ports for particles to detect unusual events. In the current study, the IMD-A was used to monitor two types of open portals and demonstrated the applicability of this technology to immediately detect viable and nonviable particles as a result of a loss of isolator integrity or pressurization. The FDA further states that isolators that include an open portal should be designed to ensure complete physical separation from the external environment, and that a positive air pressure differential adequate to achieve this separation should be employed (e.g., 17.5 to 50 Pascals). Additionally, the Pharmaceutical Inspection Convention and Pharmaceutical Inspection Co-operation Scheme (PIC/S) guidance document recommends that a minimum of 10 Pascals positive differential air pressure be maintained to protect against unforeseen circumstances (1). During the current studies, the filling isolator positive pressure was maintained at 0.25 inches of water, or 62 Pascals, which was adequate for preventing particles from entering the isolator from the surrounding room environment.
Monitoring Glove Integrity:
For a number of years, the industry has established rigorous glove integrity testing strategies because glove defects, such as a pinhole or tear, may provide an increased risk of introducing viable particles into the isolator environment. The FDA Guidance for Industry (3) states that a faulty glove or sleeve (gauntlet) assembly represents a route of contamination and a critical breach of isolator integrity, and that the monitoring and maintenance program should identify and eliminate any glove lacking integrity and minimize the possibility of placing a sterile product at risk. Due to the potential for microbial migration through microscopic holes in gloves and the lack of a highly sensitive glove integrity test, the FDA also recommends paying attention to the sanitary quality of the inner surface of the installed glove and to integrating the use of a second pair of thin gloves (3). For these same reasons, EU Annex 1 (4) states that there should be frequent leak testing of the isolator and glove/sleeve system, and the PIC/S document (1) recommends operator vigilance, the avoidance of sharp edges, and an all-encompassing preventative maintenance program that includes the examination and preemptive replacements for gloves, sleeves, and suits. The ability of the IMD-A to detect viable and nonviable particles through known defects in gloves, including pinholes and cut fingertips, was evaluated. Recovered particle counts for the continuous monitoring of glove integrity testing are shown in Table IX.
Monitoring of Glove Integrity
An initial assessment of glove integrity testing included the use of the IMD-A to detect whether viable and nonviable particles were able to pass through 75–100-μm and 200–250-μm pinholes under a variety of operating conditions. For each pinhole size range, the isolator environment was monitored when each pinhole was held directly above the sampling tube, when a hand wearing a sanitized latex glove was inserted into the Hypalon glove and the fingers flexed, when a bare hand was inserted into the Hypalon glove and the fingers flexed, and when a negative pressure was created while the pinhole was held directly over the sampling tube (with a bare hand inserted). Each of these activities was executed in sequence during a continuous sampling run. Data from the 75–100-μm glove pinhole study showed no viable particles or ≥5.0 μm nonviable particles being detected, and only seven ≥0.5-μm nonviable particles were observed (the latter particle counts were random events within the sampling run). During the continuous monitoring of a glove with a 200–250-μm glove pinhole, no viable or nonviable particles were detected. These data suggest that gloves containing pinholes may not readily allow particles to pass from an uncontrolled area into an isolator environment, especially when the isolator is operating under positive pressure. In this case, the presence of pinholes may not present a significant microbiological risk for product quality as previously thought, and as a result, a change in the frequency by which gloves are tested could be scientifically justified. Furthermore, if the IMD-A technology is used during the entire length of a manufacturing campaign and a pinhole is discovered at the end of the run, the environmental monitoring data may justify release of the batch without fear of an increased risk to the product or patient.
This study represents the first time an optical spectroscopic technology has been used to continuously, and instantaneously, assesses the impact of glove defects on isolator integrity; however, other investigators have performed integrity testing using standardized microbial cultures. For example, a study by Sigwarth et al. (43) observed similar results when using a suspension of microorganisms to challenge Hypalon gloves with known defects. They concluded that a realistic bioload (50 cfu/cm2) deposited on fingertips with holes (similar in size to what was used during the studies presented in this paper) did not present an increased risk of contamination within an isolator environment. Although the Sigwarth study required a 7-day incubation period before the microbiological data was available, their conclusions support the findings obtained in real time using the IMD-A in this paper.
During the next phase of our testing, a series of studies were designed that were expected to result in the detection of a large number of viable and nonviable particles from the surrounding environment and exposed skin. First, a one-half inch section of glove material was removed from a fingertip and the air was monitored while the cut fingertip was held directly over the IMD-A sampling tube. Low levels of nonviable particles were detected when a sanitized latex gloved-hand was inserted into the Hypalon glove (Figure 33), and no additional particles were detected when the exposed latex glove fingertip was flexed, when the latex gloved-hand was removed, or when a bare finger was inserted into the Hypalon glove and the exposed finger held over the sampling tube (Figure 34). However, when the bare finger was flexed, the IMD-A immediately detected a single viable particle (Figure 35). Lastly, a negative pressure (0.2 inches of water) was applied to the isolator enclosure while the bare finger was held directly over the sampling tube, and only two nonviable particles ≥5.0 μm in size were detected during this time (Figure 35).

Data acquisition during cut fingertip testing.

Data acquisition during cut fingertip testing.

Data acquisition during cut fingertip testing.
Immediately following this experiment, the operator cut off all glove fingers, reinserted his bare hand, and flexed his fingers over the sampling tube while the IMD-A continuously monitored the air. Nine nonviable particles between 0.5 and 3.0 μm in size were detected. As a final test, the operator completely removed the Hypalon glove from the gauntlet, inserted his hand into the isolator, moved his hand over the sampling tube, and grasped the tip of the sampling tube. Only six nonviable particles between 0.5 and 5.0 μm in size were detected. One might expect to detect a much greater number of both viable and nonviable particles during these activities. In fact, it has been previously estimated that 3.9 × 10⁴ to 4.6 × 10⁶ bacteria are normally found on the hands of medical staff (44). Although the bioburden level on the operator's hands was not assessed prior to the start of this study, one can assume that (a) there were very low levels of microorganisms on the operator's skin, (b) microorganisms that may have been present on the operator's skin were not being transferred into the isolator environment and subsequently into the IMD-A sampling tube, and/or (c) microorganisms were present and released into the isolator; however, the isolator air exchange rate was effective in removing the airborne contaminants before they had an opportunity to enter the IMD-A sampling tube and be detected by the instrument. Therefore, to encourage the introduction of a large amount of airborne microorganisms into the isolator during this experiment, we asked the operator to remove his hand from the gauntlet, rub his fingers on his mustache, and reintroduce his hand into the isolator. When the operator moved his fingers over the IMD-A sampling tube, viable and nonviable particles of various sizes were released and immediately detected (Figure 36).

Data acquisition during the monitoring of an exposed hand.
Obviously, the practice of removing an isolator glove and introducing a bare hand into an aseptic area should never occur under normal operating conditions. However, this scenario was used to demonstrate that the IMD-A can rapidly detect viable particles from a human source if they gain entrance into an isolator environment. In actual use, the ability of the IMD-A to detect viable particles (inside an isolator) arising from an operator or from the surrounding room air may depend on a number of physical factors associated with the isolator operating characteristics, including positive pressure, air flow velocity, air changes, HEPA filtration, and fluid dynamics. For this reason, a separate evaluation of IMD-A performance may be warranted for each isolator that is to be monitored.
Summary
Sterile drug products are required to be free of microorganisms, and while a loss of sterility assurance can result in harm to the patient, the likelihood of detecting a sterility failure is low. Therefore, risk in sterile product manufacturing, especially aseptic processing, is relatively high when compared with other pharmaceutical processes, making risk management particularly important. PDA Technical Report #44, Quality Risk Management for Aseptic Processes, provides clarity on this subject (45):
Aseptic processing involves protecting the exposed product and product contact surfaces from microbial contamination, usually originating from personnel, surfaces or the processing environment. Conditions that could adversely affect sterility are not as well defined in measurable metrics and are not easily monitored or controlled. If sterility failures do occur, the ability to detect contamination is limited because of the lack of sensitivity of sampling and testing methodologies. Therefore, the outcome of aseptic processing is less predictable and inherently has more risk. Understanding and managing the conditions and risks associated with aseptic processing are essential for making appropriate decisions and assuring product quality.
Similarly, the FDA Final Report for Pharmaceutical cGMPs for the 21st Century—A Risk-Based Approach (46) states that using a scientific framework to find ways of mitigating risk while facilitating continuous improvement and innovation in pharmaceutical manufacturing is a key public health objective, and that a new risk-based pharmaceutical quality assessment system will encourage the implementation of new technologies, such as process analytical technology (PAT), to facilitate continuous manufacturing improvements via implementation of an effective quality system. From a microbiology perspective, one can apply Quality Risk Management principles in order to design a process to prevent contamination, investigate ways to correct a contamination problem, and assess the potential impact of failing results on the patient (47).
In a time when the pharmaceutical industry continues to rely on single-point measurements and century-old methods for the detection of microorganisms, the introduction of a real-time microbiology solution for environmental monitoring is long overdue. Today, there are significant limitations for the use of conventional microbiological methods for environmental monitoring in an isolator, including the fertility of media, the effect of exposure of agar plates to the decontamination process, and accidental contamination of plates due to handling (1). Additionally, environmental monitoring methods do not always recover microorganisms present in the sampled area, and low-level contamination can be particularly difficult to detect (3). Hussong and Mello (42) provided a critical assessment of the current state of environmental monitoring when they stated that too many laboratories use conventional methods and base important decisions on insignificant data. This is particularly evident when methods such as plate counts producing fewer than 10 colonies are used as acceptance or rejection criteria. The authors also argue that the current methods for monitoring cleanrooms employ acceptance criteria that are below plausible quantitative ranges. From a microbiological perspective, this is understandable given the fact that the inherent variability in traditional methods limits their ability to effectively detect low levels of microorganisms. Akers has simplified this point of view, stating that there may not actually be a difference between a zero and a one (48).
Finally, a recent paper by Katayama et al. (49) recommended that aseptic processing facilities should employ a new set of aseptic criteria (to assure sterile product manufacturing) instead of using traditional, media-based microbiological test methods, which are considered insufficient in extremely clean areas due to low microorganism detection and inherent variability in the number of cfu recovered. In a study using risk scores to categorize existing aseptic facilities, these authors suggested that processes may not benefit from traditional microbiological analysis. Furthermore, they state that this type of risk assessment may eventually lead to abandoning inefficient traditional media-based tests in advanced facilities (such as isolators and RABS) and promoting the introduction and improvement of a new set of aseptic risk detecting systems that may include improved microbiological tests.
For these reasons, the industry should look toward the introduction of a more sensitive, real-time, and continuous environmental monitoring technology with the ability to track and trend an increased incidence of microbial contamination over a period of time. The current studies have demonstrated that the BioVigilant IMD-A is capable of fulfilling these requirements, in addition to simultaneously detecting, sizing, and enumerating both viable and nonviable particles in a variety of filling and transfer isolator environments during an aseptic fill and planned interventions. Furthermore, the IMD-A has been shown to be a potentially powerful and effective tool to better understand the impact of a filling intervention at the time the intervention occurs, or to detect the incursion of viable particles into an isolator environment as a result of the loss of aseptic integrity through transfer ports, mouseholes, and glove defects. In this instance, an operator may be able to immediately respond to excursions; this is not possible using conventional, growth-based methods today. The potential utilization of this technology goes beyond what we have presented in this paper. For example, the IMD-A can play an even greater role in monitoring conventional cleanrooms, where the potential for microbial contamination from operators and/or human interventions is greater than in an isolator environment. Next, the IMD-A could be used to confirm the state of microbial control in an isolator or cleanroom environment just prior to the start of a fill or a sterility test, or to confirm the absence of airborne microorganisms following a contamination remediation event. From a training perspective, the technology may provide a data-rich understanding of personnel aseptic techniques during gowning activities and media fills. The IMD-A could also be used to establish baseline viable and nonviable particle counts before and after facility shut-down activities, during the construction of a new facility, or to support the lengthening of campaign times in an existing operation. Finally, the use of a continuous and real-time environmental monitoring platform, coupled with real-time, in-process bioburden or sterility testing capabilities, may allow us to move toward the ultimate goal of parametric release for aseptically filled product.
In 2006 Tidswell and McGarvey (33) predicted that real-time cleanroom environmental monitoring will become a reality within five years, providing the opportunity for continuous, swift (within minutes or seconds) enumeration of microorganisms within the manufacturing environment. Their prediction has been fulfilled. To seize full advantage of rapid environmental microbial monitoring, the authors also recommended using the data immediately to make informed decisions regarding the quality of manufactured product. This is aligned with the position of Dr. Brenda Uratani (CDER, FDA) who recently described the benefits of using rapid microbiological methods within the industry (40). These included automating the testing process, electronic capture of test data and information creation, the ability to initiate investigations earlier as compared with conventional methods, the reduction of risk associated with microbial contamination, and the use of the data as a continuum for process improvement. The implementation of the next generation of rapid methods (including the IMD-A) represents significant progress toward the acceptance of microbiological PAT solutions for the industry, and is directly aligned with the expectations for pharmaceutical manufacturing, quality, and operational excellence in the 21st century.
Footnotes
- © PDA, Inc. 2009


