
Abstract
Parallelism is a prerequisite for the determination of relative potency in bioactivity assays. It involves the testing of similarity between a pair of dose-response curves of reference standard and test sample. The evaluation of parallelism is a requirement listed by both the United States Pharmacopeia (USP) and European Pharmacopeia (EP). The revised USP Chapters 〈1032〉 and 〈1034〉 suggest testing parallelism using an equivalence method. However, implementation of this method can be challenging for laboratories that lack experience in statistical analysis and software development. In this paper we present a customized assay analysis template that is developed based on a fully good manufacturing practice (GMP)-compliant software package. The template allows for automation of the USP-recommended equivalence parallelism testing method for 4PLmodel in bioassays. It makes the implementation of the USP guidance both practical and feasible. Use of the analysis template is illustrated through a practical example.
LAY ABSTRACT: Parallelism is a prerequisite for the determination of relative potency in bioactivity assays. It involves the testing of similarity between a pair of dose-response curves of reference standard and test sample. The evaluation of parallelism is a requirement listed by both the United States Pharmacopeia (USP) and European Pharmacopeia (EP). The revised USP Chapters 〈1032〉 and 〈1034〉 suggest testing parallelism using an equivalence method. However, implementation of this method can be challenging for laboratories that lack experience in statistical analysis and software development. In this paper we present a customized assay analysis template that is developed based on a fully good manufacturing practice (GMP)-compliant software package. The template allows for automation of the USP-recommended equivalence parallelism testing method for 4-parameter logistic model in bioassays. It makes the implementation of the USP guidance both practical and feasible. Use of the analysis template is illustrated through a practical example.
Introduction
Potency is the specific ability or capacity of the product to affect a given result. The potency of a biological therapeutic is often determined relative to a reference standard, such as via the ratio of EC50 values. Measurement of relative potency is only meaningful if the test sample behaves as a dilution or concentration of the reference standard, and exhibits a parallel relationship to the reference standard. Such similarity is called parallelism. Graphically, parallelism is observed where the dose-response curve of the sample is a horizontal shift of that of the reference standard on the logarithmic dose axis. The amount of shift represents the logarithm of relative potency (1). As a necessary sample acceptance criterion for bioassays, there is a need to assess parallelism before the results of a bioassay are interpreted. The requirement for the evaluation of parallelism appears in both the United States Pharmacopeia (USP) (1, 2) and European Pharmacopeia (EP) (3).
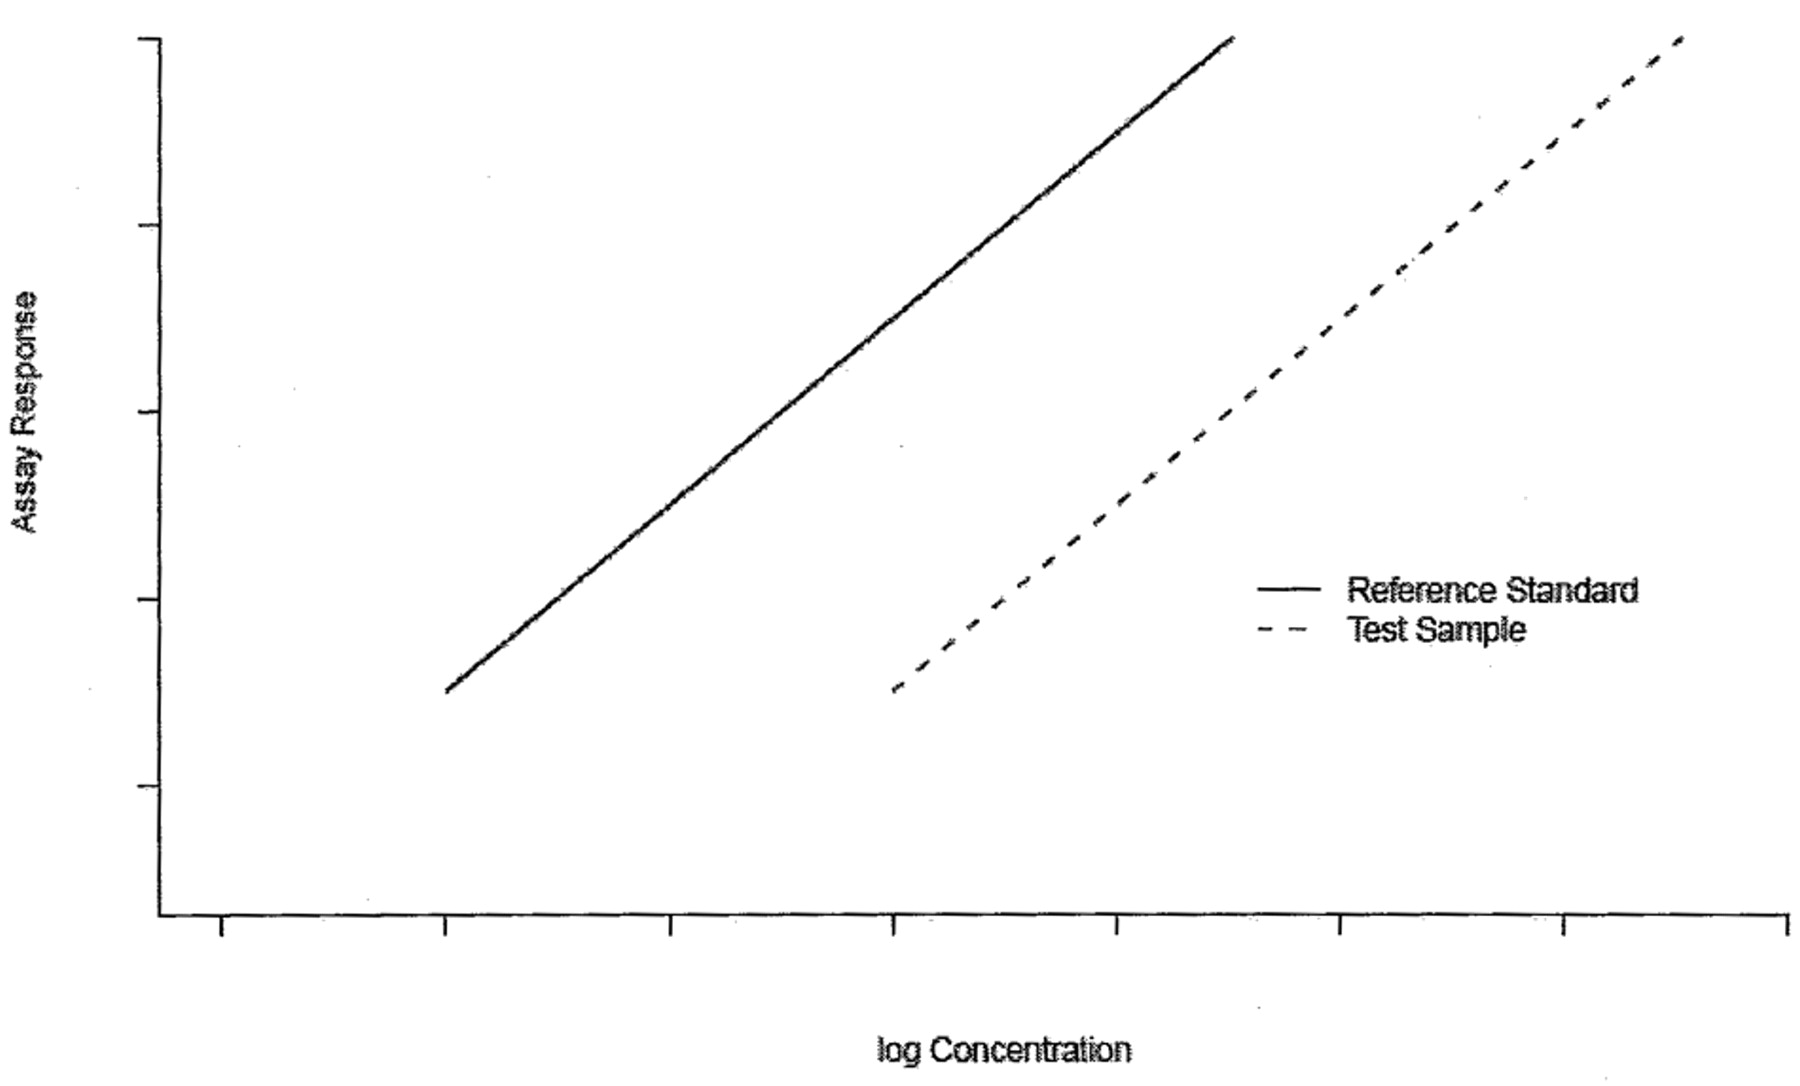
Traditionally parallelism test methods are intended for testing the hypothesis of equal parameters between the two dose-response curves. We will refer these methods as difference test. When the dose-response data are described through a linear model, parallelism implies equal slopes (4) as displayed in Figure 1.

Parallel-line model.
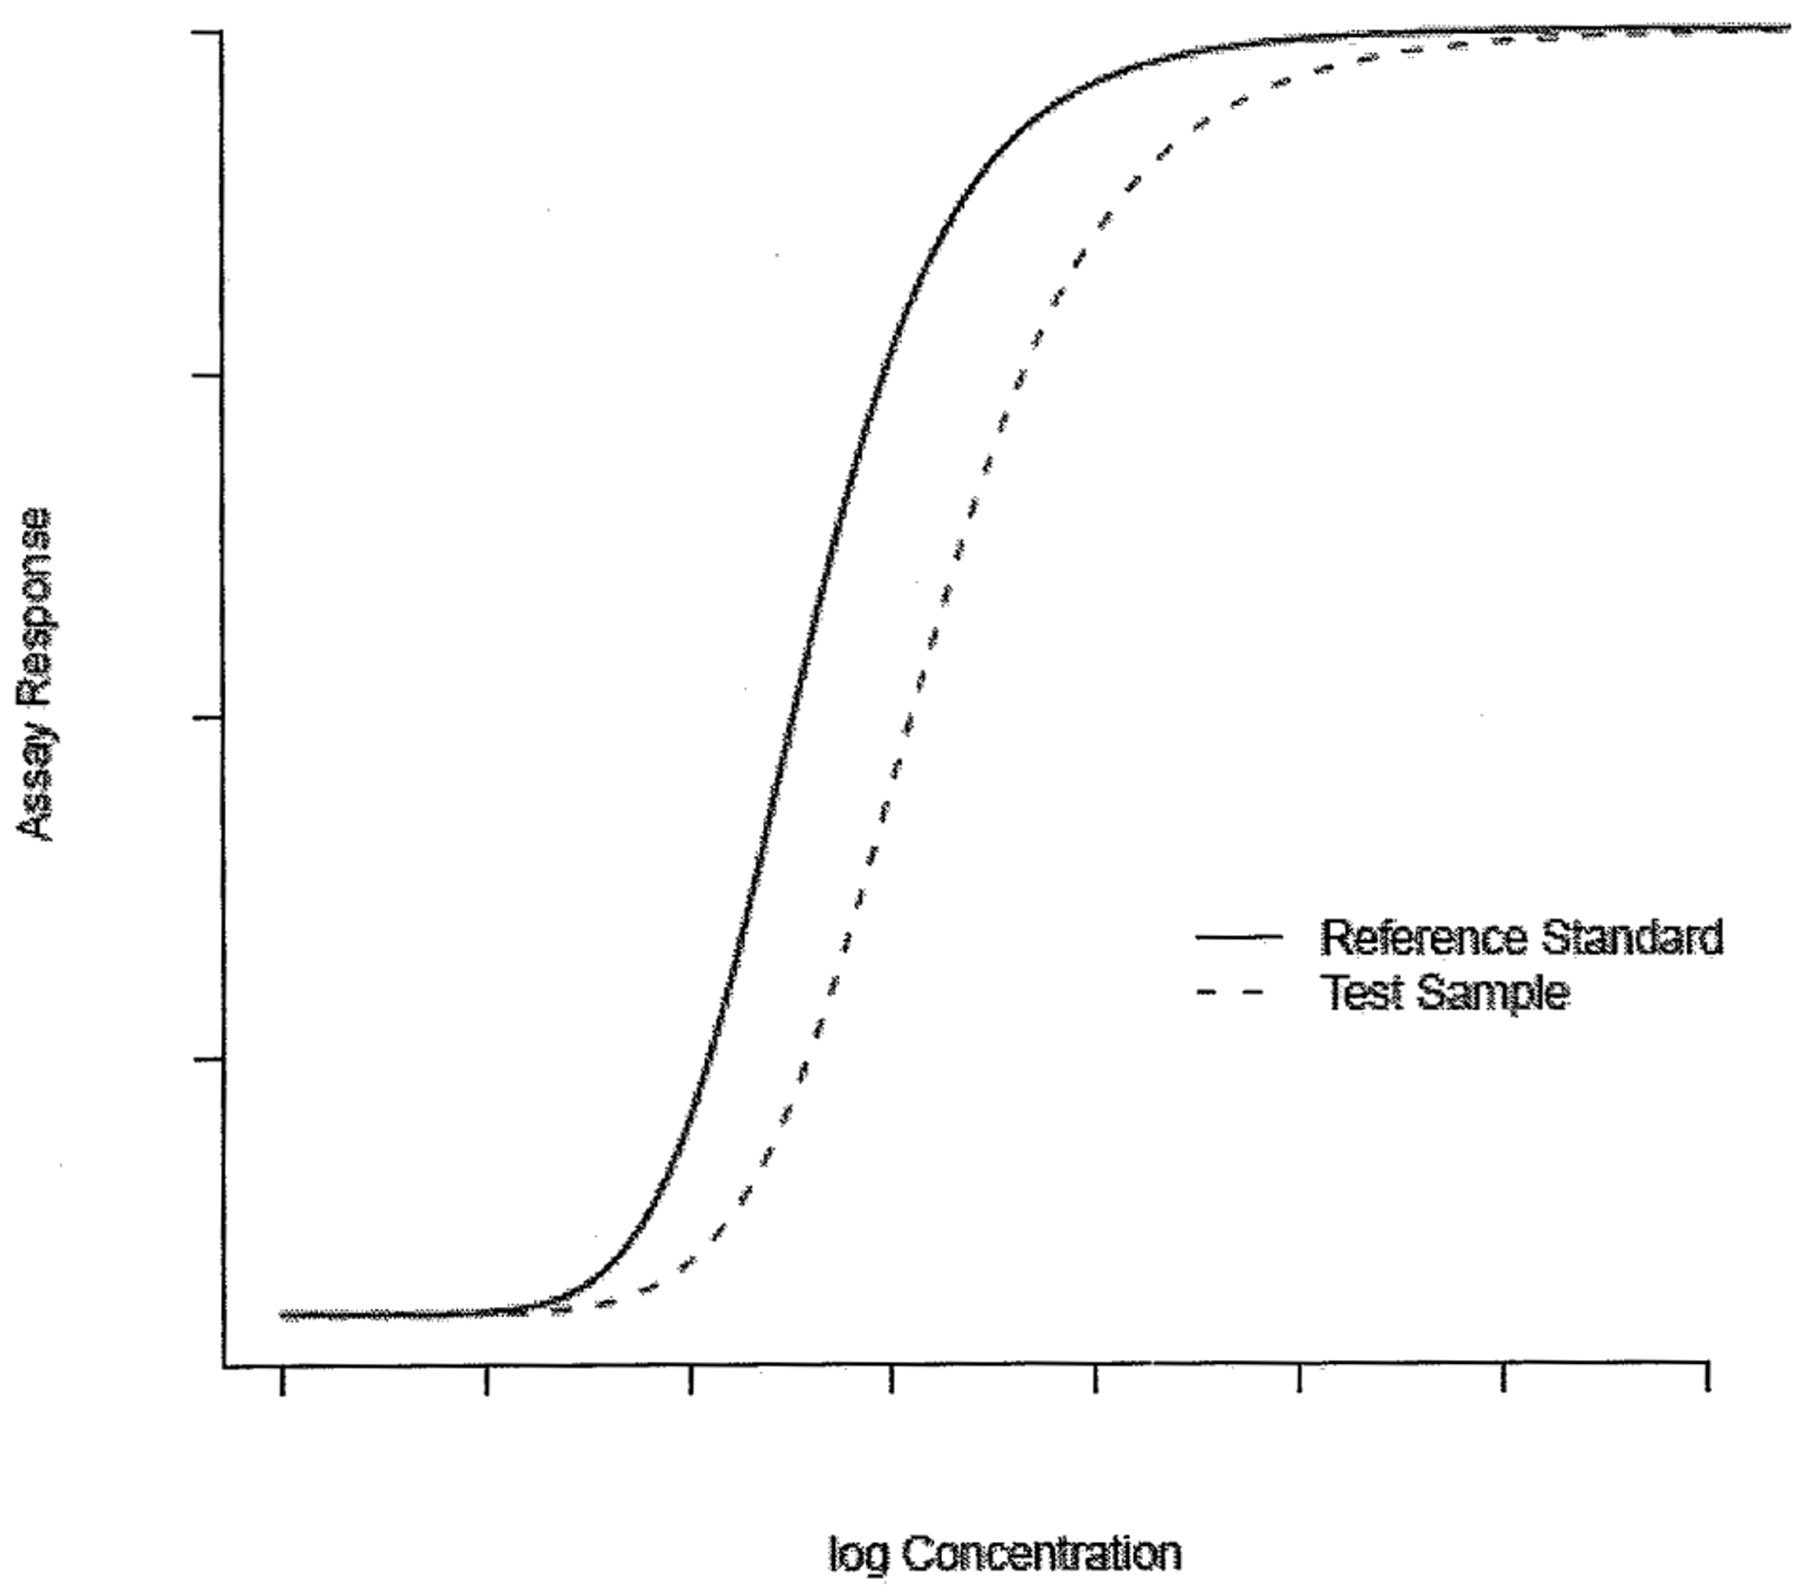
The hypothesis of equal slope is tested using a t-test. The parallelism claim is rejected if the test statistic results in a P-value less than or equal to a predetermined level, commonly 0.05. Where the dose-response curve of a bioassay demonstrates non-linear characteristics over an extended dose range, response data is generally modeled through a non-linear model, as shown in Figure 2. Typically, the 4-parameter logistic (4PL) function is adequate to describe the non-linear response curve of a bioassay (5⇓⇓–8). In this paper, we concentrate our tool development on the 4PL model though it can be generalized to other types of non-linear models, including the 5-parameter logistic model (9, 10).

Non-linear model.
In the literature, a commonly used approach for parallelism testing of 4PL curves involves testing the hypothesis of equal lower and upper asymptotes and slopes. To that end, either an F or χ2 test statistic is used (5, 8). Lack of statistical significance at a pre-selected level is viewed as indicative of parallelism. Recently several researchers have argued that the significant test is fundamentally flawed; they have noted that an increase in either sample size or precision of an assay may result in more frequent rejection of parallel lines that have a trivial difference in slopes (4, 11). They argue that this does not make scientific sense because it penalizes assays with smaller variability or larger sample sizes. They also point out that obvious non-parallel curves may pass the parallelism test due to poor assay precision. As a remedy, it is suggested that parallelism testing be reformulated as testing the hypothesis of equivalence. For the linear case, the hypothesis of interest is that slopes of reference standard and test sample differ by an amount no greater than d, an equivalence limit of no practical significance. This approach is operationally equivalent to the 90% confidence interval (CI) of the slope difference being enclosed within the interval (−d, d) (12). The 90% CI is constructed based on fitting linear regression models to reference and test sample data. The equivalence method was extended to the 4PL case by Jonkman and Sidik (8) based on an intersection union test (13). The currently revised USP Chapters 〈1032〉 and 〈1034〉 formally recommend using an equivalence method to establish parallelism for bioassays. The difference test is deemed inappropriate for parallelism testing.
In a typical bioanalytical laboratory, where there may be no statistician readily accessible, analysts often rely on instruments with built-in software to perform data analysis. The difference test is widely available in such software packages. However, parallelism testing based on the equivalence approach is a more complex process, requiring construction of CIs using parameter estimates from model fitting. This makes it challenging for many testing laboratories to be USP-compliant. Using SoftMax Pro 5 (SMPv5), a software package widely used for bioassay data analysis, we have developed an analysis template that performs the USP-recommended equivalence test. The test is developed as a customized data analysis template wholly embedded in a fully GMP-compliant software package, providing the flexibility to perform equivalence-based parallelism testing while maintaining GMP compliance. The use of the template is illustrated using a practical example. Our case study demonstrates that the USP-recommended equivalence approach for parallelism testing can be implemented in a simple, quality control (QC)-friendly, compliant, and validatable manner. It addresses one of the major difficulties in implementing the USP recommendation concerning parallelism testing (14).
Four-Parameter Logistic Model
The parallelism analysis template is developed for bioassays with dose-response data that can be described through a 4PL model:
 where yij is the measure at log dose or concentration xj of a preparation, and εij is the measurement error following N(0, σ2), with i = 1 and 2 corresponding to the test sample and standard reference preparations, respectively, j = 1, … , n, and σ is the assay variability. Under the parameterization of model 1, ai and di are the upper and lower asymptotes, respectively, bi is Hill slopes and ci is inflection point where curvature changes direction. The parameter ci, often referred to as EC50, is the dose corresponding to a mean response midway between the lower and upper asymptotes. The method by Jonkman and Sidik (8) tests equivalence of the lower, upper, and Hill slope, based on an intersection union test between a test sample and reference standard. In the development of the parallelism analysis template, we reparameterize (ai, bi, di) as (ai, fi, si) with fi = di − ai and si = −(di − ai)bi/4, respectively. Such reparameterization has two advantages. First of all, it offsets potentially large variability in the ratio estimate of lower asymptotes between the test sample and reference standard, as the lower asymptotes tend to be close to zero. Secondly, si represents the slope of the dose-response curve at EC50. It makes both intuitive and practical sense to test equivalence in slope between two response curves as opposed to bi, which is a factor of slope. In practice, fi, the difference between lower and upper asymptotes, is often referred to as the effective window. Let r1 = a1/a2, r2 = f1/f2, and r3 = s1/s2 be the ratios of upper asymptote, effective window and slope at EC50, respectively. The dose-response curves of the test sample and standard reference are deemed to be parallel if the following null hypothesis H0 is rejected in favor of the alternative hypothesis H1:
 versus
 where DLk and DUk are equivalence limits k = 1, 2, 3. If DLk = 1/DUk, the limits are geometrically symmetric about one. Some researchers suggest using DLk = 0.8 and DUk = 1.25 for bioequivalence test as the limits (8) and others suggest establishing provisional limits based on testing reference standard against itself. These limits can be modified as we learn more about both the assay and product (4). In our development of the analysis template, we adopt a non-parametric method proposed by Hauck et al. (4) to establish the equivalence limits. The discussion of this approach is deferred to a later section.
Intersection-Union Test
The null hypothesis in hypothesis 2 is a union of six sub-hypotheses concerning the three ratios of the 4PL model, and the alternative is an intersection of six hypotheses. In this paper, we propose testing the hypotheses in hypothesis 2, using an intersection-union test (IUT) similar to what is described by Jonkman and Sidik (8). The test consists of six one-sided tests of the three ratios in hypothesis 2, each rejecting the component hypotheses in hypothesis 2 at a significance level of α. Overall the test results in a significance level no more than α. This property of IUT is fully discussed in Berger (15), Casella and Berger (16), and Berger and Hsu (13). Similar to the linear case, this approach is operationally equivalent to the (1 − 2α)100% CI of ri being fully contained within the interval (DLk, DUk), k = 1, 2, 3. Here, for simplicity, we do not consider correlation among rk. The confidence intervals are constructed based on estimates of the model parameters and their associated errors. Let θ = (a1, b1, c1, d1, a2, b2, c2, d2). We let θ^ = (â1, b^1, c^1, d^1, â2, b^2, c^2, d^2) denote the estimate of θ from fitting model 1, and Σ^(θ) the estimated associated variance-covariance matrix of θ. Then rk, as a function of θ, can be denoted as rk = gk(θ). Let g′k(θ) = ∂gk(θ)/∂θ be the partial derivative of rk with respect to the model parameters θ. Then r^k = gk(θ^) is an estimate of rk with the variance of r^k being estimated by
 where z1−α is the upper (100α)% critical value of the standard normal distribution. The null hypothesis in hypothesis 2 is rejected if the interval in eq 4 is contained in (DLk, DUk) for k = 1, 2, 3. As an illustration, we demonstrate how to construct the (1 − 2α)100% confidence interval for r1. The partial derivative of r1 is
 Thus
Thus
 The (1 − 2α)100% CI is obtained as
 with
with
Determination of Equivalence Limits
Unlike the significant test that seeks to support no difference claim by failure to find statistical difference, the equivalence method is oriented to demonstration that the two sets of parameters are equivalent for a specified difference that is of no practical consequence. To perform parallelism testing using the equivalence test, we need to select a priori the equivalence limits. Ideally the equivalence limits should be based on the impact of non-parallelism on the quality of product. However, as pointed out by Hauck et al. (4), this is not a trivial task because not all important product quality issues may be reflected in a parallelism measure, and not all differences in parallelism are necessarily indicative of an important quality issue. Because sufficient data for setting the equivalence bounds may not be available, Hauck et al. (4) suggest using capability-based approaches based on repeated testing of reference standard against itself to set provisional limits, and revise them as more information about the assay and product is gained. However, as noted by Liao et al. (18), the capability-based limits only control false rejection rate of parallelism or producer's risk, and renders little control over false acceptance of non-parallelism or consumer's risk. As a remedy, they develop a method that balances both types of risk. Two non-parametric tolerance interval methods are discussed for setting the equivalence limits (4). The first approach determines the equivalence limits based on ranked data. In general, let X1 … Xn be a random sample of ratios with size n and X(1) … X(n) be the ranked values. Let
 where r and m are two integers less than n so chosen as to produce desirable level of coverage of the population, and x2(r+m)(1 − α) is the (1 − α) percentile of a chi-squared distribution of 2(r + m) degrees of freedom. With probability at least (1 − α), the tolerance limits X(r) and X(n+1−m) covers 100q% of the population (19). When n = 48, r = m = 2 correspond to the case where the second smallest and largest values are chosen as the tolerance limits, respectively. Setting α = 10%, we obtain q = 87%. The second method takes into account the precision with which each ratio is generated. It involves constructing a one-sided tolerance limit for the upper confidence limits of the ratios. The second largest value of the confidence limits is chosen as the upper equivalence limit. The reciprocal of this value is used as the lower equivalence limit. These two limits provide the same coverage of the content as the first method with higher level of confidence. In the template that we develop, we used the second method to construct equivalence limits, and these equivalence limits serve as input parameters to the template.
The methods described above provide protection against the producer's risk, in the sense that when the response curves of the sample and reference are parallel, they will have a high chance of passing parallelism testing. However, they offer little control over the probability of failing non-parallel samples. A method that accounts for both consumer's and producer's risks in determining the equivalence limits has been proposed by Yang and Zhang (20). However, detailed discussions of the method are beyond the scope of this paper, which is centered on automation of the parallelism testing method recommended in revised USP Chapters 〈1032〉 and 〈1034〉.
Parallelism Analysis Template
SMP v5 is a commercially available software package that is designed to control molecular device plate readers that measure the signals generated in the wells of assay plates. The software provides readings of kinetic and endpoint responses of test sample and reference standard from microplate assays, fits 4PL models to the response curves, and can be programmed to estimate relative potency in terms of EC50 ratio between the reference standard and test sample. It also affords a utility that allows the end-user to program built-in algorithms to perform customized analyses such as parallelism testing. The model parameters are estimated in SMP v5, using maximum likelihood estimators. Both variance and covariance of the model parameter estimates can be derived from its output. Using the scripting function of the software, we are able to extract these estimates, and construct an approximate 90% confidence interval for each of the three ratios, using the method described previously. The IUT is performed, and parallelism or non-parallelism is claimed, checking the CIs against the input equivalence limits. The entire parallelism test has been automated. Forty-eight paired samples from reference materials were used to determine the equivalence limits as discussed previously. Forty-eight 90% upper confidence limits were calculated, and the second largest values were used as the upper equivalence limits, and their reciprocals were used as the lower equivalence limits.
As an illustration, we briefly discuss how to implement equivalence parallelism testing in our template. The equivalence limits were determined using historical data and stored in the template as input parameters. Conditional clauses are programmed in the template that check if the 90% CI for each ratio falls within the corresponding equivalence bound. If these are all true, then the two curves are parallel and the relative potency is calculated and output. Otherwise, the two curves are not parallel and the relative potency is not calculated.
After an assay is performed per the method standard operating procedure, the software captures the luminescence readout and fits the 4PL model. The template does the parallelism test. All the raw data of concentration and response, model fitting parameters, equivalence test result for each ratio, and the final relative potency are output to a .pdf document. Therefore, equivalence parallelism testing is incorporated in the assay analysis and is fully automated. The end-user only needs to run the assay and obtain the analysis results, including model fitting, parallelism testing, and relative potency, from the software package output.
Parallelism Testing Assessment with Known Inactive Product Variant
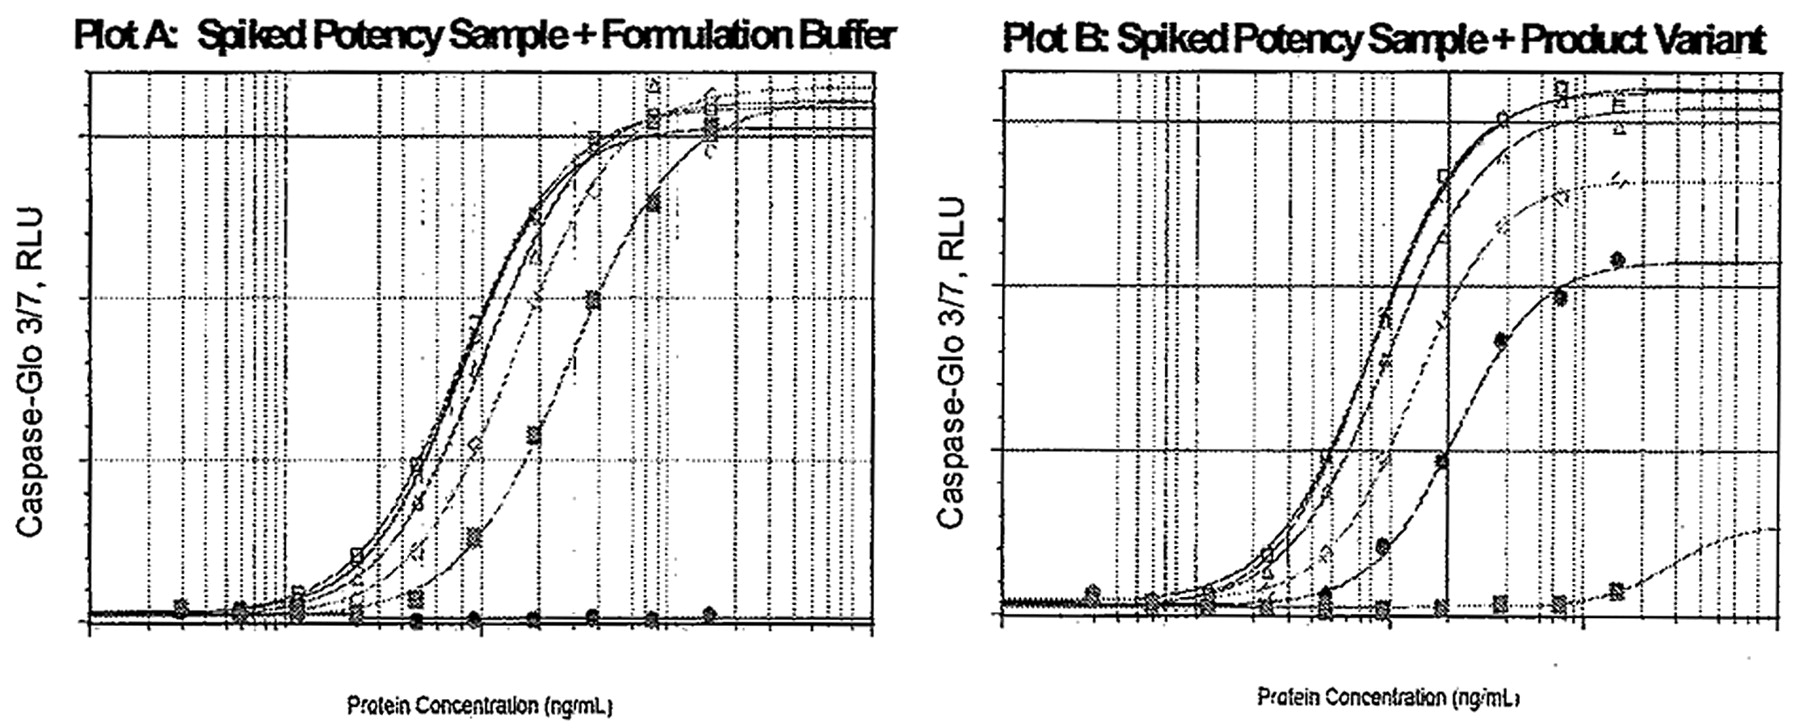
In our case study, a spiking study was performed using an inactive product variant (PV) that is capable of altering the product dose-response kinetics. Product (PD) samples with the expected relative potencies of 100%, 75%, 50%, and 25% were used for this spiking study. The product variant known to compete with the product and inhibit its bioactivity in the bioassay was spiked, volume per volume, to give rise to four simulated samples of the mixtures of 75% PD + 25% PV, 50% PD + 50% PV, 25% PD + 75% PV, and 0% PD + 100% PV per sample. Each of the four spiked sample was then tested in triplicate along with a reference standard, resulting in n = 12 assays. Also tested in triplicate were four PD samples of expected potencies at 100%, 75%, 50%, and 25%, producing n = 12 assays. The impact of PV on bioactivities and parallelism parameters was examined in comparison with the corresponding PD samples in the absence of PV (Figure 3). Unspiked samples were able to show similar full dose-responses kinetics, and each sample curve behaved as a dilution/concentration of the assay reference shown on Plot A. In contrast, PV-spiked samples failed to achieve the kinetic potential of the fully active product. The upper asymptotes failed to reach maximum bioactivity, causing failure to meet the parallelism criteria for some test samples shown in Plot B. For each of the 24 runs of the experiment, the parallelism between test sample and standard reference was assessed, using the tool. The results are summarized in Table I.

Impact of PD and PV on bioactivity is demonstrated in Plots A and B, respectively.
Case Study Parallelism Analysis Summary Table
As seen from Table I, when there is no product variant in the 100%, 75%, 50% and 25% simulated potency samples, the parallelism criteria were met in 11 out of 12 tested samples, representing the expected result 91.7% of the time. The 25% simulated potency sample failed the parallelism criteria in one test, possibly due to its being outside of the qualified assay range. By contrast, non-parallelism was demonstrated in 10 out of 12 cases in samples spiked with 25%, 50%, 75%, and 100% of PV, which amounts to the expected result 83.3% of the time. A detailed summary is given in Table II. Thus, the parallelism method used in this case study is shown to be highly accurate in detecting PV.
Summary of Parallelism Test Results
Conclusions
Parallelism is a necessary condition for the relative potency of a bioassay to be meaningful. Difference and equivalence tests are two major statistical methods used for parallelism testing, with the latter being recommended for use in the revision of USP Chapters 〈1032〉 and 〈1034〉. The recommendation is largely motivated by the criticism that the difference test may reject parallelism even for insignificant differences when the sample size is large or the assay is too precise, and that it fails to reject parallelism of non-parallel curves when sample size is small or the assay is imprecise. Therefore the method rewards assays of small sample sizes and large variability, and thus does not offer adequate protection to consumer's risk.
From a compliance perspective the equivalence test may be the preferred method because it makes the control of consumer's risk possible, and encourages the manufacturer to improve its assay so as to provide better protection to the producer's risk. However, implementation of this method can be challenging for laboratories that lack experience in statistical analysis and software development. Development of such a parallelism testing enabling tool is important for a laboratory to be compliant.
In this paper we present a customized assay analysis template that is incorporated into a fully GMP-compliant software package. The template automates USP-recommended parallelism testing method based on a 4PL model, and it is simple to use. It makes the implementation of the USP guidance both practical and feasible. A case study demonstrates that the equivalence test is able to fail non-parallel samples and pass parallel samples. The tool can easily be generalized to bioassays with other types of non-linear response data such as 5-parameter logistic function. For those who are interested in getting a copy of the tool, please contact the last author. Overall we show that an equivalence approach for parallelism testing, as recommended by USP, can be implemented in a simple, QC-friendly, compliant, and validatable manner.
Conflict of Interest Declaration
The authors declare that they have no competing interests.
Acknowledgments
We would like to thank Dr. Lingmin Zeng, Yanqing Hu, Tianmeng Shao, Michael Doh, Dr. Ziping Wei, and Dr. Gail Wasserman for their support of this project. We also would like to thank the three referees for their helpful comments, which greatly helped improve the manuscript.
- © PDA, Inc. 2012


Jump to section
Related Articles
Cited By...
- Development of Generic Equivalence Margins for Early-Stage Implementation of Equivalence Testing for Potency Assays
- A Novel Method for Qualification of a Potency Assay through Partial Computer Simulation
- Comment and Completion: Implementation of Parallelism Testing for Four-Parameter Logistic Model in Bioassays