
Abstract
This paper is the fourth in a series that explores ongoing transformation in the pharmaceutical industry and its impact on pharmaceutical quality from the perspective of risk identification. The aim of this paper is to validate proposed quality risks through elicitation of expert opinion and define the resultant quality risk model. Expert opinion was obtained using a questionnaire-based survey with participants with recognized expertise in pharmaceutical regulation, product lifecycle, or technology. The results of the survey validate the theoretical and operational evidence in support of the four main pharmaceutical transformation triggers previously identified. The quality risk model resulting from the survey indicated a firm relationship between the pharmaceutical quality risks and regulatory compliance outcomes during the marketing approval and post-marketing phases of the product lifecycle and a weaker relationship during the pre-market evaluation phase.
LAY ABSTRACT: In this paper through conduct of an expert opinion survey the proposed quality risks carried forward from an earlier part of the research are validated and resultant quality risk model is defined. The survey results validate the theoretical and operational evidence previously identified. The quality risk model indicates that transformation-related risks have a larger regulatory compliance impact during product approval, manufacturing, distribution, and commercial use than during the development phase.
- Pharmaceutical transformation
- Quality risks
- GxP (good laboratory, clinical, and manufacturing practice) due diligence
- Product transfer
- Biotechnology products
- Expert opinion survey
1. Introduction
The theoretical evidence for factors influencing the ongoing transformation in the pharmaceutical industry was established in previous systematic reviews of the literature (1, 2). Fourteen factors were identified which were termed “transformation triggers”. Fully integrated Pharma network, personalized medicine, translational research, and pervasive computing were selected as the four main triggers with the strongest theoretical (2) and operational evidence (3). A set of pharmaceutical quality risks were proposed (2) (see also section E of Table I) which were considered likely to have been induced by the four main transformation triggers. The aim of this paper was to validate the proposed quality risks through the expert opinion survey and define the resultant pharmaceutical quality risk model. The validation of the proposed quality risks was necessary for two key reasons: (i) the assessment of the operational evidence in earlier part of the research was used to verify the “theoretical evidence” in relation to the industry transformation but not the associated proposed quality risks; and (ii) given that literature results take time to publish, there is a difference in knowledge within the literature and those of experts in the field. Therefore there was a need to have a view of the current situation by eliciting opinion of experts with operational knowledge relating to industry transformation and associated quality risks.
Main Survey Questions
Expert opinion was sampled using a questionnaire-based survey, referred to here as the main survey, with participants who were experts in the fields of pharmaceutical regulation, pharmaceutical product lifecycle, or pharmaceutical technology. The survey was piloted to ensure reliability and validity of the questionnaire (4, 5).
The main survey results were analyzed to ascertain (i) the correlation between the theoretical, operational, and survey evidence; and (ii) the pharmaceutical quality risk model by determining relationships between the transformation-induced quality risks and regulatory compliance outcomes during the pre-market evaluation, marketing approval, and post-marketing phases of drug product lifecycle.
2. Methodology
2.1. Survey Design Overview
Piloting the Survey (Mixed Method—Qualitative and Quantitative):
The aim of the pilot survey was to (i) assess validity and reliability of the pilot questionnaire, and (ii) assess the robustness of the data analysis method selected for the main survey. The design approach was based on cognitive interviewing using verbal probing technique. Data were collected using the interview notebook. Collected data was analyzed using qualitative description of the emerging themes, quantitative description of the classified observations, and quantitative analysis of the responses to the questionnaire. The expected outcome was to create the main survey questionnaire by improving the pilot questionnaire and confirmation that the selected data analysis method was appropriate for the main survey.
Conducting the Main Survey (Quantitative Method):
The aim of the main survey was to solicit expert opinion on the relationship between the transformation-induced quality risks and regulatory compliance outcomes. Survey design was based on relational, non-experimental, fixed method (4). Data were collected using the main survey questionnaire (questions are listed in Table I). Collected data were analyzed using descriptive statistics and Microsoft Excel functionality.
2.2. Questionnaire Design
The survey questionnaire contained a number of closed-ended questions based on the Likert Scale with four options (6): 1 Very Unlikely, 2 Unlikely, 3 Likely, 4 Very Likely, including an option for Don't Know. The rationale behind choosing a four-interval measurement scale was to avoid gravitation toward center and encourage the participants who were recognized experts to take a clear stance. The questions were categorized into four sections with an additional section focusing on participant instructions and definition of terms (see Table I).
Piloting the Questionnaire:
The questionnaire was piloted using the cognitive interviewing method (7) by interviewing participants recruited from the researcher's organization. During piloting the questionnaire, the cognitive interviewing method was applied using the verbal probing technique (7). The focus of the verbal probing was the survey questions. A 1 h interview with each participant was performed during which the participant answered the survey question; the interviewer then asked for other specific information relevant to the questions or to the specific answer given. In general, the interviewer probes further into the rationale and basis for the response. The key benefit was to improve the pilot questions and hence the main survey questionnaire by exploring issues relating to participant comprehension and identify structural problems such as erroneous skip patterns (procedures that direct respondents to answer only those items relevant to them) and unclear layout during the interview process.
The pilot interview notebook was used to collect the observations. The notebook contained the questions, the participant's response to the questions, and classification of any comments (see Table II) that the participant made related to the question or the survey procedure. This interview captured two types of data, namely, participant responses to the survey questions and participant comments to the assessment of survey reliability and validity. The main survey did not start until the piloting activity was completed and the ensuing improvements had been implemented.
Classification of the Cognitive Interview Comments
Reliability and Validity Assessment:
-
I) Reliability of the data collection method: pilot data relating to participant comments were analyzed with the aim of improving the reproducibility of the survey questionnaire. As a comparative exercise the same data were analyzed statistically using Cronbach's alpha (8).
-
II) Validity of the data collection method: the aim of the validity assessment was to improve fitness of the questionnaire for its intended use. This involved assessment of validity with respect to questionnaire content, structure, and participant sampling (external validity). External validity was improved using the purposive sampling method, construct validity was assessed and improved during cognitive interviewing, and content validity was derived from the literature.
-
III) Validity of the data analysis method: the participant response data captured during piloting activity was analyzed to confirm the appropriateness of the selected data analysis method.
-
IV) Qualitative description of the emerging themes: the data from the cognitive interviewing were categorized into themes, which in turn informed the actions needed to improve the questionnaire and the associated survey procedures.
Questionnaire Anonymization:
The questionnaires were anonymized according to the a pseudo-code procedure and a link file containing the participant details and the corresponding anonymized code.
2.3. Participants for the Main Survey
The participants were recognized experts in the field of pharmaceutical regulation, product lifecycle, or technology. They had strategic view of the pharmaceutical quality in their respective organization, were typically the go-to person on matters of quality and regulatory compliance, and often represent their companies in external academic or industrial organizations. They had multidisciplinary quality expertise with exposure (exposure to quality issues affecting two or more elements of the drug product lifecycle) to quality issues affecting the drug product lifecycle (lifecycle: laboratory studies > clinical studies > product approval > product manufacturing > product distribution > product surveillance), and experience in the pharmaceutical or biopharmaceutical industry as an employee or as a service provider.
A combination of representative (the primary sampling method) and snowball sampling (4) offered the best method for participant selection. The sample was taken from the organizations that make up the sampling frame (see next section). Snowball sampling was used as an aid to the representative sampling, which requires the participants to identify other potential candidates from the sampling frame.
Sampling Frame:
Sampling frame is the source of the eligible population from which the survey sample was drawn. Potential candidates for this study were recruited from the organizations listed in Table III. These organizations were representative of pharmaceutical experts who gather and formulate solutions to challenging regulatory problems and publish their work. Key criteria for selecting the four organizations listed in Table III were (i) focus on pharmaceutical science, technology, and regulations in the context of drug development, approval, and manufacturing; (ii) diverse membership that included industry professionals, industry service providers, regulatory agencies, and academia; (iii) active involvement in regulatory science topics; and (iv) a specific focus on pharmaceutical quality from the perspective of good laboratory, manufacturing, clinical, or pharmacovigillence practice and risk management. Inclusion of consulting professionals from service providers to the pharmaceutical industry was important for enhancing sample diversity because these professionals experience a wide range of industry practices during their service offerings.
Target Participant Organizations
Inclusion Criteria for the Main Survey:
Candidates meeting the following criteria were selected for the survey:
-
Those who had quality and compliance knowledge in good laboratory, clinical, and/or manufacturing practice and
-
Those who had experience with U.S. Food and Drug Administration (FDA) regulations and/or E.U. European Medicines Agency (EMA) regulation and
-
Those who had current working knowledge of quality relevant to medicinal products based on pharmaceuticals and/or biologics
Participants were allowed to withdraw from the study at any time.
2.4. Procedure for Conducting the Main Survey
The survey procedure had two key steps: (i) participant awareness and informed consent, and (ii) questionnaire completion. Potential candidates were contacted by telephone to secure their verbal consent to participate in the survey. The telephone conversation was intended to last up to 30 min and focused on explaining the information leaflet, clarifying instructions on how to complete the questionnaire, and addressing any process-related questions that candidates may have had. During the telephone conversation it was explicitly stated that participation in the survey was voluntary and there was no obligation to contribute to research study. The telephone conversation stopped at this point and if the candidate consented he/she was considered as a participant in the study. Prior to the teleconference meeting, an e-mail containing an electronic copy of the information leaflet and the questionnaire was sent to the candidates. After the phone conversation, an e-mail containing a brief statement referencing the summary of the phone conversation and that the candidate had verbally consented to take part in the survey was sent to the participant. The participants were asked to complete the questionnaire offline and return the completed electronic or scanned copy to the principal investigator. The questionnaires were checked for completeness upon receipt and the participant contacted to address any gaps. The main survey conduct was deemed closed once all the completed questionnaires and subsequent communication to address issues were received within a 6 month period from start of the main survey study. For participants from the Parenteral Drug Association (PDA) the survey conduct was somewhat different. For this population, Survey Monkey (an online survey application) was used to inform, seek consent, and collect participant responses to the main survey questionnaire online. This approach was taken to conform to the privacy policy of the PDA and to ensure equivalence to the paper process the Survey Monkey questionnaire and associated communication procedure was aligned to the study protocol approved by the Research Ethics Committee (REC).
2.5. Ethical Considerations
The study protocol for the pilot and main survey was submitted to Liverpool John Moores University REC for review. The survey research did not commence recruitment until this protocol was fully and unconditionally approved by the REC.
2.6. Data Analysis Methods
The intent of the data analysis was to use descriptive statistics, correlation, and covariance to compute the following:
-
The frequency of participant responses per interval per question in order to determine the distribution of responses
-
The average score per question and for the whole dataset in order to determine the central tendency of the responses
-
The standard deviation of the dataset in order to construct data points with ± 1, 2, and 3 standard deviations (SDs) around the dataset mean
-
The probability density function (PDF) in order to determine if the data set was normally distributed
-
The relationship between the survey results and each of the theoretical and operational evidence
-
The relationship between proposed quality risks (independent variables) and the corresponding regulatory compliance outcomes (dependent variables)
Definition of Key Terms:
Interval: Grouping of participant scores in the Likert scale:
Don't Know 0 to 100 (the participant does not know enough to respond but the potential answer could be within the full range of the scale)
Binary: Yes/No 100/0
Midpoint: Midpoint value of each interval
PRC: Participant response count per interval per question
Mean: Average score for each question
Dataset: Refers to participant scores for questions in the questionnaire that use Likert scale for measurement (questions 10 to 30, except 28)
Dataset Mean: Average score for the dataset
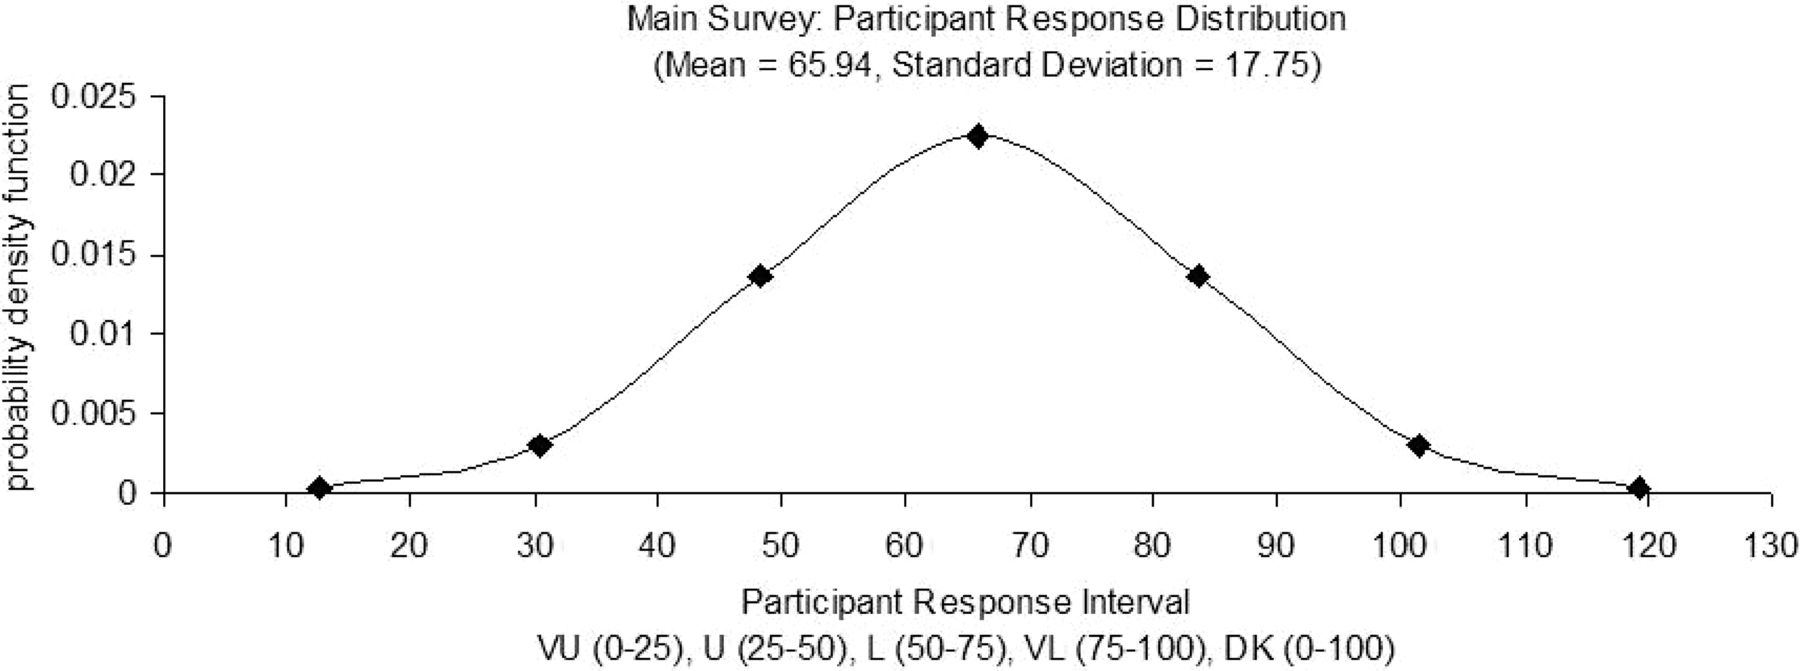
PDF: Participant response distribution (probability density function)
Correlation: Strength of relationship between two variables
Covariance: Measure how the independent and dependent variables change together
Excel: The following Excel functions or menu options were used during the data analysis: AVERAGE, CORREL, COUNTIF, Data>Sort>, MEDIAN, NORMDIST, STDEV, SUM, VAR, COVAR (refer to 2003 Microsoft Excel help for detailed definition: http://office.microsoft.com/en-us/excel-help).
Calculation Procedure for Descriptive Statistics:
The data captured within the pilot and main questionnaires were converted from frequency centric score to a standardized score for analysis.
-
PRC = COUNTIF ([[[Score, “=x”]1 to Q]1 to I]1 to P) … where Q = number of questions in the dataset, I = number of Intervals, and P = number of participants
-
Standardized Score = ([[[PRC * Midpoint]1 to Q]1 to I]1 to P)
The central tendency of the participant scores both at the individual question level and for the whole dataset was calculated as follows:
-
Mean = SUM ([[Standardized Scores]1 to Q]1 to I)/SUM ([[PRC]1 to Q]1 to I)
-
Dataset Mean = AVERAGE ([Mean]1 to Q)
The standard deviation (SD) was calculated in order to test if the dataset was normally distributed. Data points above and below the dataset mean (± 1, 2, 3 SDs) were computed. The corresponding probability density function for each of the seven data points was calculated.
-
Variance = VAR ([[Standardized Score]1 to Q]1 to P)
-
SD = STDEV ([[Standardized Score]1 to Q]1 to P)
-
Data Point m = Mean + (n * Standard Deviation) where m = 1 to 4 and n = 0 to 3
-
Data Point m = Mean − (n * Standard Deviation) where m = 5 to 7 and n = 1 to 3
-
[PDF]1 to 7 = NORMDIST ([Data Point]1 to 7, dataset Mean, dataset SD, False). False is chosen because the data is discrete. For continuous data, TRUE is used.
The reliability of the data collection method (internal consistency of the pilot survey questionnaire) was tested using Cronbach's Alpha (8). A pair-wised covariance matrix was set up with both rows and columns containing the survey questions. Covariance of each question to itself (self-covariance) and with other questions was calculated.
-
Covariance = COVAR ([[Normalized Score]1 to Q]1 to P)
-
Self-covariance = SUM ([self Covariance]Q,Q)
-
All Covariance = SUM ([[Covariance]1 to Q]1 to Q)
-
Cronbach's α = (Q/(1 − Q)) * (1 − (self-covariance/all covariance)), for all datasets
The impact on the reliability coefficient was determined by recalculating the Cronbach's alpha for the dataset without including Covariance of each question at a time. The intent was to determine absence of which question had the biggest positive or negative impact in reliability of the pilot survey questionnaire.
The sum of participant comments on the questions mapped against each transformation trigger was considered as the primary indicator of participants' level of interest on a given trigger and hence its perceived importance. This survey variable was therefore used in determining strength of correlation between the survey results and the corresponding theoretical and operational evidence (2, 3).
The correlation between the pharmaceutical transformation triggers (2) and the main survey questions was determined as follows:
-
Mapped main survey questions to pharmaceutical transformation triggers*
-
Found sum of participant comments to mapped questions corresponding to each trigger
-
Tabulated the operational evidence strength corresponding to each trigger*
-
Tabulated the theoretical evidence strength (i.e., transformation trigger ranks*), operational evidence strength, and expert opinion strength (i.e., sum of participant comments for mapped questions) in a correlation matrix
-
Found the correlation between the expert opinion strength and each of the other arrays within the matrix. In this case correlation rather than covariance is used because the measurement scale for the variables is in different units.
-
Correlation(trigger/survey) = CORREL ([expert opinion strength]1 to T, [X]1 to T), where T is the number of transformation triggers = 14 and X = arrays of “theoretical evidence strength” or “operational evidence strength”
*The above procedure steps with the asterisks indicate that these steps were established during an earlier part of the research (2, 3).
The covariance between the transformation-induced quality risks and the regulatory compliance outcomes for the main survey was determined as follows:
-
Calculated individual mean of main survey questions for the transformation-induced quality risks (independent variables)
-
Calculated individual mean of survey questions for the regulatory compliance outcomes (dependent variables: i.e., pre-market evaluation, marketing approval, and post-market surveillance)
-
Computed covariance between the independent and dependent variables
-
Covariance = COVAR(( [Quality Risks]1 to I, [Y]1 to D). …where I and D are the number of main survey questions relating to independent and dependent variables = 4 and Y = “pre-market evaluation” or “marketing approval” or “post-market surveillance”
3. Results
3.1. Pilot Survey
The pilot interviews composed of responses from six participants. Each interview lasted approximately 1 h. During pilot interviews, interaction with the participant was performed in accordance with the cognitive interview process described above. All remarks made by the participant during the interview were captured as embedded comments within the Excel version of the questionnaire. Due to time limitations, scripted verbal probing was not used. Instead the objective of the verbal probing, the role of the interviewer and the role of participant were explained at the beginning of each interview. The participants were encouraged to freely challenge the questionnaire content, style (layout and format of the questions), and the measurement scale during the interview. All the comments made by all the participants during the cognitive interview process were attributed to a section or a question within the pilot survey questionnaire. There were 59 comments, of which 90% were related to content of the questions, 7% to style of the questions, and 2% to the measurement scale. Cognitive interview comments guided improvements of the questionnaire, which resulted in reducing the number of questions from 36 to 30.
The reliability coefficient for the pilot dataset (α = 0.7722; raw data not included) is at the boundary of Acceptable and Good (α ≥ 0.9 Excellent; 0.9 > α ≥ 0.8 Good; 0.8 > α ≥ 0.7 Acceptable; 0.7 > α ≥ 0.6 Questionable; 0.6 > α ≥ 0.5 Poor; 0.5 > α Unacceptable) (8). This confirms the internal consistency of the pilot questionnaire.
3.2. Main Survey
The main survey included 80 participants with a response rate of 41% whose profiles—based on their answers to questions in Section B in the questionnaire—are summarized in Table IV. The frequency of the participant responses to Section C questions is tabulated in Table V. Some participants provided multiple suggestions for the open-ended element of these questions, which are counted separately and reflected in the response frequency calculations.
Participant Details for the Main Survey
Transformation-Related Questions (Main Survey)
The responses to questions in Sections C, D, and E were standardized (see section 2.6) for all participants; the mean of the standardized scores per question is included in Table VI. The frequency of participant responses for transformation-induced quality risks (independent variables) and compliance outcomes (dependent variables) is captured in Table VII and Table VIII, respectively.
Participant Response Statistics (Main Survey)
Participant Response Count for Questions Relating to Quality Risks (Main Survey)
Participant Response Count Relating to Compliance Outcomes (Main Survey)
The probability distribution of the participant responses for the quality risk–related questions was calculated based on the probability density function values in Table IX and is graphically illustrated in Figure 1.
Participant Response Probability Distribution for Quality Risk Dataset (Main Survey)

Main survey participant response probability distribution.
The relationship between the transformation triggers and the expert opinion survey results was established by determining the correlation between the sum of participant comments for the mapped survey questions and each of (i) transformation trigger ranks, and (ii) strength of operational evidence. The results are listed in Table X and Table XI.
Correlation between Transformation Trigger Ranking, Operational Evidence, and Expert Opinion Survey
Correlation between Theoretical and Operational Transformation Evidence and the Main Survey Variables
The relationship between transformation-induced quality risks and the corresponding regulatory compliance outcomes was established by determining the covariance between then respective means and the results are listed in Table XII.
Quality Risk Model—Covariance Between Transformation-Induced Quality Risks and Compliance Outcomes (Main Survey)
4. Discussion for the Main Survey
The supporting data for the following discussion topics is tabulated in Tables IV to XII, and the corresponding methods for computing the statistical calculations are described in section 2.6 above.
4.1. Participant Details (Questions 2 to 6 of Main Questionnaire—Tables I and IV)
Analysis of the participant profiles indicated that they all had extensive professional experience (15+ years) in the pharmaceutical industry. They had strong expertise in the U.S. and E.U. regulations, with some knowledge of other regulatory environments such as Australia, Brazil, Canada, Japan, New Zealand, Switzerland, the Pharmaceutical Inspection Co-operation Scheme, and the World Health Organization. They gained most of their operational experience within Big Pharma and consulting companies serving mainly the pharmaceutical and biopharmaceutical business. The regulatory expertise for majority of the participants focused on the manufacturing quality, followed by laboratory quality, clinical quality, and research quality. The participant profiles are well balanced and meet the needs of this survey.
The 41% response rate (Table IV) is appropriate because the respondent profiles characterize the entire participant population. The following key characteristics of the participant population are strongly represented in the respondent profiles as demonstrated in Table IV:
-
Participants with operational experience in the pharmaceutical industry and as service providers
-
Participants with operational knowledge of the U.S. and E.U. regulatory environment
-
Participants with operational knowledge of good laboratory and manufacturing practice. In practice, the drug product quality and associated patient safety concerns are more prominent during product approval and routine use of the drug product than during the research and development phase. Therefore it is appropriate that most respondents have experience in good laboratory and manufacturing practice
The participants were selected from specific departments within the organizations listed in Table III. The word department is used to collectively refer to terms such as advisory board, committee, working group, and interest group. The departments listed in Table III have a specific mission, and their members were assigned by their respective organizations. Assignments of members was based on expert knowledge of the members on the subject matter that the department was commissioned to undertake. Therefore the survey participants selected from these departments are considered experts.
One potential area of improvement is additional expertise in the clinical quality arena. More participants with this expertise would have provided a sharper image of quality risk and compliance outcomes associated with the pre-market evaluation phase of the product lifecycle.
4.2. Pharmaceutical Transformation Triggers and Risks (Questions 7 to 9 of Main Questionnaire—Tables I and V)
In addressing questions relating to pharmaceutical transformation most participants agreed that the Business and Regulatory environment play the leading role in the ongoing transformation within the industry, with open innovation playing somewhat of a lesser role. Among the open innovation trends, commercial partnerships, outsourcing of data management activities, focus on biological products, and in-licensing received the most attention. Participants also suggested increase in other open innovation trends that include virtual organizations, contract manufacturing, and professional consortiums. From the perspective of quality risks, the participants gave the highest importance to effective due diligence, product transfer, and product characterization activities, followed by technology validation and multidisciplinary regulatory knowledge. Provisions for data security and integrity received the lowest score.
Summary of Participant Remarks:
Quality risk on the one hand and overly prescriptive standard promulgation and an exaggeration of risk on the other were identified as opposing opinions and additional drivers of industry transformation. One participant stated that “open innovation trends currently practiced in the industry include virtual organizations, contract manufacturing, and professional consortiums”. Other areas of risk identified by participants include (i) duration of research partnerships versus duration of the product development lifecycle, (ii) supply chain management in its broadest context, (iii) management understanding of quality rather than just compliance, and (iv) product adulteration and drug counterfeiting.
4.3. Open Innovation and Regulatory Compliance (Questions 10 to 17 of Main Questionnaire—See Tables I, VI, VII, and VIII)
There was solid support among participants that open innovation would have a significant influence on selection and oversight of external partners, legal framework for exchanging research information, and management of data from the perspective of data security, integrity, and privacy. The prevalence of biological and biotechnology products in pharmaceutical companies' project and product portfolios and prevalence of pervasive technologies requiring multidisciplinary knowledge/skills received the most likelihood of occurrence from the participants. Participants did not agree that existing regulatory approaches adversely affect pharmaceutical innovation, and there was modest support for the assertion that the current regulatory initiatives such as “Critical Path” of the U.S. FDA and “Innovation Task Force” of the EMA had significant positive impact on pharmaceutical innovation.
Summary of Participant Remarks:
Concerning the impact of open innovation on external partner/alliance selection, two participants suggested that companies were already downsizing and outsourcing various activities and that more scrutiny in partner selection was needed. One participant thought that “legal framework for open innovation should probably be established” but was “not sure if it would happen”, and another participant had an opposing view, stating that “legal framework is pretty well developed already”. Regarding the prevalence of biological/biotechnology products, one participant believed that this was already part of project and product portfolios of pharmaceutical companies and this is a trend that will accelerate. In contrast, another participant suggested that biological/biotechnology products tended to be highly expensive targeted drugs and current trends in health care management may not embrace these products as a first line of therapy. On multidisciplinary knowledge/skills, one participant stated that “what is required from a compliance point of view are more individuals with medical experience making judgments regarding patient care and less involvement of bureaucrats to encourage peer review and ensure attention to fundamental scientific principals”. On regulatory approach to compliance and innovation, one participant suggested that “compliance is all too often a self-fulfilling prophecy in which a perceived problem is blown out of proportion to risk. Overbearing regulation for years has been used to control respective markets leading to difficulty in introducing newer technologies particularly those that rely on unique drug delivery systems, are customized to a specific patient, or are multifaceted in one way or another. Overbearing regulation would result in a loss of innovation, the swallowing up of smaller, entrepreneurial organizations, drug shortages of some medicines, and perhaps even the curtailment of generics”. Another participant focused more on the legal aspect, stating that “concern about adverse publicity and legal issues (potential class action lawsuits) are leading to conservative decision making in portfolio management and regulatory review”. Another participant summarized the regulatory approach as “the bar for safe and effective is increasing”. One participant stated that “regulators have no incentive in making anything easier for anyone” and was “not optimistic that the regulatory apparatus which has evolved in Europe and the USA in particular can support an innovative environment”. Concerning regulatory initiatives, one participant opined that “these initiatives may work if regulators provide flexibility in regulatory filings”. A couple of the participants expressed a more skeptical tone, opining that regulation never leads to innovation or innovation drive, regulation should focus on one thing and one thing only, making sure that there is a supply of safe medicine for everyone and that new ideas gain market access at the appropriate pace. Such initiatives to date have tended to be largely political and seem to lack the strategic partnership needed with all sectors of the pharmaceutical industry (i.e., Big Pharma as well as Generics).
4.4. Assessment of Transformation Quality Risks (Questions 18 to 30 of Main Questionnaire—See Tables I, VI, VII, and VIII)
Poor process understanding for biological/biotechnology products and problems with due diligence process for external partners/alliances was seen as posing the most quality risks, followed by lack of multidisciplinary quality knowledge and expertise across a range of regulatory situations. Externalizing management of GxP–related data and lack of effective technology validation processes were deemed important but comparatively less important as sources of quality risks. According to the experts (Table VIII), the outlined quality risks from a GxP compliance perspective are most noticeable during the post-marketing surveillance and marketing approval phases of the product lifecycle. In comparison, the participant responses suggest that quality risks are less impactful during pre-market evaluation phase and that most of the impact is focused on due diligence of external partners/alliances, biological/biotechnology product characterization, and externalization of GxP data management.
Summary of Participant Remarks:
On GxP due diligence for external partners/alliances, one participant commented that “all the phases of the product lifecycle were at risk as long as the focus remains on regulatory compliance rather than real compliance”. The participant defined real compliance as “developing and manufacturing safe and effective medicines from a strong ethical base focusing on combating unethical and criminal elements of the health care product supply chain”. With respect to product transfer, one participant stated that “potential GxP compliance risks will depend a lot on quality of product transfer planning and execution”. Another participant stated that “the GxP compliance was a moving target which often has absolutely nothing to do with product safety”. One participant proposed “inadequate knowledge management and process characterization continue to be major roadblocks in early commercialization”. One comment focused on contractual process expressing a great deal of concern during the technology transfer process from one organization to another and that the “contract giver discovers it takes much more time and resource than they had imagined”. Another comment attributed inadequate knowledge of dosage form processes to “poor inspections outcomes stating that there is a direct relationship between industry implementation of innovative technology and more regulatory scrutiny”. Concerning multidisciplinary regulatory knowledge/skills, one participant stated that “the compliance risks are high after the initial product approval, firms' compliance and quality systems trend to deteriorate during the commercial manufacturing”. Regarding complexity of the biological/biotechnology product characterization, a couple of the participants opined that the process is the product and in some cases they are more difficult to characterize chemically or biochemically, but in some cases they aren't, further explaining that “complex biologics have been used safely for decades; there is no reason to be hung up on complexity”. One comment focused on regulators' understanding of contamination control, stating that the “recent drive to manufacture even non-sterile drugs in classified clean rooms as a complete waste of money and regulatory effort”. Another comment attributed the majority of regulatory product recalls to “poor understanding of product performance long term, especially with product component interactions”.
With respect to externalization of GxP data management, one comment stated that “some aspects of data collection and storage has been in place for decades and compliance problems have been comparatively rare”, and another comment focused more on use of social media in the industry, implying that “it may present a larger quality and compliance risk than internal data management systems”. Concerning technology validation, one comment addressed the new technology adoption in the industry, saying that the “pharmaceutical and biopharmaceutical industries have lagged behind other technological industries in the adaptation of modern information and process management technologies”. The commenter attributed this lag largely to “misplaced regulatory concerns and unfortunate regulatory requirements”. Another comment focused on computer validation approaches, noting that they “have not changed significantly in 20 years and therefore the current methodologies are unprepared for use of new ‘cloud based' computing”.
4.5. Relationship between Transformation Triggers and Expert Opinion (See Tables X and XI)
The correlation between strength of the opinion-based variable (i.e., survey participant comments for the mapped questions) and strength of the evidence-based variables (i.e., theoretical and operational evidence) were computed and found to be within the acceptable range (Table XI). This indicates that the expert opinion survey validated importance ranking of the transformation triggers proposed during the earlier part (2, 3) of our research.
4.6. Relationship between Quality Risks and Regulatory Compliance Outcomes (See Table XII)
The covariance between transformation-induced quality risks and the corresponding regulatory compliance outcomes was computed and found to be negative for the pre-market evaluation and positive for the marketing approval and post-market surveillance phases of the product lifecycle.
5. Conclusions
The survey results validate the theoretical and operational evidence in support of the four main pharmaceutical transformation triggers. The quality risk model indicates a firm relationship between the pharmaceutical quality risks (independent variables) and regulatory compliance outcomes (dependent variables) during the marketing approval and post-marketing phases of the product lifecycle and a weaker relationship during the pre-market evaluation phase. This model can be used by the industry practitioners to develop appropriate risk mitigation strategies in product lifecycle activities that are affected by the four main transformation triggers and the associated transformation-induced quality risks. From an industry practitioner perspective, the negative relationship in the pre-market evaluation phase may seem somewhat unusual in that, in practice, compliance risks do occur during this phase although to a lesser extent than when the drug product is in routine use. One explanation could be linked to the profile of the participants. From a product lifecycle expertise standpoint, most of the participants (55%) had a commercial manufacturing background and lesser percentage (9%) had clinical and medical background, which would be necessary to accurately estimate the impact of the quality risks in the pre-market evaluation phase relating to the clinical development activities.
It is our opinion that in practice the mitigation strategies for the management of the validated quality risks listed in Section E of Table I should be built into the pharmaceutical processes that govern organization, support, and product lifecycle activities from a quality management perspective. The key organization processes that should be considered are the quality systems management, quality audit, and quality risk management processes. These processes are overarching in scope and will cover all the proposed areas of risk. The support processes typically deal with transverse topics that apply across the product lifecycle. Activities that should be considered for this category include product and processes improvement, personnel qualification and training, management of suppliers and subcontractors, and validation of systems/equipment. The product lifecycle processes that govern post-marketing activities (i.e., manufacturing, distribution, and surveillance of commercial drug products), marketing approval activities (regulatory submission and maintenance), and pre-marketing activities (i.e., non-clinical laboratory studies and clinical development) should be considered. Application of the quality risk model described here would mean that the priority for implementation of risk mitigation controls should be given to the post-marketing and product approval activities that are significantly affected by the proposed quality risks related to (i) external partner due diligence and oversight, (ii) product transfer, (iii) characterization of biological/biotechnology products, and (iv) outsourcing of GxP data management.
Limitations:
A key limitation of this research is lack of similar peer reviewed studies for comparison purposes. This is a unique study and the authors at the time of writing this article did not find any published research with similar coverage.
Conflict of Interest Declaration
The authors declare that they do not have any financial or non-financial competing interests related to the content of the manuscript.
Acknowledgements
The corresponding author works for Sanofi (Bridgewater, NJ ) and gratefully acknowledges the company's support for this research as part his professional development. Views expressed in this paper are those of the authors and do not in any way reflect the official policy or position of Sanofi.
- © PDA, Inc. 2013


