
Abstract
A number of rapid microbiological methods capable of aerosol-based microbial detection are quickly emerging for use in the pharmaceutical and food markets. A subset of these technologies utilizes intrinsic microbial fluorescence as the basis for bioaerosol detection. This fundamental method of detection is relatively new to the pharmaceutical and food industries, which rely on traditional culture-based methods implemented decades ago to gain an understanding of their manufacturing environments. When combined with real time and continuous assessment, intrinsic fluorescence-based detection provides a new level of information and monitoring in these environments. One aspect of this monitoring relates to the detection of stressed micro-organisms. Bacteria found in pharmaceutical and food manufacturing environments can be in a stressed state due to heat, UV, or chemical exposure, desiccation, and so forth. As a result, the ability of an environmental monitoring system to detect stressed microbes is of particular interest. A commercially available, intrinsic fluorescence-based bioaerosol detection RMM was utilized in this study to determine the ability of such systems in the detection of heat-stressed microorganisms. An assessment of culturability and growth delay in control and heat-stressed samples was performed to confirm stress. Furthermore, the performance of the intrinsic fluorescence-based bioaerosol detection systems were compared to the SAS Super 100, MAS-100 NT, and SMA air samplers in the detection of heat-stressed Escherichia coli, Staphylococcus epidermidis, and Bacillus atrophaeus spores. These bacteria were selected because they are industry-relevant organisms, commonly found in various manufacturing environments, that represent a Gram-positive, Gram-negative, and spore-forming bacteria, respectively. It was found that the intrinsic fluorescence-based bioaerosol detection systems can detect heat-stressed microorganisms, including those that are not detected by the traditional culture-based method due to the inability of the stressed microbes to form colony-forming units.
LAY ABSTRACT: Rapid microbiological methods capable of aerosol-based microbial detection are emerging for use in pharmaceutical and food markets. A subset of these technologies utilizes intrinsic microbial fluorescence as the basis for bioaerosol detection, a method relative new to the pharmaceutical and food industries, which rely on traditional culture-based methods. Bacteria found in such environments can be in a stressed state due to heat, UV, or chemical exposure, desiccation, and so forth. As a result, the ability of an environmental monitoring system to detect stressed microbes is of particular interest. A commercially available, intrinsic fluorescence-based bioaerosol detection RMM was utilized in this study to determine the ability of such systems in the detection of heat-stressed microorganisms. An assessment of culturability and growth delay in control and heat-stressed samples was performed to confirm stress. Furthermore, the performance of the intrinsic fluorescence-based bioaerosol detection systems were compared to the SAS Super 100, MAS-100 NT and SMA air samplers in the detection of heat-stressed Escherichia coli, Staphylococcus epidermidis, and Bacillus atrophaeus spores. These bacteria were selected because they are industry-relevant organisms, commonly found in various manufacturing environments, that represent a Gram-positive, Gram-negative, and spore forming bacteria, respectively. It was found that the intrinsic fluorescence-based bioaerosol detection systems can detect heat-stressed microorganisms, including those that are not detected by the traditional culture-based method due to the inability of the stressed microbes to form colony-forming units.
Introduction
In order to provide customers with safe and secure products, manufacturers of pharmaceutical and food products strive to maintain a consistent level of control throughout the life cycle of a product due to regulatory requirements and an overall eye on customer safety. Microbial monitoring is of great importance in ensuring such safety. However, the traditional microbial monitoring systems typically used in the pharmaceutical and food manufacturing environments are limited in their ability to provide a continuous and robust assessment of the environment. These conventional microbial monitoring methods, developed several decades ago and remaining effectively unchanged, have been and are strongly relied upon to provide information on the level of microbial presence and control in the manufacturing environment. However, because these methods are based on growth, which offers benefits including a basis on the mechanism of proliferation which is unique to organisms, a number of organisms may not be detected by such instruments due to limitations in detection ability, such as an inability to detect a subset of microbes that are viable but non-culturable (VBNC). In the VBNC state, a cell retains viability and potential regrowth capability, but loses culturability (1, 2). Microbiological methods capable of VBNC detection are required if a true assessment of the significance of such organisms it to be realized. Additionally, the traditional growth-based method is often time-consuming, labor-intensive, and utilized intermittently as opposed to continuously to monitor the environment. Despite these limitations, the pharmaceutical and food industries continue to rely on such classical methods even now.
Recently, rapid microbiological methods (RMMs) have been highlighted as novel alternative methods for benefit in pharmaceutical and food industries. The term rapid is broadly applied to techniques that provide results more quickly than the traditional culture-based approach. Several RMMs have been developed and are already in use in these environments: adenosine triphosphate (ATP) bioluminescence, colorimetric growth detection, auto-fluorescence detection of growing microbial colonies, fluorescence staining–based technologies by enzyme activity and production of reduction force, endotoxin testing, and so on (3⇓–5). Many of these RMMs are growth- or chemical-based methods, which, although more rapid than the conventional method, still require incubation and manual manipulation. The most rapid of the RMMs available are light-induced fluorescence (LIF)-based RMMs that detect the presence of bioaerosols in real time through the measurement of microbial intrinsic fluorescence (6, 7). These systems are referred to as intrinsic fluorescence-based bioaerosol detection systems in this paper and as shown in Figure 1. The technologies are based on the fact that microbial cells have fluorophores such as flavins, aromatic amino acids, and NAD(P)H (8⇓–10), for example, the four major cellular fluorophores—tryptophan, pyridoxine, NAD(P)H, and riboflavin (10)—that fluoresce when interrogated with certain wavelengths of light. The detection abilities of intrinsic fluorescence-based bioaerosol detection systems have been previously investigated (11⇓⇓⇓⇓⇓–17), but additional understanding of their detection ability is still needed; for example, with regards to the detection of stressed microorganisms.

Schematic of the positional relationship between air samplers, RMMs, and an intrinsic fluorescence-based bioaerosol detector. SAS, MAS, SMA were chosen as representative common air samplers, and IMD-A was chosen as one kind of intrinsic fluorescence-based bioaerosol detector.
In order to introduce an RMM into a pharmaceutical manufacturing environment as an alternative or complementary method to conventional environmental monitoring tools, it is necessary to validate the system's detection ability compared to the conventional method. United States Pharmacopoeia (USP) <1223> and European Pharmacopoeia (EP) 5.1.6. offer guidelines for the evaluation and validation of alternative microbiological methods (4, 18, 19). In addition, European regulators have recommended that validation of an RMM should include an evaluation of metabolically and physically injured cells, with a comparison made to the conventional method. Stressed organism testing has therefore become an additional element of RMM validation seen as necessary by many European pharmaceutical companies. Mention of stressed organism testing has also been included in the recently released revision of PDA Technical Report No. 33 (20). The requirement to assess an RMM's ability to detect stressed organisms has its basis in the variable nature of microbial populations found in pharmaceutical and food environments due to heating, chilling, drying, osmotic shock, UV, chemical exposure (e.g., antimicrobial, preservative, additives), pH, and desiccation, among other stressors (21⇓⇓–24). Microorganisms in the environment of pharmaceutical and food industries are often metabolically and physically stressed, and then injured by these kinds of stressors as a result of the harsh environmental conditions and sterilization processes utilized (21⇓⇓⇓⇓–26). In this paper, we define some terms in order to clarify our discussion of stressed organisms. Stress is a factor that is applied to the target. Injury is a result of the stress and may also be caused by other factors. We intend these definitions when referring to stressed or injured organisms in this paper.
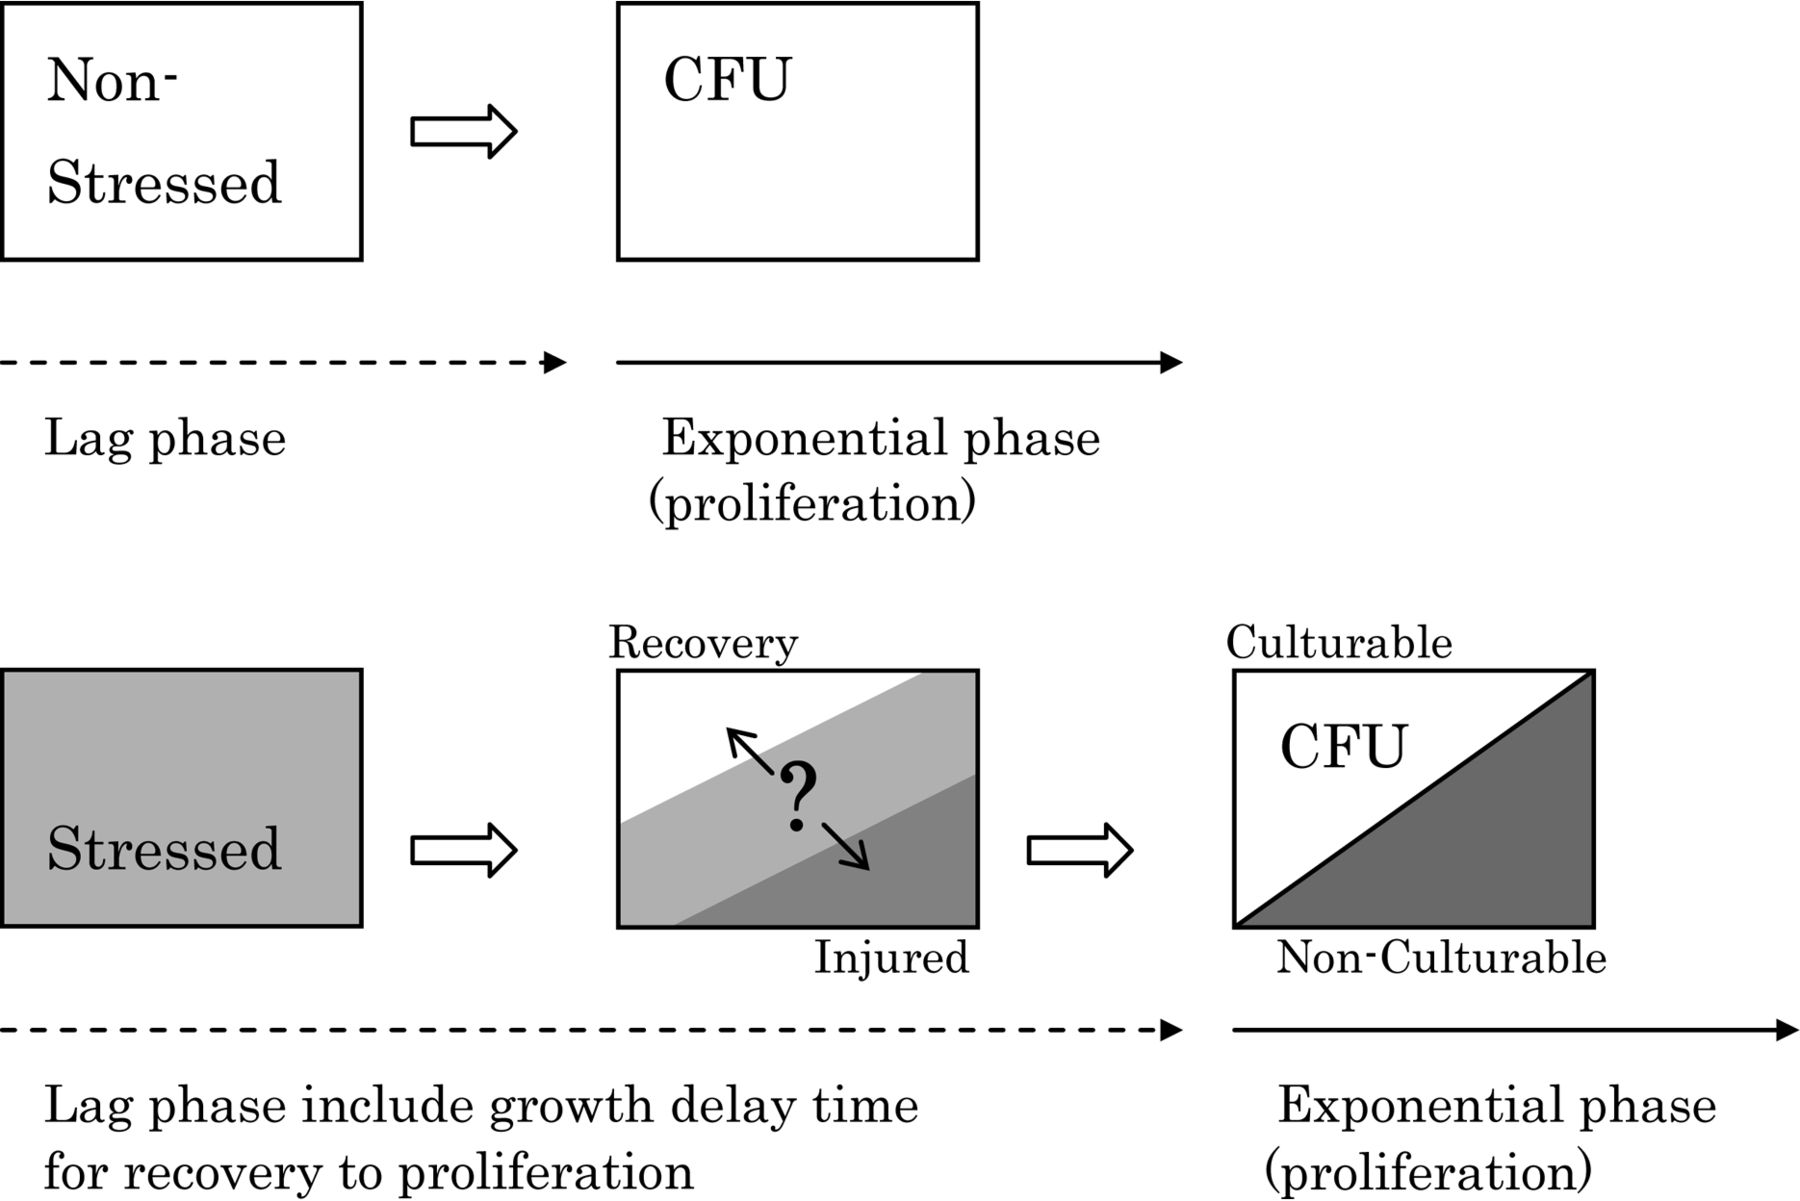
Injured microorganisms can be characterized by an extension of the lag phase (“growth delay”) and a loss of culturability; both of which influence the sensitivity of conventional growth-based methods (23, 27). Figure 2 illustrates these characteristics with a comparison between non-stressed and stressed microorganisms. In this context, non-stressed microorganisms are equivalent to intact, healthy microorganisms. In general, injured microorganisms cannot proliferate until they recover to a normal condition. The recovery process takes time, resulting in a delay in growth for the injured as compared to the healthy microorganisms (Figure 2). The recovery time is different for each individual microorganism because of the heterogeneous nature of the microbial population (27). However, it is possible to measure this recovery time as an average for each microorganism by observing their lag phase. Injured microorganisms show a prolonged lag phase compared to healthy microorganisms (24, 27⇓–29). In this paper, we define this prolonged lag phase as a growth delay time.

Characteristics of stressed or injured bacteria.
With respect to the loss of culturability, it has been said that injured microorganisms cannot grow on selective agar media because injured microorganisms lose resistance to selective agent mediums (12, 21, 23, 27, 30). Selective agar media are usually used for specific detection of targeted microorganisms in the food industries. It also has been said that injured microorganisms are culturable on non-selective agar media as compared to on selective agar media (12, 21, 23, 27, 30). Based on the culturability of injured microorganisms on selective versus non-selective agar media, differences in colony number on selective and non-selective agar media have been used to assess the presence of injured microorganisms (12, 27). However, whether the injured microorganisms can form colonies depends on the incubation conditions, specific microorganisms, stress factor, and degree of injury, even on non-selective media (24). Some stressed microorganisms can recover, but some cannot recover the ability to proliferate and subsequently become non-culturable. As a result, the number of stressed microorganisms will be underestimated (Figure 2).
Furthermore, the number of colony-forming units (CFU) represents culturable instead of non-culturable microbes, and does not provide a distinction between live or dead (viable or non-viable). To judge the “death” of a microbe is very difficult and perhaps impossible. Injured microorganisms may have recovered and then proliferated, or may have not. As a result of this potential to miss live, injured organisms with conventional culture-based technologies, due to the often limited incubation time and growth parameters used, the characteristic phenomena of growth-delay and loss of culturability are often utilized in the pharmaceutical and food industries in an effort to detect injured microorganisms. This is of particular importance because the existence of injured microorganisms can cause false negatives and result in an underestimate of the total number of microbes during a microbiological inspection test.
The purpose of this study is to investigate the ability of an intrinsic fluorescence-based bioaerosol detection RMM system to detect stressed microorganisms due to the current relevance of such detection ability in the pharmaceutical and food industries (20). In order to achieve this purpose, the detection ability of the intrinsic fluorescence-based bioaerosol detection system was compared to that of the traditional culture-based method currently used in industry, and the impact of applied heat-stress on the detection performance of the intrinsic fluorescence-based bioaerosol detection system was investigated. Although it is generally difficult to control the degree of injury to bacterial cells, heat-stressed bacteria have been most commonly investigated because they are easier to prepare than those treated by other stress factors (12, 24, 27⇓⇓–30). This group has previously researched how to control the injury level of bacteria due to heat stress (25). When designing an experiment using injured bacteria, the issue of preparing injured bacteria with the desired injury level was encountered. Therefore, a variety of temperature and exposure time combinations were utilized, in this previous research, when stressing bacterial samples. From this testing, a linear correlation was found between the length of the growth delay and the amount of heat load applied to the bacterial suspension. The heat load was calculated by integrating the total heating state monitoring result, which contained temperature results as a function of time. Due to this linear relationship, heat stress can be easier to control than other stress factors. Therefore, heating was chosen as the stress factor in this study. The Azbil BioVigilant IMD-A® was selected as the commercially available, LIF-based RMM. The performance of the IMD-A was compared to that of three traditional air samplers, the surface air sampler SAS Super 100 (pbi, Milan, Italy), the microbial air monitoring system MAS-100 NT (Merck, Darmstadt, Germany), and the sterilizable microbiological atrium SMA (Veltek Associates, Malvern, PA), in the detection of heat-stressed Escherichia coli, Staphylococcus epidermidis, and Bacillus atrophaeus spores. These bacteria were selected because they are industry-relevant organisms commonly found in various manufacturing environments that represent a Gram-positive, Gram-negative, and spore-forming bacteria, respectively.
Materials and Methods
Bacterial Strains and Culture Condition
Staphylococcus epidermidis ATCC 12228 was obtained from the RIKEN BioResource Center (Tsukuba, Japan), and Escherichia coli ATCC 13706 was obtained from the American Type Culture Collection (ATCC, Manassas, VA). Bacillus atrophaeus ATCC 9372 spores were obtained from NAMSA (Toledo, OH). These bacteria were selected because they are industry-relevant organisms commonly found in various manufacturing environments. S. epidermidis and E. coli were used as a typical Gram-positive (G+) and Gram-negative (G−) bacteria, respectively. B. atrophaeus spores were used to represent spore-forming bacteria. All bacteria were cultured at 32 °C, using soybean casein digest broth (SCDB), also known as tryptic soy broth (TSB) (Becton Dickinson, Franklin Lakes, NJ), and soybean casein digest agar (SCDA), also known as tryptic soy agar (TSA) (Eiken Chemical, Tokyo, Japan). The suspension of B. atrophaeus spores was transferred to another tube from the original vial after delivery, and stored at 4 °C with protection from light.
Aliquots of S. epidermidis and E. coli glycerol stock were inoculated in SCDB and cultivated aerobically at 32 °C overnight. These cells were then streaked on SCDA and cultivated at approximately 32 °C for 20 to 24 h to achieve the stationary phase. After cultivation, cells were harvested in filtered, sterilized distilled water (DW) with a sterilized disposable loop, and suspended by gentle vortexing. The cells were then washed by centrifugation at 2100g for 3 min with model 2410 centrifuge (Kubota). The supernatant was removed, and the pellet was resuspended in filtered DW by mild pipetting. The optical density at 600 nm (OD600) was then measured using a spectrometer (GeneQuant Pro, GE Healthcare, Chalfont, UK) to estimate bacterial cell concentration. The suspension was diluted with filtered DW to achieve each target concentration. B. atrophaeus spore suspensions were directly diluted from the stock suspension to the target concentration with filtered DW.
Loading Heat Stress on Bacteria
After a bacterial suspension was prepared as above, it was diluted to approximately OD600 = 0.4 with filtrated DW. The suspension was then divided in two. One aliquot was used for the heat-stressed sample, and the other for the untreated sample as a control (Figure 3). One milliliter of each suspension was placed into a 2 mL centrifuge tube, which was then heated at the predetermined temperature and time for each bacterial sample using a dry thermo unit DTU-18 (Taitec, Saitama, Japan). S. epidermidis was heated at 47 °C for 15 min, E. coli at 55 °C for 8 min, and the B. atrophaeus spores at 95 °C for 15 min. These heating conditions were intended to produce an injury-level of approximately 50% injured bacteria based on the previous study (24, 25). After the suspensions were heated, tubes were cooled down to less than 25 °C by putting them in room temperature DW. Concurrently, the control suspension was kept at room temperature while the heat-stressed suspension was being heated and cooled. The control suspension was used for confirmation of the injury. Temperature of the sample was confirmed by monitoring the temperature of a tube filled with DW, which was heated along with the actual cell suspension, using a temperature sensor (HD-1500K and SF-K-050-ASP, Anritsu Meter Co., Ltd., Tokyo, Japan).

Experimental overview of the chamber test. Heat-stressed bacteria and non-heat-stressed bacteria were separately prepared and tested.
To judge the injury level of the heat-stressed sample, CFU and length of growth delay were investigated. In this paper, the CFU ratio of stressed bacteria to unstressed bacteria, on non-selective agar media, indicates potential viability and culturability. In addition to the CFU ratio, growth delay time is used as an indicator of the injury level of the bacteria. Growth delay is particularly useful to prove the existence of injured, not killed, bacteria in the suspension (24⇓–26, 28, 29). After heat treatment, the suspension and control (unstressed bacterial suspension described above) were diluted with filtered DW to the appropriate concentration. The number of CFU was determined by surface spreading an aliquot of the suspension on SCDA with cultivation at 32 °C for approximately 24 h. Furthermore, after incubation for a few days more, it was investigated whether the number of colonies continued to increase.
To measure the length of the growth delay, the heat-stressed and control suspensions were diluted with filtered DW to achieve OD600 = 0.3, 50 μL of the diluted suspension was inoculated in 5 mL of SCDB in a test tube, and then this inoculation was cultivated at approximately 32 °C aerobically. Optical density (OD) was measured with an automatic, non-contact OD meter OD-Monitor C & T (Taitec). The time to reach OD600 = 1 in the stressed and control samples was determined, with the growth delay defined as the extended time to reach OD600 = 1 in the stressed sample as compared to the control.
Although a growth delay was observed with the recovery of injured cells, the initial number of inoculated cells can also influence the determined growth delay. In other words, not only the injury level, but also the initial amount of bacteria influences the length of the lag phase (28). Therefore, the inoculum concentration was controlled by obtaining an OD600 = 0.3 at the start of cultivation for determining the growth curve. Additionally, in order to confirm that the growth delay was caused by injured, live cells, we also investigated the length of the lag phase of suspensions with several different initial OD values. We examined the length of the lag phase at the initial OD600 = 0.225, 0.15, 0.075, and 0.03 (75%, 50%, 25%, and 10% of OD600 = 0.3, respectively) using unstressed bacteria.
Apparatus of the Chamber Test
An approximately 3 m3 chamber was used to test the performance of the intrinsic fluorescence-based bioaerosol detection systems and air samplers. A high-efficiency particulate air (HEPA) filter unit (EC-MAC, Airtech Japan, Tokyo, Japan) with a 10 m3/min capacity and small mixing fans were placed in the chamber in order to clean and mix the air. A nebulizer, reference number 8900 (Salter Labs, Arvin, CA), was located in the center of the chamber with a laboratory stand to generate bioaerosols, and pressurized air was supplied for nebulization. The flow rate for nebulization was controlled at 5 L/min. To monitor the total particle number inside the chamber during testing, a laser particle counter (LPC) (Aero Trak, TSI, St. Paul, Minnesota) was used, and particles larger than 0.5 μm were counted.
An IMD-A® 300 system and IMD-A® 350 system (Azbil BioVigilant, Tucson, AZ) were used in this chamber test as intrinsic fluorescence-based bioaerosol detection systems. These optically based instruments employ a 405 nm laser to simultaneously induce Mie scatter and intrinsic fluorescence as a sample aerosol traverses this excitation source. Detection and correlation of the Mie scatter and fluorescence signals provide real-time information on the size and biologic status, respectively, of particles within the sample on a particle-by-particle basis. The IMD-A 300 system samples air at a rate of 1.15 L/min, while the IMD-A 350 system samples air at a rate of 28.3 L/min. To enable sampling at a higher flow rate, the IMD-A 350 system utilizes an internal aerosol concentrator to draw in air at the higher flow rate and then concentrate it into a 1.15 L/min air stream. The system specification lists a particle size range of 0.5 μm to >10 μm in size, with a biologic detection capability including vegetative cells, bacterial spores, and fungi. The systems' detection performance has previously been assessed based on regulatory guidance in USP <1223> and EP 5.1.6 (18, 19, 31).
The surface air sampler SAS Super100, the microbial air monitoring system MAS-100NT, and the sterilizable microbiological atrium SMA were also used in the chamber test to represent the traditional method. These portable air samplers are commonly used in the pharmaceutical and food industries. The sampling flow rate of the SAS and MAS is 100 L/min, and that of the SMA was controlled at 28.3 L/min using a flow controller CMS (Azbil Corporation, Tokyo, Japan) with an external vacuum pump.
All joints of the chamber were tightly sealed and the absence of leakage was confirmed. The particle uniformity inside the chamber was also confirmed to be at an acceptable level. To sample bioaerosols, air samplers were connected to the ports on the side of the chamber, which were opened and closed automatically by computer.
Methodology of the Chamber Test
The chamber test was carried out according to the previous study (32), as shown in Figure 3, at 22 °C room temperature and 50% relative humidity. The chamber was preliminarily wiped with DW and 70% ethyl alcohol to remove small particles and microorganisms from the inside wall. After tightly closing the chamber door, the inside air was cleaned by running HEPA filter unit and mixing fans. The bacterial aerosol was then nebulized and uniformly dispersed within the chamber through the use of the mixing fans. The IMD-A systems, air samplers, and particle counter were then run, sampling the environment simultaneously. The chamber air was then cleaned by HEPA filter, and air sampler SCDA plates were replaced. This cycle was repeated 12 times. The recovered plates were cultivated for about 24 h at approximately 32 °C and CFU counts were obtained. Cultivation was continued for a few additional days to obtain the increase in colony numbers after extended incubation, and final CFU numbers determined. Biologic counts from the IMD-A systems and CFU counts from the air samplers were normalized to the total particle count from the LPC in order to compare these values. The test using non-stressed bacteria was also performed independently, as a negative control using the same procedure described above (Figure 3).
Results
Heating State Monitoring
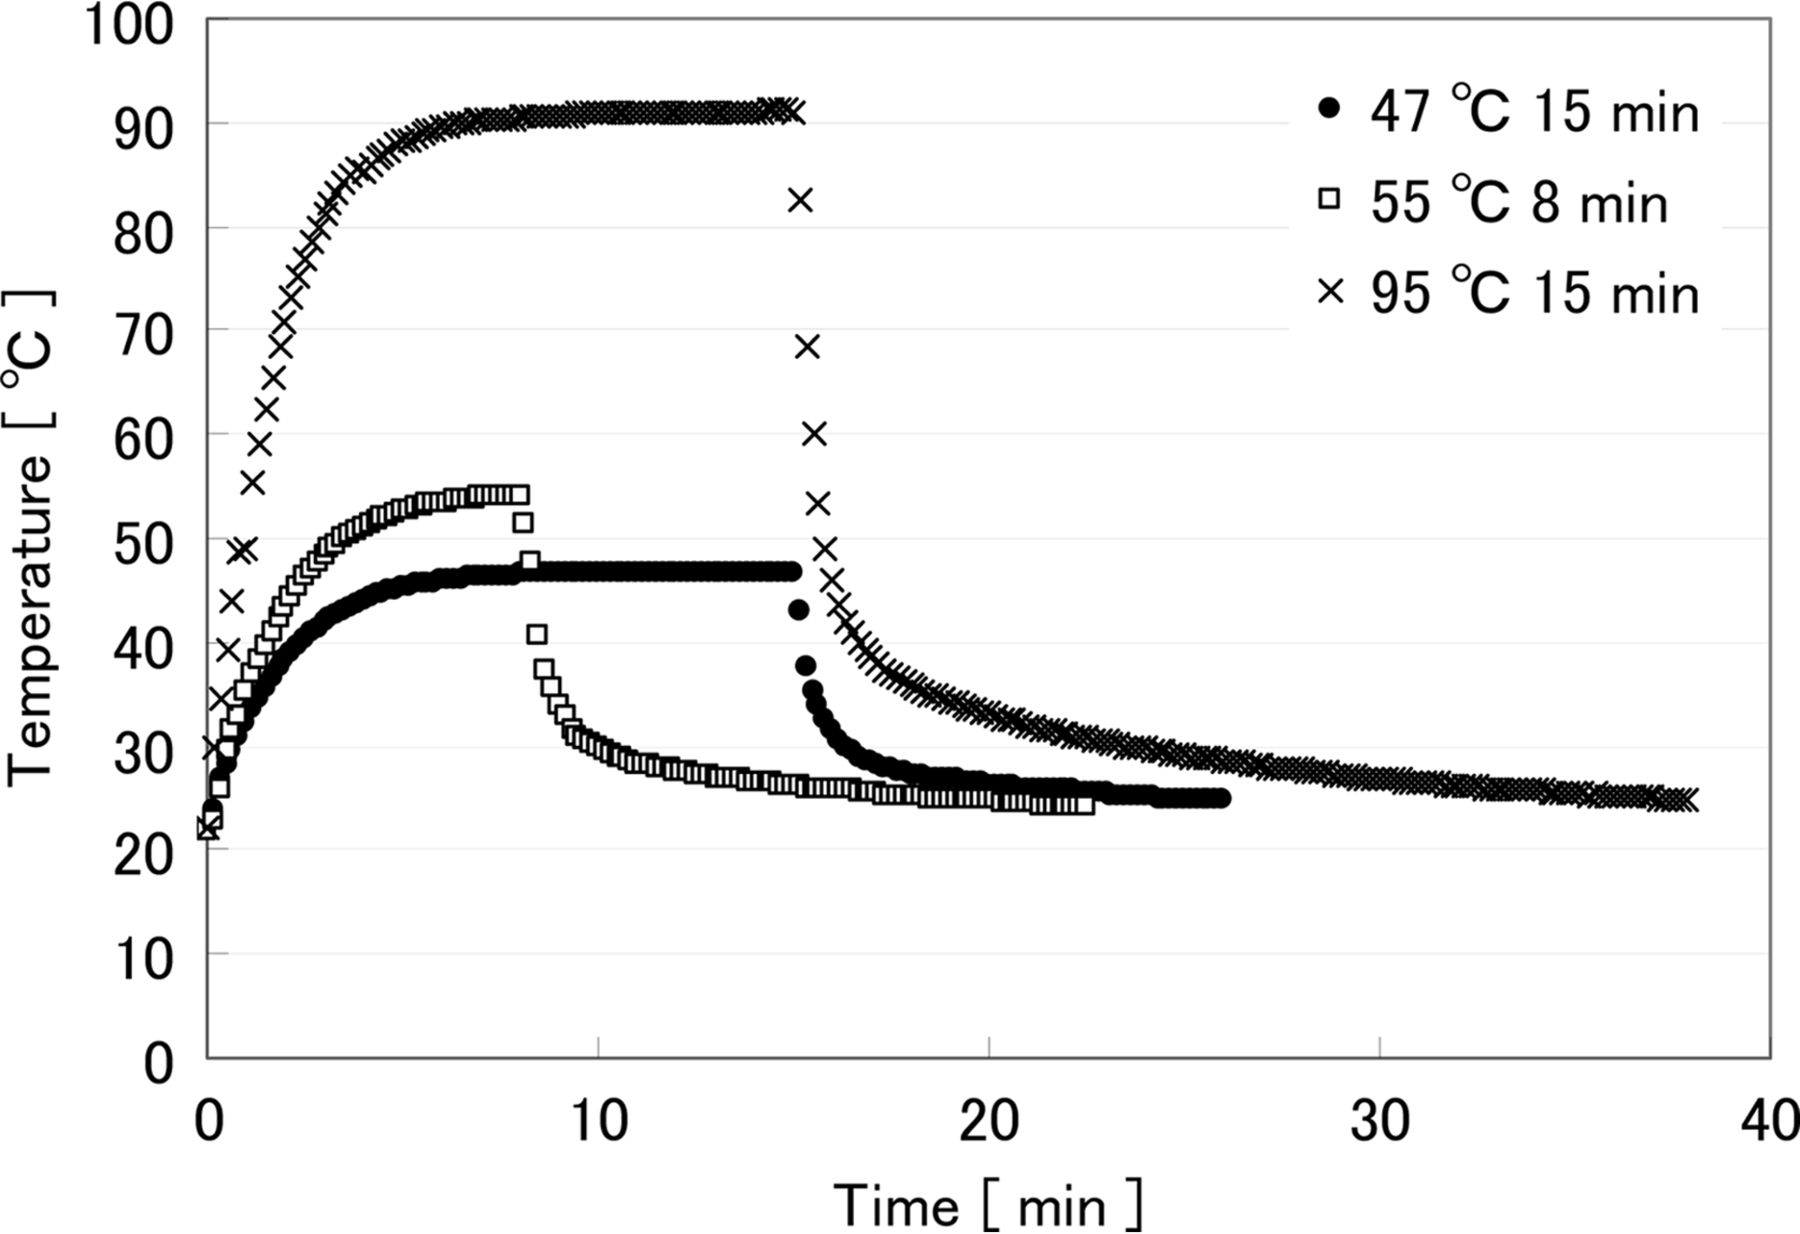
The results of temperature monitoring are shown in Figure 4. Due to the different target temperatures and overall heating times, a unique temperature profile is shown for each of the organisms tested, with a different proportion of the overall heating time required to reach the target temperature. Most articles refer only to the preset, or target, temperatures and overall heating and cooling time. However, it is important to consider the full heating and cooling profile because the entire treatment may affect injury delicately (25) and can provide important information on the real condition of the heat stress.

Temperature profile during heat treatment. •: Preset 47 °C 15 min for S. epidermidis, □: Preset 55 °C 8 min for E. coli, ×: Preset 95 °C 15 min for B. atrophaeus, spore.
Chamber Test Results
i. Injury Level Check Determined by CFU and Growth Delay Method
The number of CFU/mL as a function of cultivation time for S. epidermidis, E. coli, and B. atrophaeus spores are shown in Figure 5, and the ratio of heat-stressed bacteria CFU to non-heat-stressed bacteria is shown in Table I. CFU values represent the average of the 12 replicates performed. As shown in Figure 5, visible CFU of heat-stressed bacteria significantly increased after additional incubation compared to the non-heat-stressed samples. This was seen when plating the nebulization suspensions (Figure 5a) and in air sampler plate results (Figure 5b). The non-heat-stressed bacteria controls show visible colonies after incubation for approximately 24 h, and no more colonies appeared with additional incubation. On the other hand, visible colonies appeared during the additional incubation period in heat-stressed samples. This indicates the presence of slow-growing cells in the heat-stressed suspensions. Furthermore, some smaller colonies were observed on the stressed suspension plates, but all colonies were essentially the same size in the control samples (data not shown). This result is consistent with previous research (24). It is believed that the smaller colonies originate from slow-growing, stressed cells, indicating that heat-stressed cells were present in the suspension. Furthermore, as seen in Table I, the number of CFU obtained from plating the nebulization suspension for each of the three bacteria was approximately half of the number of CFU in the control sample for all bacteria. Therefore, roughly a 50% injury level was possible for each microbe, as expected. CFU results from the air samplers were often lower than the results obtained from plating the nebulization suspension directly, before aerosolization (Table I). This was seen in a majority of the air sampler results, although for E. coli the SAS and SMA showed a higher CFU ratio to the control than when plating the nebulization suspension. This indicates that heat-stressed bacteria may have been additionally stressed during nebulization and capture by the air samplers, although this impact was not significant compared to that of the heat stress (26).

Time course of (a) colony number of nebulizing suspension and (b) recovered air by air samplers.
(a) The control was the sample without heat treatment, which was divided from the same harvested cells as the heated sample. It was used only for confirmation of injury level of the heated sample, and not nebulized for the chamber test as shown in Figure 3. CFU were obtained by surface spreading. The results show injury level of nebulizing suspension due to the increase in CFU seen in the heat-stressed sample with incubation time as compared to the control sample.
(b) The non-heat-stressed sample was used for the chamber test as an independent experiment from the heat-stressed sample. Because the “control” sample was divided from the same harvested cells utilized in the heat-stressed sample, the control could not be tested simultaneously in the test chamber. Therefore, these tests utilized the non-heat-stressed sample as the negative control in the chamber test. It was confirmed that the “control” and “non-heat-stressed” samples showed no significant difference in CFU and growth delay.
The Rate of Culturability of Heat-Stressed Bacteria
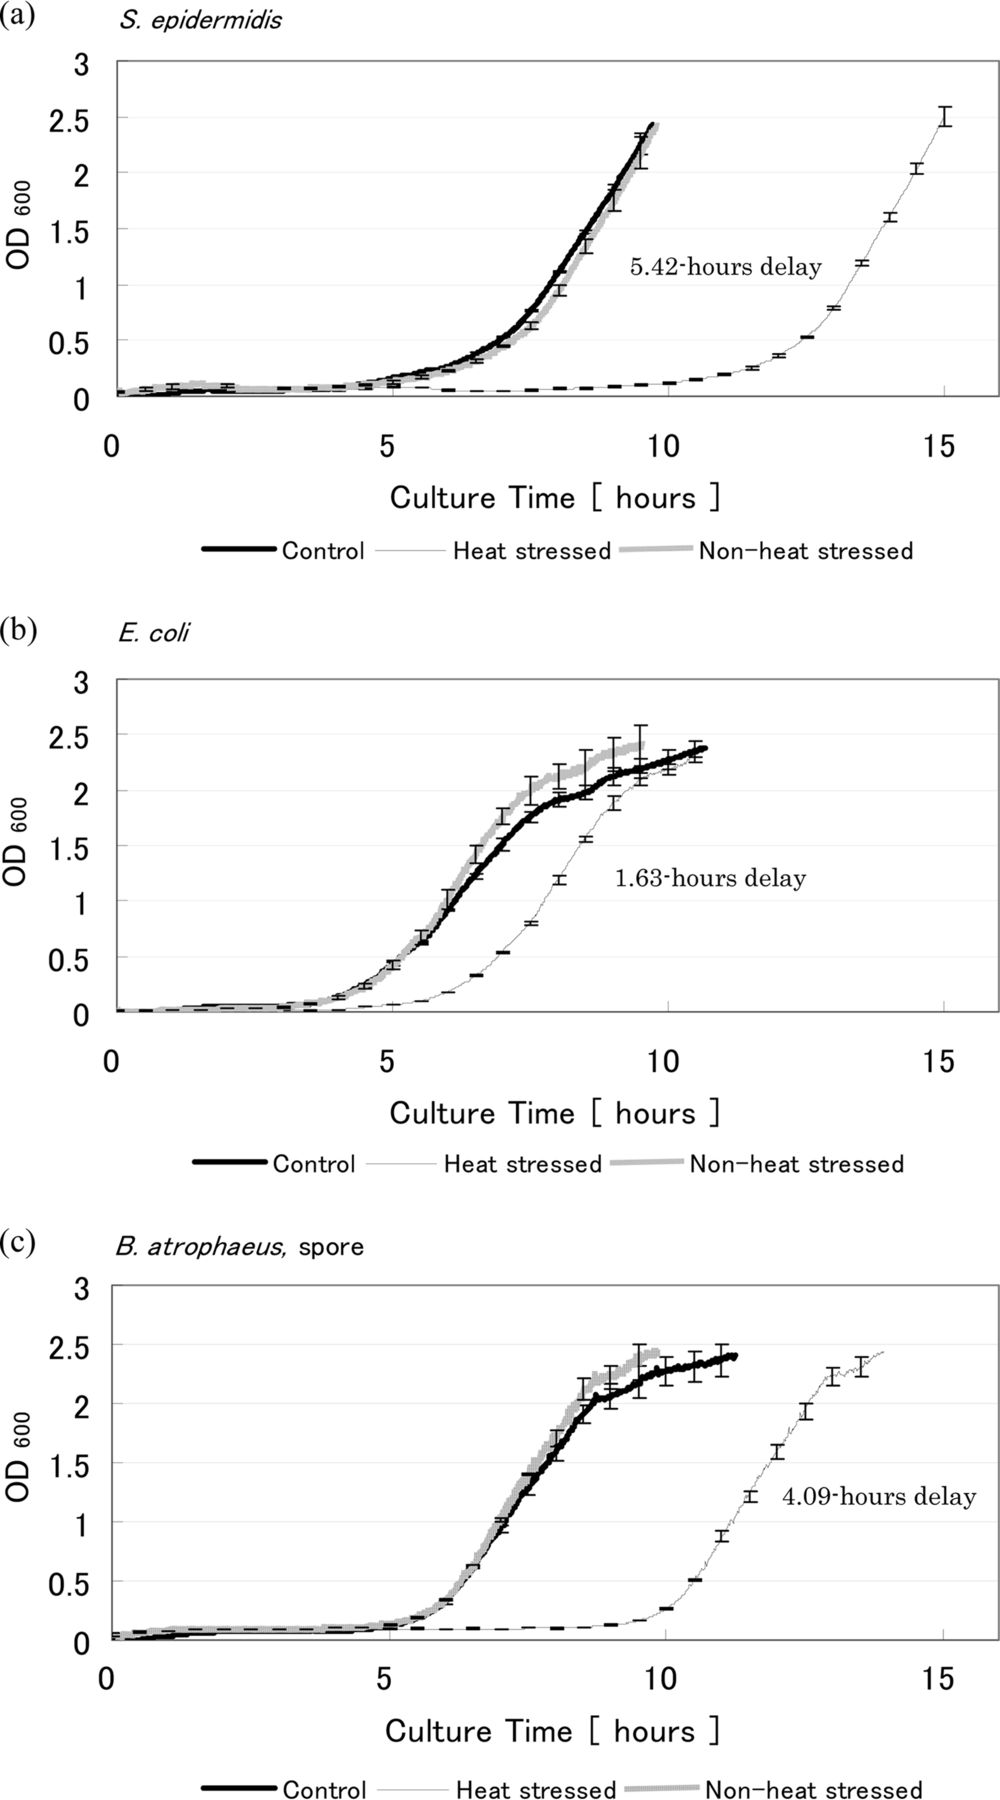
Growth curves are shown in Figure 6. As can be seen, the control and non-heat-stressed suspension growth curves are very similar, as expected. This implies that these cells can be considered to be in the same biological condition and therefore the non-heat-stressed sample can be regarded as a negative control. The increase in OD, representative of the log phase, has shifted to the right for the heat-stressed bacteria, indicating an extension of the lag phase and that a growth delay has occurred. The heat-stressed sample of S. epidermidis, E. coli, and B. atrophaeus spore showed a 5.42, 1.63, and 4.09 h growth delay compared to the control, respectively.

Growth curves for stressed and non-stressed (a) S. epidermidis, (b) E. coli, and (c) B. atrophaeus, spore. The definition of control and non-heat-stressed are described in the Materials and Methods section and the caption of Figure 5.
The delay time of the non-heat-stressed bacterial samples was also investigated, at various initial OD values. The results are shown in Table II. All samples show some growth delay in the lag phase compared to the OD600 = 0.3 sample. However, the length of the growth delay for these samples was not longer than those of the heat-stressed samples, except for E. coli at an OD600 = 0.03. Heat-stressed bacterial samples showed between 40% to 59% of the CFU of the non-heat-stressed sample in the nebulizer suspensions (Table I). When comparing the length of the heat-stressed bacteria growth delay with that of the non-heat-stressed bacteria at 50% initial OD (OD600 = 0.15), a longer growth delay was seen in the stressed samples. However, growth delay alone is not a conclusive indication of stress, which is why multiple parameters were assessed. Considering the growth delay, the variety of colony size and increase in colony number after additional incubation time, it is reasonable to conclude that the heat-stressed samples included injured cells in addition to intact, dead, and probably VBNC cells, and that these samples can be used as stressed bacteria.
Growth Delay at Various Initial OD
ii. Comparison of the Intrinsic Fluorescence-Based Bioaerosol Detection System and Air Samplers
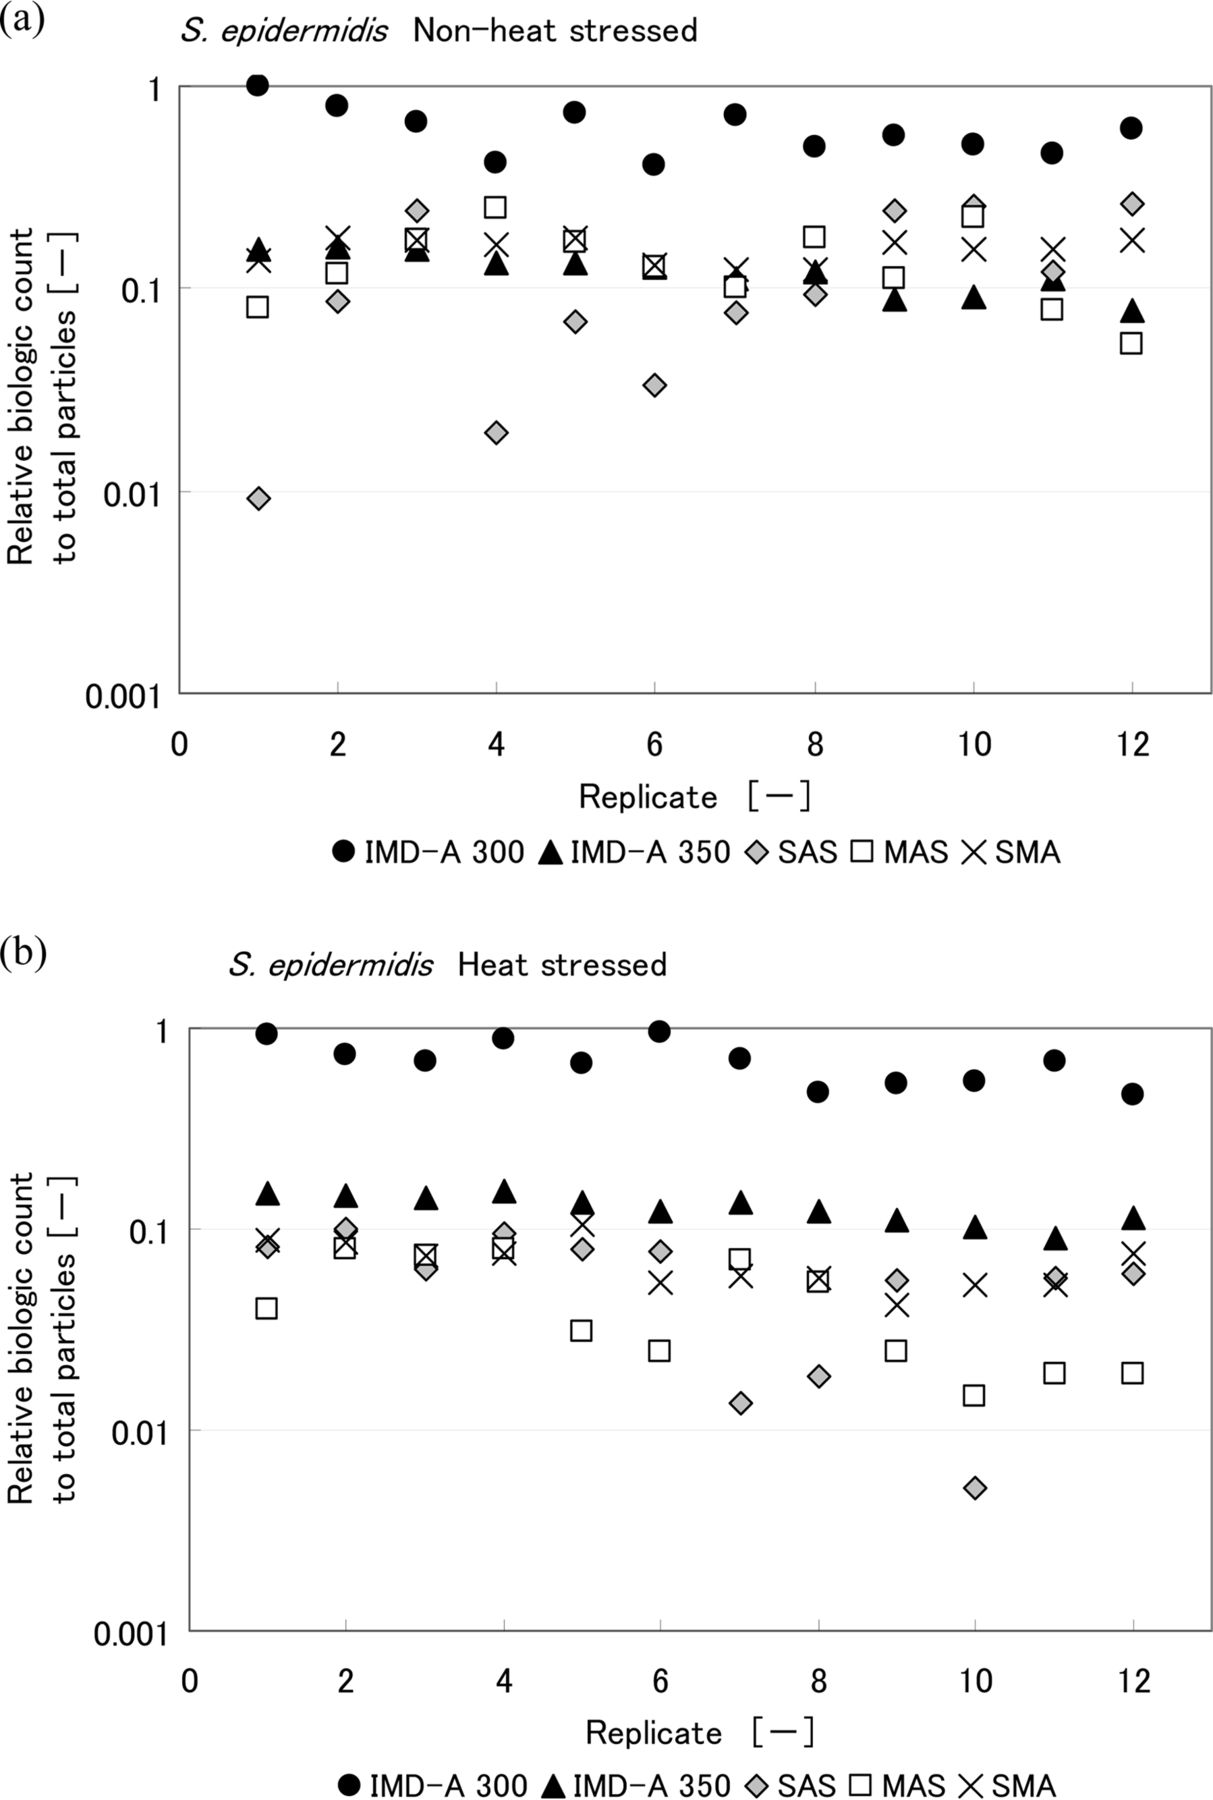
Comparisons of the results obtained with the intrinsic fluorescence-based bioaerosol detection systems and air samplers are shown in Figures 7, 8, and 9. CFU counts represent the final CFU count obtained after a few days incubation. Values are reported for each of the 12 replicates performed. Table III summarizes the ratio of biological count, as reported by the IMD-A systems, to total LPC particle count. Looking at these results, the numbers of CFU obtained by the three air samplers for heat-stressed bacteria were lower than for non-heat-stressed bacteria. On the other hand, no significant difference was observed in the number of biologic counts reported by the intrinsic fluorescence-based bioaerosol detection systems. The IMD-A 300 system counted more biological particles per liter than the IMD-A 350 system because of the efficiency loss seen as a result of the concentrator in the IMD-A 350 system.

Relative biologic count to total particle number obtained from IMD-A systems and air samplers during the chamber test of (a) non-heat-stressed and (b) heat-stressed S.epidermidis. Biologic count of IMD-A systems is the number of bio counts reported by the IMD-A system, and that of air samplers means colony number per unit volume.

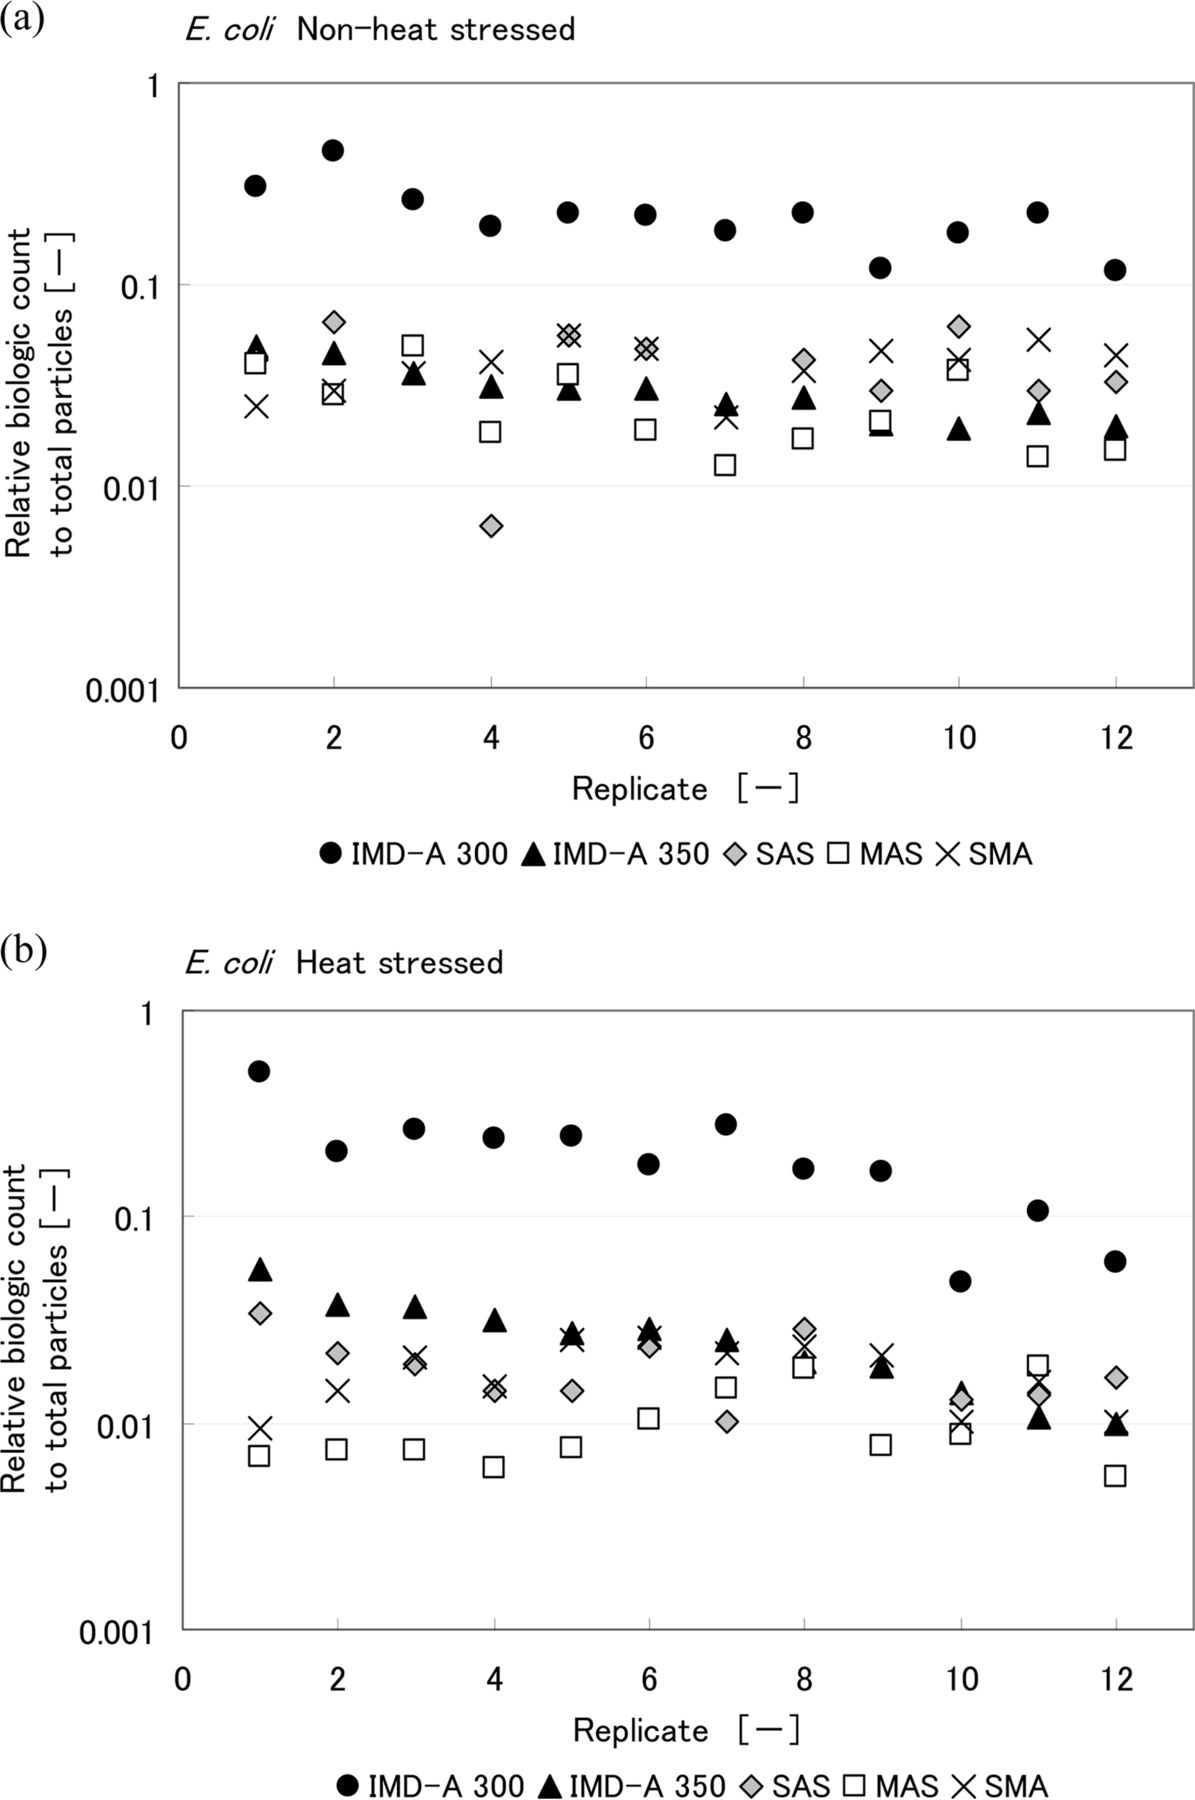
Relative biologic count to total particle number obtained from IMD-A systems and air samplers during the chamber test of (a) non-heat-stressed and (b) heat-stressed E. coli. Biologic count of IMD-A systems is the number of bio counts reported by the IMD-A system and that of air samplers means colony number per unit volume.

Relative biologic count to total particle number obtained from IMD-A systems and air samplers during the chamber test of (a) non-heat-stressed and (b) heat-stressed B. atrophaeus, spore. Biologic count of IMD-A systems is the number of bio counts reported by the IMD-A system and that of air samplers means colony number per unit volume.
Summary of Relative Biologic Count to Total Particle Number Obtained from the IMD-A Systems and Air Samplers
iii. Scatter versus Fluorescent Plots of Intrinsic Fluorescence-Based Bioaerosol Detection System
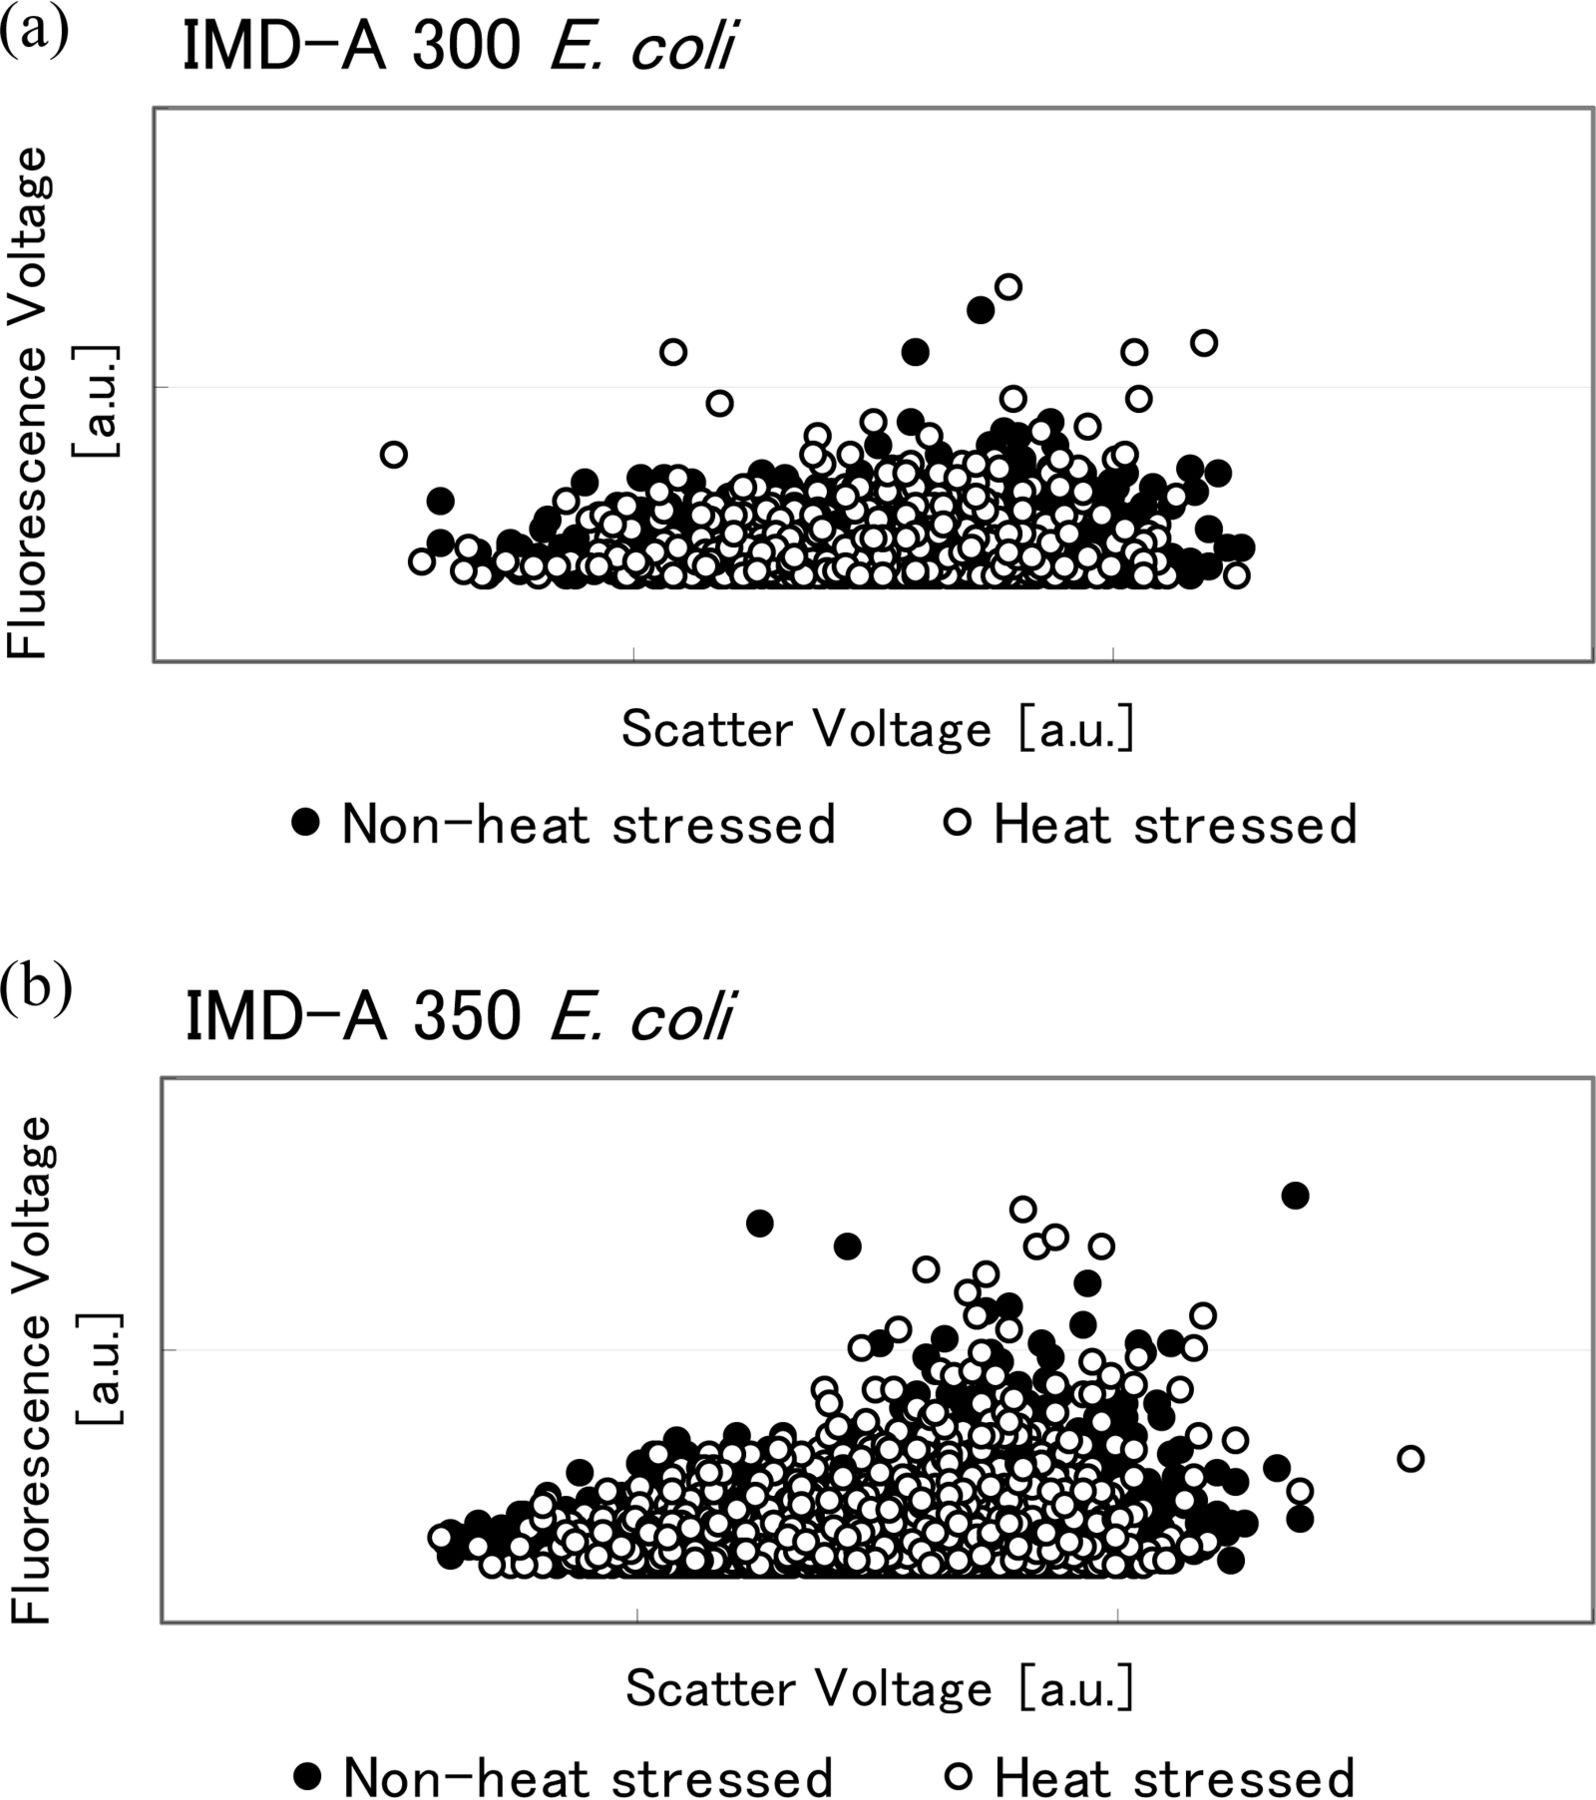
As discussed above, IMD-A systems assess both a particle's scatter and fluorescence intensity simultaneously. Figures 10, 11, and 12 show this information in fluorescence versus scatter plots of the heated and non-heated samples. According to these graphs, no significant change occurred in bacterial cell size, that is, scatter or fluorescence intensity between heated and non-heated cells for both S. epidermidis and E. coli. However, fluorescence intensity decreased with heat treatment in the B. atrophaeus spores. B. atrophaeus spores usually show faint green fluorescence, with 400–410 nm excitation, under the fluorescence microscope. However, in this study the non-heated spores showed a slightly stronger blue fluorescence while heat-treated spores showed the green fluorescence usually observed for B. atrophaeus spores. This change also appears to be detected by the IMD-A systems, as seen in the fluorescence versus scatter plots in Figure 12 (we will discuss this topic more in the discussion section).

Scatter versus fluorescence plots of fluorescence-based bioaerosol detector (a) IMD-A 300 and (b) IMD-A 350 system data for S. epidermidis.

Scatter versus fluorescence plots of fluorescence-based bioaerosol detector (a) IMD-A 300 and (b) IMD-A 350 system data for E. coli.

Scatter versus fluorescence plots of fluorescence-based bioaerosol detector (a) IMD-A 300 and (b) IMD-A 350 system data for B. atrophaeus, spore.
Discussion and Conclusions
An investigation into the ability of intrinsic fluorescence-based bioaerosol detection RMMs, specifically the IMD-A systems, to detect stressed organisms was undertaken. In this study, IMD-A systems showed an increased sensitivity in the detection of heat-stressed organisms as compared to three traditional air samplers. This result varies from past research performed on the sensitivity of an intrinsic fluorescence-based bioaerosol detection RMM with heat-stressed bacteria (12). As shown in Table III, no significant difference was observed in the IMD-A systems' detection ability for non-heat-stressed as compared to heat-stressed bacteria, but all three air samplers showed a decreased ability to detect stressed cells for S. epidermidis, E. coli, and B. atrophaeus. Based on the premise that the intrinsic fluorescence-based bioaerosol detection systems can detect not only healthy bacteria but also injured and VBNC bacteria, the intrinsic fluorescence-based bioaerosol detection systems may have advantages over traditional air samplers. Air samplers rely on a growth-based methodology and thus have an overwhelming inability to detect injured or VBNC state bacteria. Injured bacteria may also be influenced not only by harsh environments and sterilization processes, but also by physical damage due to the air sampling operation itself, with a resulting loss in culturability (26). There is some research that even non-stressed bacteria are likely influenced by physical damage via some kinds of air samplers (33, 34). The most common sampling method is the process of particle impaction, so physical damage by impaction can influence injured bacterial culturability. Additionally, there is research on the collection efficiency of air samplers (35, 36). The collection efficiency of these systems differs depending on the air sampler's model and operation method. One investigation reported that most air samplers collect 10% or less of 0.5 μm particles onto the agar medium (36). Therefore, the microbial detection ability of air samplers may be decreased due to both the limitations of growth-based methodologies and low collection efficiency. Furthermore, systems like the IMD-A have the ability to sample continuously and provide an assessment of the environment in real time. The increased sensitivity to stressed organisms and ability to monitor particulate and microbial counts in the environment continuously make such intrinsic fluorescence-based microbial systems an incredibly powerful addition to conventional pharmaceutical clean room and food manufacturing environments.
The samples utilized in this study contained heat-stressed and injured organisms, not simply 50% live and 50% dead, as determined through an investigation of growth delay. The ability to determine if such injured cells are present depends on the conditions of cultivation: incubating temperature and humidity, aerobic or anaerobic, culture media, and so on. There is some research intent on improving culture media so that it can culture not only healthy bacteria but also injured or VBNC state bacteria (1, 2, 22, 37). It is well known that the non-culturable phenomena can be caused by H2O2 that was generated from either the bacteria itself or culture media. So, some research has mentioned that culture agar media supplemented with reactive oxygen species scavengers, such as catalase or pyruvate, can make a culture media more efficient to recover VBNC bacteria. As a result, SCDA (the non-selective agar media used in this study and commonly used in industry) might not thoroughly detect total viable microbes. Many organisms are not culturable on SCDA under typical culture conditions, and, as such, the traditional culture method may miss a number of organisms (including stressed organisms). This means that “non-culturable” does not necessarily mean “dead”, although this has been a typical view for a long time. In general, it is said that microbial populations exist heterogeneously in pharmaceutical and food industries because of environmental stresses, sterilization processes, and so on (12, 22, 24, 38). Additionally, some researchers have pointed out the danger of injured bacteria resulting in false negatives (22) and the retention of virulence in VBNC state bacteria (2). Therefore, although it may depend on the purpose of the monitoring, microbial measurements demand the detection of not only healthy bacteria but also injured or VBNC state bacteria in general ambient conditions. At least for now, it is assumed that a growth-based methodology cannot provide such robust microbial measurements. Traditional methods may significantly underestimate the total population of viable microorganisms due to their limited ability to detect stressed organisms, namely, organisms that do not grow on SCDA and other common non-selective media, for example, R2A. As a result, new technologies such as the IMD-A may have the ability to cover drawbacks of old technology, and provide a more robust microbial measurement and view of the environment.
In this study, a shift in fluorescence was observed, with the IMD-A systems and a fluorescence microscope, between heat-stressed and non-heat-stressed B. atrophaeus spores. The spore utilized in this study showed a blue color fluorescence, which changed to a faint green color after the heating process. This fluorescent color change may be related to pyridine-2,6-dicarboxlic acid (DPA) content; however, a clear relationship between fluorescent color change and DPA could not be found. In general, bacterial vegetative cells and bacterial spores are composed of different substances. A universal constituent of bacterial spores is dipicolinic acid, which represents 5% to 15% of the total mass but has never been detected in vegetative cells (39). There are some studies that intend to detect spores using a DPA complex as a probe because DPA complexes with lanthanide metals, such as terbium, europium, and dysprosium, are highly fluorescent (39, 40⇓–42). In addition, it is said that DPA is involved in dormancy, wet-heat resistance, and germination of spore-forming bacteria (43). The preservation process might also have affected the DPA or cells because the spore suspension in this study was transferred to another tube, from the original vial, after delivery. Clear reasoning for the fluorescent color change is not known at this stage.
In this study, no significant difference was observed in the IMD-A systems' detection ability for non-heat-stressed as compared to heat-stressed bacteria. However, a study on the effects of heat stress on intrinsic fluorescence has been performed before using the Ultraviolet Aerodynamic Particle Sizer (UV-APS, model 3312, TSI Inc., St. Paul, MN) (12). The conclusion of that study was not the same. The signals of the UV-APS were consistent with the proportion of the injured airborne bacteria (Figure 4 in Reference 12). In the current study, using IMD-A systems, it was found that intrinsic fluorescence did not change between non-heat-stressed and heat-stressed samples, or, if a change was present, this change was not significantly below the sensitivity level of the systems. The different conclusions may be attributed to a difference in excitation wavelength and perhaps differences in experimental methodology as well. This includes how to define the injury level (IMD-A system versus UV-APS; growth delay method as well as CFU ratio by non-selective agar plates versus CFU difference between non-selective and selective agar plate), kind of air samplers (capture microorganisms directly on agar versus impinge microorganisms in liquid), and method of data analysis (CFU per liter and biologic count per liter versus injured bacteria rate and fluorescent particles rate). Previously we tried to define injury level using selective agar plates, but the “non-heat-stressed” (intact) bacterial culturability of SCDA and selective agar plates were different (data not shown). Additionally, it was observed that when bacteria were exposed to heat stress, the culturability on SCDA and the selective agar plate both decreased, although the rate of decrease on the selective agar plate was a little higher than on the non-selective agar plate. Therefore, selective agar was not utilized to define injury level in this study. Another reason that results may have differed between the two intrinsic fluorescence-based systems lies in the difference in excitation wavelength. The IMD-A systems excite cells with a 405 nm excitation source, while the UV-APS utilizes a 355 nm excitation source (12). There are four major cellular fluorophores, tryptophan, pyridoxine, NAD(P)H, and riboflavin, that are key metabolic components in cells (10). The fluorescence emission spectra of NAD(P)H and riboflavin overlap if both are excited at 365 nm, a wavelength similar to the excitation source in the UV-APS (10). However, at 404 nm NAD(P)H fluoresces to a lesser degree, but riboflavin strongly fluoresces (10). This wavelength is very close to the excitation wavelength of the IMD-A systems. Previously, this group investigated the quality of heat-stressed bacteria samples with fluorescence staining dye 5-Cyabo-2,3-ditolyl-2H-tetrazolium chloride (CTC, Dojindo Molecular Technologies, Inc., Kumamoto, Japan) (44). CTC can detect the NAD(P)H, which is related to respiratory activity in a cell. According to the previous study, heat-stressed bacterial viability evaluated by CTC was found to be the same or slightly lower than when evaluated by the culture method. Therefore, the quantity of NAD(P)H in a cell may be easily influenced by changes in respiratory activity caused by heat stress. Based on excitation wavelength, the UV-APS detects cellular intrinsic fluorescence mainly derived from both NAD(P)H and riboflavin. There is potential that the signals of the UV-APS were consistent with the proportion of the injured airborne bacteria because NAD(P)H may be easily influenced by heat stress, potentially having a significant impact on the detected level of intrinsic fluorescence. Therefore, an impact was seen both in the culturability of the heat-stressed cells and in their fluorescence, as measured by the UV-APS system. On the other hand, the 405 nm excitation wavelength of the IMD-A system is likely somewhat less susceptible to changes in NAD(P)H fluorescence. Although both riboflavin and NAD(P)H are detected by the IMD-A system, the system has a higher sensitivity to riboflavin. It is concluded that the biological counts of the IMD-A were almost the same between heat-stressed and non-heat-stressed bacteria because riboflavin may not be easily influenced by heat stress and the measured level of fluorescence was above the sensitivity of the system. Perhaps, intrinsic fluorescence-based bioaerosol detection systems based more significantly on NAD(P)H fluorescence intensity may have the potential risk of false-negatives, especially for stressed organisms. However, the difference in sensitivity between the two systems is unknown and conclusions are based only on the above findings and comparison with literature. Consideration of the excitation wavelength is an important element when investigating the differing results obtained with these systems. Moreover, it is important to consider the basic biological mechanism that occurs as a result of factors such as applied stress to the cell, as this can affect the quantity of various fluorophores present. Information on this basic mechanism may be derived from the relationship between excitation wavelength and the quantity of fluorophores in the cell when it is in various states.
Intrinsic fluorescence-based bioaerosol detection systems like the IMD-A can provide a new level of information, not currently permitted with traditional air samplers, due to their potential for continuous monitoring and detection of non-culturable microbes. Broad knowledge of an RMM system's performance, such as its ability to detect stressed organisms, is important in gaining an understanding of the new technology and its capabilities. Stressed microorganisms are common in pharmaceutical and food manufacturing facilities, and the ability to detect such organisms is imperative to providing a more robust assessment of the environment. In this study, it was found that heat stress has a larger impact on culturability than on intrinsic fluorescence when utilizing an intrinsic fluorescence-based bioaerosol detection system with a 405 nm excitation source. This research is just one step in investigating the relationship between biological cell condition, culturability, and intrinsic fluorescence. Further investigation is still needed to better understand factors that may affect intrinsic fluorescence and its detection.
Conflict of Interest Declaration
The author(s) declare that they have no competing interests.
Acknowledgements
We would like to thank Ms. Ayako Kowada for her technical assistance with microbial experimental manipulation. We also thank our laboratory team involved in the project and our colleagues for their support.
Footnotes
IMD-A is a registered trademark or trademark of U.S.-based Azbil BioVigilant, Inc. in the United States and other countries.
- © PDA, Inc. 2014
References


Jump to section
Related Articles
Cited By...
- Challenges Encountered in the Implementation of Bio-Fluorescent Particle Counting Systems as a Routine Microbial Monitoring Tool
- Clinical Data on Hospital Environmental Hygiene Monitoring and Medical Staff Protection during the Coronavirus Disease 2019 Outbreak
- Validation of Milliflex(R) Quantum for Bioburden Testing of Pharmaceutical Products