
Abstract
Demonstrating suitability for intended use is necessary to register packaging, delivery/administration, or manufacturing systems for pharmaceutical products. During their use, such systems may interact with the pharmaceutical product, potentially adding extraneous entities to those products. These extraneous entities, termed leachables, have the potential to affect the product's performance and/or safety. To establish the potential safety impact, drug products and their packaging, delivery, or manufacturing systems are tested for leachables or extractables, respectively. This generally involves testing a sample (either the extract or the drug product) by a means that produces a test method response and then correlating the test method response with the identity and concentration of the entity causing the response. Oftentimes, analytical tests produce responses that cannot readily establish the associated entity's identity. Entities associated with un-interpretable responses are termed unknowns. Scientifically justifiable thresholds are used to establish those individual unknowns that represent an acceptable patient safety risk and thus which do not require further identification and, conversely, those unknowns whose potential safety impact require that they be identified. Such thresholds are typically based on the statistical analysis of datasets containing toxicological information for more or less relevant compounds.
This article documents toxicological information for over 540 extractables identified in laboratory testing of polymeric materials used in pharmaceutical applications. Relevant toxicological endpoints, such as NOELs (no observed effects), NOAELs (no adverse effects), TDLOs (lowest published toxic dose), and others were collated for these extractables or their structurally similar surrogates and were systematically assessed to produce a risk index, which represents a daily intake value for life-long intravenous administration. This systematic approach uses four uncertainty factors, each assigned a factor of 10, which consider the quality and relevance of the data, differences in route of administration, non-human species to human extrapolations, and inter-individual variation among humans. In addition to the risk index values, all extractables and most of their surrogates were classified for structural safety alerts using Cramer rules and for mutagenicity alerts using an in silico approach (Benigni/Bossa rule base for mutagenicity via Toxtree). Lastly, in vitro mutagenicity data (Ames Salmonella typimurium and Mouse Lymphoma tests) were collected from available databases (Chemical Carcinogenesis Research Information and Carcinogenic Potency Database).
The frequency distributions of the resulting data were established; in general risk index values were normally distributed around a band ranging from 5 to 20 mg/day. The risk index associated with 95% level of the cumulative distribution plot was approximately 0.1 mg/day. Thirteen extractables in the dataset had individual risk index values less than 0.1 mg/day, although four of these had additional risk indices, based on multiple different toxicological endpoints, above 0.1 mg/day. Additionally, approximately 50% of the extractables were classified in Cramer Class 1 (low risk of toxicity) and approximately 35% were in Cramer Class 3 (no basis to assume safety). Lastly, roughly 20% of the extractables triggered either an in vitro or in silico alert for mutagenicity. When Cramer classifications and the mutagenicity alerts were compared to the risk indices, extractables with safety alerts generally had lower risk index values, although the differences in the risk index data distributions, extractables with or without alerts, were small and subtle.
LAY ABSTRACT: Leachables from packaging systems, manufacturing systems, or delivery devices can accumulate in drug products and potentially affect the drug product. Although drug products can be analyzed for leachables (and material extracts can be analyzed for extractables), not all leachables or extractables can be fully identified. Safety thresholds can be used to establish whether the unidentified substances can be deemed to be safe or whether additional analytical efforts need to be made to secure the identities. These thresholds are typically based on the statistical analysis of datasets containing toxicological information for more or less relevant compounds.
This article contains safety data for over 500 extractables that were identified in laboratory characterizations of polymers used in pharmaceutical applications. The safety data consists of structural toxicity classifications of the extractables as well as calculated risk indices, where the risk indices were obtained by subjecting toxicological safety data, such as NOELs (no observed effects), NOAELs (no adverse effects), TDLOs (lowest published toxic dose), and others to a systematic evaluation process using appropriate uncertainty factors. Thus the risk index values represent daily exposures for the lifetime intravenous administration of drugs. The frequency distributions of the risk indices and Cramer classifications were examined. The risk index values were normally distributed around a range of 5 to 20 mg/day, and the risk index associated with the 95% level of the cumulative frequency plot was 0.1 mg/day. Approximately 50% of the extractables were in Cramer Class 1 (low risk of toxicity) and approximately 35% were in Cramer Class 3 (high risk of toxicity). Approximately 20% of the extractables produced an in vitro or in silico mutagenicity alert. In general, the distribution of risk index values was not strongly correlated with the either extractables' Cramer classification or by mutagenicity alerts. However, extractables with either in vitro or in silico alerts were somewhat more likely to have low risk index values.
Introduction
Packaging, delivery, administration, and manufacturing systems used with pharmaceutical products may be constructed from plastic materials. Such systems are demonstrated to be suited for their intended use by establishing their ability to
protect the pharmaceutical product (such as a drug product or solution) that is either stored in the packaging system, delivered, or administered through or via the medical device, or manufactured with a manufacturing system,
be compatible with the pharmaceutical product,
be safe when used with the pharmaceutical product, and
function properly when used with the pharmaceutical product under the relevant clinical conditions.
Demonstrating suitability for intended use is a pre-requisite for the registration of a pharmaceutical product and/or its packaging, delivery/administration, or manufacturing systems.
Chemical entities present in these systems can migrate (or leach) into the drug product during that time during which the drug product and these systems are in contact. These extraneous system-derived entities have the potential to affect product performance and/or safety. Experimentally assessing the extent of migration can be accomplished by characterizing the systems for extractable substances (establishing the potential effect) or the packaged drug product for system-related leachables (establishing the actual effect). In either circumstance, the analytical process is the same and typically involves testing a sample (either the extract or the drug product) by a means that produces a response and then correlating the response with the identity and concentration of the entity causing the response. With this information (identity and concentration), the potential safety risk associated with individual extractables (or leachables) can be assessed.
It is often the case that analytical test methods can produce responses more readily than those responses can be used to establish the associated entity's identity and concentration. In the case that an entity's identity cannot be established, the entity is labeled as an unknown and the unknown cannot be toxicologically assessed to directly establish its safety. Nevertheless, it is reasonable to hypothesize that “scientifically justifiable thresholds based on the best available data and industry practices can be developed for the reporting and safety qualification of leachables … and the reporting of extractables from … container/closure systems” (1). These scientifically justifiable thresholds would establish those amounts of individual leachables and extractables that could be viewed as representing an acceptable patient safety risk regardless of their actual identity and toxicology
Hypothesis and Purpose
Over the years, a significant quantity of extractables and leachables data, especially their identities, has been published in the chemical literature. For many extractables and leachables, relevant toxicological safety information is also available from the literature. Such a database of toxicological safety information may be relevant to published safety thresholds, such as the safety concern threshold (SCT) and qualification threshold (QT). These scientifically justifiable thresholds establish those amounts of individual leachables and extractables that could be viewed as representing an acceptable patient safety risk regardless of their actual identity and toxicology.
This article documents a large number of largely organic, chemically diverse extractables that have been discovered in extraction studies performed on representative materials that could be used in pharmaceutical applications. Toxicological data have been collected for these extractables, and the toxicological data have been subjected to a systematic process of extrapolating the data to the case of long-term, parenterally administered drug products in humans. The extrapolated data are presented and certain trends or characteristics of the data are discussed. Additionally, the extractables have been considered in the context of in silico and in vitro methods for assessing their mutagenic potential.
Experimental
General
The extractables considered within this document were obtained from analysis of components of packaging systems, medical devices, and manufacturing systems and their associated materials of construction. The extractables were revealed during the laboratory characterization of many and varied types of materials; thus, this list of extractables is a compilation of test results and is a fair representation of materials used throughout the pharmaceutical industry, especially the case of parenteral drug products. Therefore, any conclusions drawn from the data are considered to be applicable to, and relevant for, many plastics and polymeric materials used within the pharmaceutical industry, especially in the case of parenteral drug products. The database contained in this article reflects extractables for which relevant toxicological data existed or could be inferred. Generally, extractables can be classified into two groups: (a) those extractables for which there is sufficient useful and credible published toxicological data to perform a rigorous safety assessment, and (b) those extractables for which there is insufficient useful and credible toxicological data to perform a rigorous safety assessment. In the case of the second group, the toxicology of some these extractables can be inferred through the use of surrogate compounds (e.g., compounds that are chemically and structurally similar to the extractable). This second group can be further subdivided into two sub-groups depending on the nature of the surrogate. One sub-group consists of those extractables whose surrogates are themselves extractables from the first group (and thus which possess useful and credible toxicological data). The other sub-group consists of those extractables whose surrogate was not an extractable from the first group but rather was a structurally similar compound which itself possessed useful and credible toxicological data.
Extractables Classification and Calculation of the Individual Extractable's Risk Index (RI)
The structural classifications for the extractables contained within the database were obtained via Toxtree version 2.6.0 (3) using the Cramer rules with extensions. Supporting toxicological information for the extractables was obtained from published literature, with a preference for data that considered the highest dose of an identified chemical that caused either no observed effects (NOEL) or no adverse effects (NOAEL). If NOEL or NOAEL values were not found, other available toxicological endpoints were used: TDLO, median lethal dose (LD50), and others. Once identified, toxicological endpoints were converted into tolerable intakes, in milligrams per kilograms (mg/kg), after applying relevant uncertainty factors (UFs) described as follows. These values were subsequently multiplied by a 70 kg body weight to obtain a daily exposure index, referred to as the risk index (RI), expressed in milligrams per day (mg/day). For some extractables, multiple sources of toxicological information are contained in the database.
The purpose of this article is to consider the case of intravenously administered parenteral drug products. Thus, the ideal toxicological data would be a no effect level (NOAEL or NOEL) obtained from a study performed in humans via the intravenous (i.v.) route of administration. Even in the rare case that such ideal data were available, the uncertainty or variation in the data needed to be addressed. Therefore, the toxicology data were adjusted with appropriate and relevant UFs, consistent with well-recognized toxicological practices, for example, Reference 2, as follows:
A UF (T1) of 10 was used to account for the inter-individual variation among humans (UF1 from Reference 2),
An UF (T2) of 10 was used to take into account the inherent differences between man and other species (UF2 from Reference 2),
Two UFs (T3 and T4) were used to account for the quality and relevance of the data (UF3 from Reference 2). A UF (T3) of 10 was used to account for routes of administration other than i.v. (a component of UF3 from Reference 2). Additionally, a factor (T4) of 10 was used in all cases where an NOEL, NOAEL, or comparable no effect level was not available (also a component of UF3 from Reference 2).
This approach accommodates a variety of toxicological endpoints and allows one to apply additional uncertainty, thereby lowering the tolerable intake, depending on the nature of the toxicological endpoint. Using this approach, toxicological endpoints were typically divided by a factor of 10,000 (T1 × T2 × T3 × T4) to obtain the compound's RI; see eq 1. It was rarely the case that the assembled toxicological data was a “perfect” match in terms of being an NOAEL derived from the i.v. route of administration in humans. In these circumstances, the data were considered adequate to limit combined uncertainty to 10, accounting for a minimum of differences in sensitivity between humans (10 fold).
 It is clear that such a process falls short of the standards of rigor and completeness that are required in a formal safety assessment process for each of the individual extractables in specific applications, and it was not the intent of this investigation to rigorously assess each extractable toxicologically. Thus the RIs contained in this document should not be construed to be related to or an indication of more rigorously determined permissible daily exposure (PDE) values or thresholds of toxicological concern (TTC). Nevertheless, the standardized approach taken to produce the RIs produces a consistently derived database that contains relevant and appropriate information for a consideration of trends within the population of extractables assessed in this article. In this context, the RI values may be an appropriate comparator to the more rigorously derived PDE and TTC values and to quantities that serve as identification and safety assessment thresholds for extractables and leachables, such as the SCT and QT (1).
In Silico and In Vitro Assessments
The entire population of extractables from all of the three groups and the surrogates used for the Group 3 extractables were assigned to a Cramer class, using the Cramer rules, with extensions. Based on quantitative structure–activity relationships (QSARs), the Cramer classification is a rules-based process that sorts compounds into three classes; Class 1 (low risk of toxicity), Class 2 (intermediate between 1 and 2), and Class 3 (either no basis to presume safety or positive indication of toxicity). Additionally, the entire population of extractables was assessed by in silico QSAR analysis for their mutagenic/carcinogenic potential using the Benigni/Bossa rule base. The Cramer classifications and mutagenicity assessments were performed using the appropriate modules of Toxtree software (3, 285).
Lastly, two carcinogenicity/mutagenicity databases were queried for the Group 1 extractables. Group 2 and Group 3 extractables were not assessed because they are, by definition, substances for which relevant toxicity information is either scarce or non-existent. Specifically, the Carcinogenic Potency Database (CPDB) and the Chemical Carcinogenesis Research Information System (CCRIS) databases were queried for relevant information. The CPDB (286) is a widely used international resource containing the results of 6540 chronic, long-term animal cancer tests on 1547 chemicals. The CCRIS (287) is a database sponsored by the National Cancer Institute containing primarily in vitro carcinogenicity and mutagenicity test results for over 8000 chemicals.
Results and Discussion
Classification of the Compiled Extractables
All told, nearly 550 individual extractables were evaluated in terms of their available toxicological data. These extractables could be classified into three separate groups based on the quality of the toxicological data available for the individual extractables. Group1, consisting of approximately 260 compounds, had available toxicological information that was sufficiently robust and useful to directly calculate RIs. The remaining extractables did not have sufficiently available or useful toxicological information to directly calculate RIs. For these substances, toxicological information was inferred using structurally similar surrogate substances that possessed sufficiently useful toxicological data. It is obvious that the overriding criterion for choosing a surrogate is that the surrogate and the extractable both possess those structural units or characteristics that are critical from the perspective of their toxicology. Given these criteria, it is reasonable to anticipate that in most cases the extractable and its surrogate should have the same Cramer classification. Equally important is that the surrogate has adequate toxicological data, as there is little value in linking an information-deficient extractable to an information-deficient surrogate. Lastly, surrogates which themselves are reported extractables take precedent over surrogates which are not extractables, as it is logical that one extractable should be structurally and toxicologically similar to other extractables and that inferences made about one extractable are more credible if they are based on another extractable.
Approximately 140 information-deficient extractables that could be linked directly to surrogate extractables were assigned to Group 2. The remaining approximately 150 information-deficient extractables (Group 3) could not be linked to a surrogate extractable. Such extractables were toxicologically assessed, in a general manner, by linking them with surrogates which themselves were not extractables. These non-extractables surrogates met the same expectations as the surrogates for the Group 2 extractables.
The most direct calculation of the RI values occurs for the Group 1 extractables that have their own toxicological data. Such extractables are more frequently encountered in extractables studies and are most likely to be confidently identified. On the other hand, the Group 3 extractables are less frequently encountered in extractables studies, are generally those extractables that are present in the extracts at the lower concentrations, and are those extractables whose exact identities are less likely to be confirmed. These characteristics of the Group 3 extractables make them generally less suitable for inclusion into a comprehensive database because
The identifications are more speculative,
Their linkage to a relevant surrogate is less precise (that is, the Group 3 extractables are linked to surrogates whose structural match may be less rigorous than the match between a Group 2 extractable and its surrogate),
The Group 3 extractables have less frequently been assigned a Cramer classification, and
The surrogates chosen for the Group 3 extractables may have less robust toxicological data.
Nevertheless, the Group 3 extractables can be properly linked to viable surrogates, and the toxicological data associated with those surrogates can be collated and examined. The fact that the surrogates for Group 3 extractables are not extractables themselves does not automatically mean that the connection between the extractable and its surrogate is poor or that the surrogates' toxicological information is not applicable to the extractable that is being modeled.
The Group 2 extractables fall somewhere between these two extremes. Because the Group 2 extractables are linked to surrogates that are Group 1 extractables, they have sufficient toxicological data to calculate an RI value. Additionally, the Group 2 extractables tend to be more commonly encountered in multiple extractables assessments, and these compounds tend to be more confidently identified.
In several cases, replicate sources of toxicological data were available for certain of the extractables; each source of the toxicological data was entered into the database. Thus while the database contains entries for approximately 550 unique extractables, the actual number of total entries is closer to 600. The entire dataset, segregated by the extractables' groups, is listed in Tables I through III.
Compiled Information for the Group 1 Extractables
Compiled Information for the Group 2 Extractables
Compiled Information for the Group 3 Extractables
Evaluation of the RI and Cramer Classifications for Extractables within a Given Group
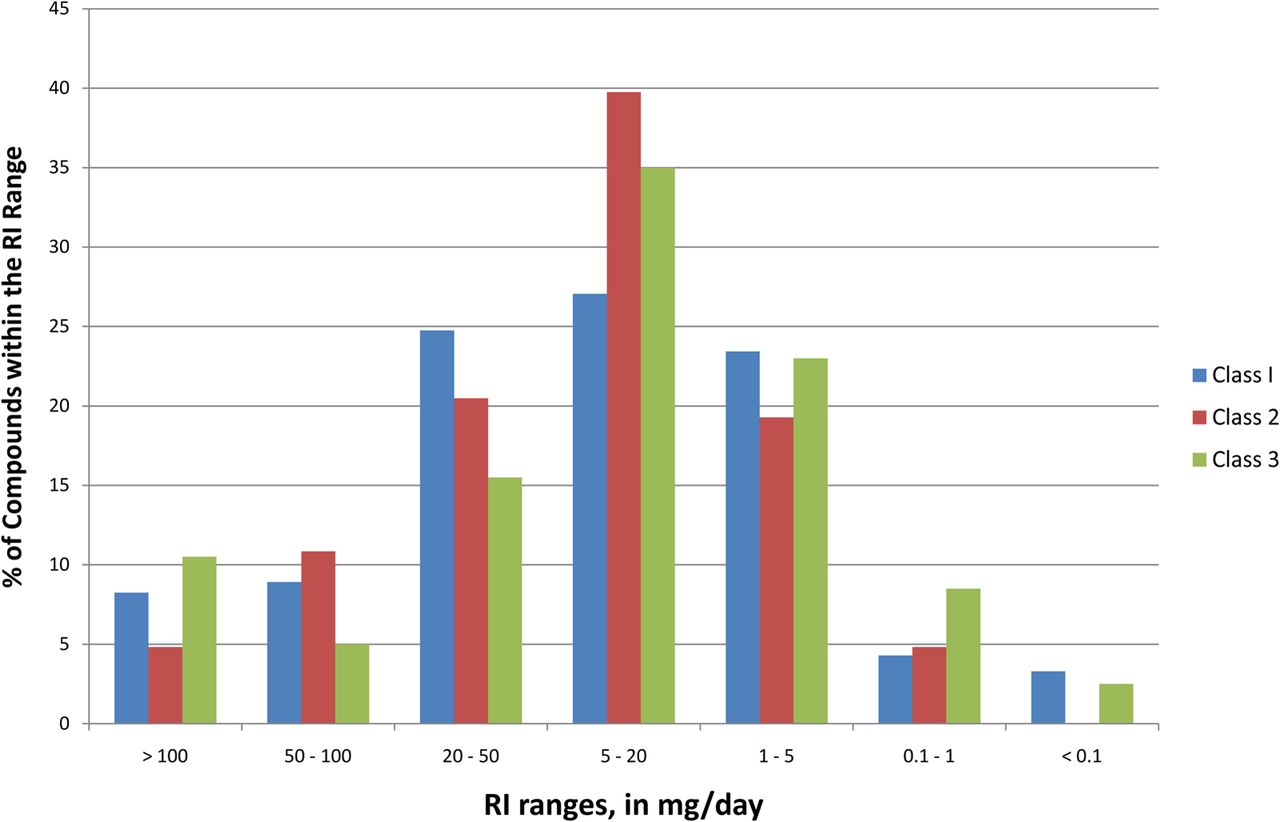
Frequency distribution plots establishing the distribution of the extractables among established ranges of RI values are shown in Figure 1. The normal distributions of RI values are essentially similar for extractables Groups 1 through 3, although extractables with an RI value less than 0.1 mg/day are unique to Group 1. With few exceptions, the RI values are typically between 0.05 and 500 mg/day, with the greatest population of data falling in the band between 0.05 and 20 mg/day. The frequency distribution is more or less normal, centered on a band of RIs between 5 and 20 mg/day. The largest RI was obtained for erucamide (RI = 525 mg/day), and several compounds had RIs of less than 0.1 mg/day.
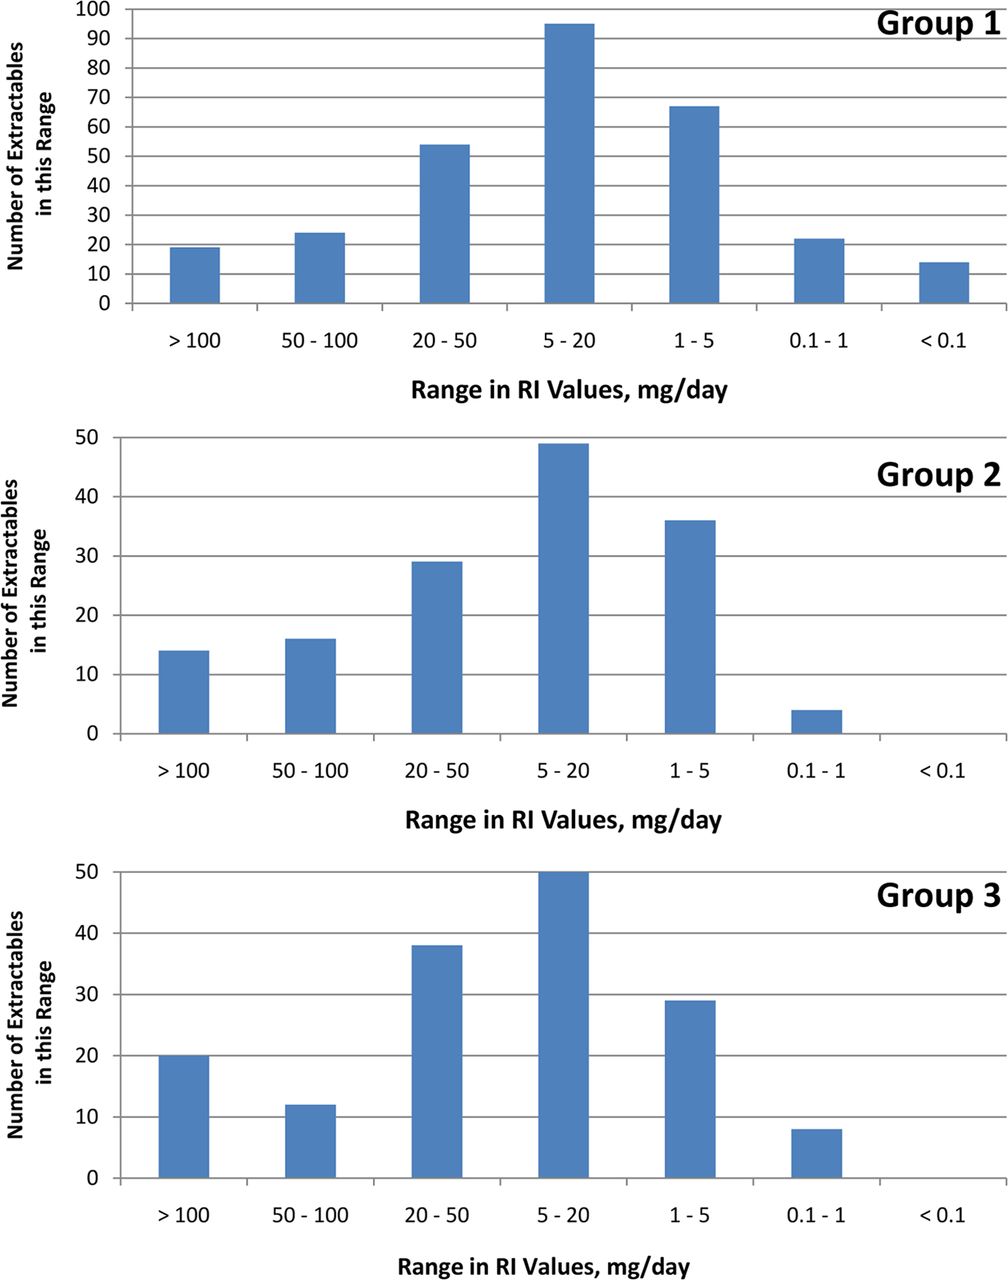
Distribution plots, RI values for the extractables as a function of the individual extractables group. In general, the extractable's RI values fell within the range of 0.05 to 20 mg/day, although there were individual extractables whose RI values fell outside this range. The frequency distribution is more or less normal, centered on a band of RIs between 5 and 20 mg/day. The frequency distributions were generally consistent across the three groups of extractables.
Figure 2 contains the cumulative frequency distribution plots for all three extractables groups. Although the RI value corresponding to the 95% level on the cumulative distribution line varied somewhat between groups, in general the 95% level was achieved at a RI value of approximately 0.1 mg/day. This is noteworthy because it is not uncommon to use the cumulative distributions of toxicity data to establish safety thresholds (for example, References 279⇓⇓⇓–283).
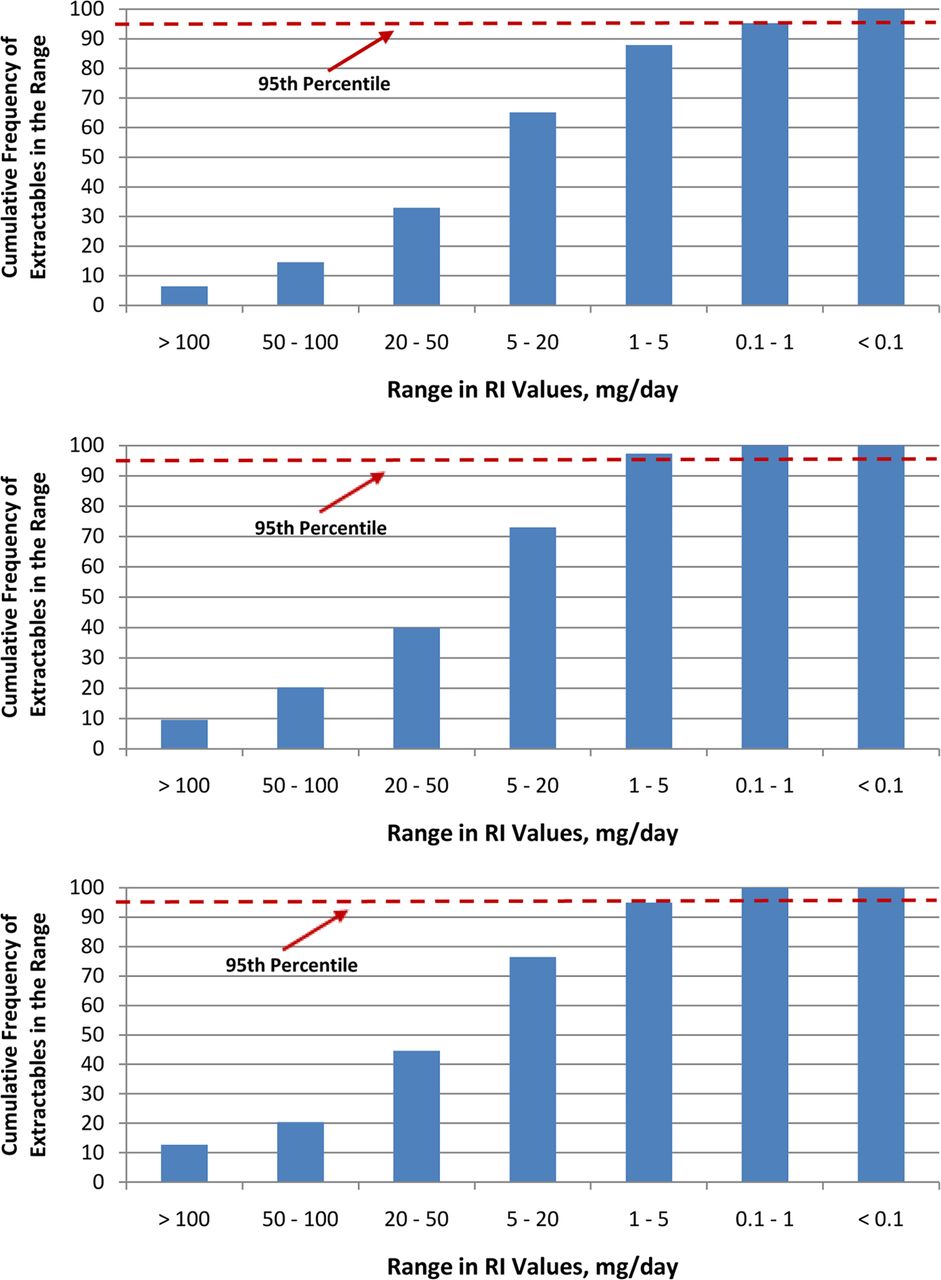
Cumulative distribution plots, RI values for the extractables as a function of the individual extractables group. The cumulative distributions were generally consistent across the three groups of extractables. The RI value corresponding to the 95% level on the cumulative distribution plot was approximately 0.1 mg/day. Thus 95% of the extractables had a RI value greater than 0.1 mg/day.
Considering the aspect of the Cramer classifications, Figure 3 is a frequency distribution of the Cramer classifications for the three groups of extractables. As was the case with the RI values, the distribution of extractables between the three Cramer classes was similar across the three groups of extractables, and most of the extractables were classified as either Class 1 or Class 3; Table IV lists those extractables assigned to Cramer Class 3 and which would thus trigger a potential safety alert. Although Table IV includes compounds of varying structural and functional characteristics, this list of Cramer Class 3 compounds includes many silicon-containing extractables, as one of the Cramer alerts is molecules that contain heteroatoms other than carbon, hydrogen, nitrogen, oxygen, and divalent sulfur.

Distribution plots of Cramer classifications for the individual extractables groups. The distribution of the extractables among the Cramer classes was generally consistent across the three groups, although Groups 2 and 3 generally had more Class 3 compounds and less Class 1 compounds than did Group 1. Also, the distributions for the extractables themselves and the distribution of the extractables' surrogates for Groups 2 and 3 were very similar. This outcome is expected, as it is appropriate that the extractable and its surrogate have similar toxicological characteristics. Some Group 3 extractables could not be assigned to a Cramer class due to the structural complexity of either the extractable itself or its surrogate (such extractables are denoted as N/A).
Group 1 Extractables with Cramer Classification Alerts (Class 3)
Group 2 Extractables with Cramer Classifications Alerts (Class 3)
Group 3 Extractables with Cramer Classifications Alerts (Class 3)
The choice of a compound as a surrogate for an extractable with insufficient toxicological data is based, in part, on the expectation that the extractable and its surrogate should have similar toxicological characteristics. Thus it is expected that in most cases, an extractable and its surrogate will have the same Cramer classification. As noted in Figure 3, the distributions of Cramer classifications of Group 2 and 3 extractables are generally similar to the distributions for their associated surrogates, providing some indication of the appropriateness of the chosen surrogates.
Evaluation of the Entire Extractables Dataset
Considering the consistency in the distribution of RIs across the three extractables groups, one anticipates that the distributional analysis of the entire dataset of extractables would the same as it was for the individual groups. As shown in Figures 4 through 6, the relevant distributions for the entire dataset mimic the distributions of the individual groups. The distribution of RI values was essentially normal, centered on an RI band of 5–20 mg/day (Figure 4). The 95% level in the RI cumulative frequency distribution was approximately 0.1 mg/day (Figure 5). This value is termed the critical RI. This critical RI is the RI that is lower than the calculated RI values for 95% of the extractables in the dataset. Additional statistical values for the datasets (mean, mode, median values for RI) are summarized in Table V. In general, all the extractables groups (and all the extractables in total) had a mean RI of approximately 35 mg/day and the median RI was approximately 12 mg/day.
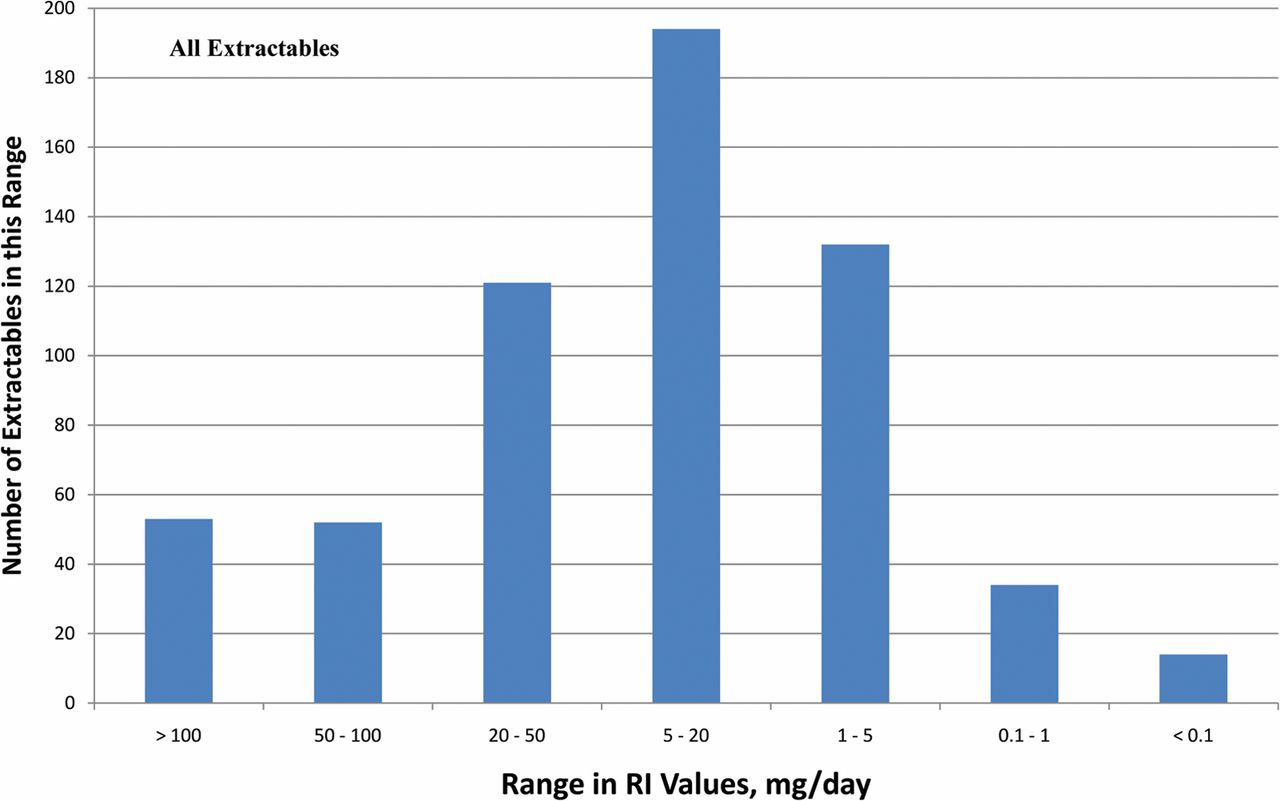
Distribution plots, RI values for all extractables. In general, the extractables' RI values fell within the range of 0.05 to 20 mg/day, although there were individual extractables whose RI values fell outside this range. The frequency distribution is more or less normal, centered on a band of SCTs between 5 and 20 mg/day. Thirteen individual extractables had RI values that were less than 0.1 mg/day (Table V).

Cumulative distribution plots, RI values for all extractables. The critical RI value corresponding to the 95% level on the cumulative distribution plot was approximately 0.1 mg/day. Thus 95% of the extractables had a RI value greater than 0.1 mg/day.

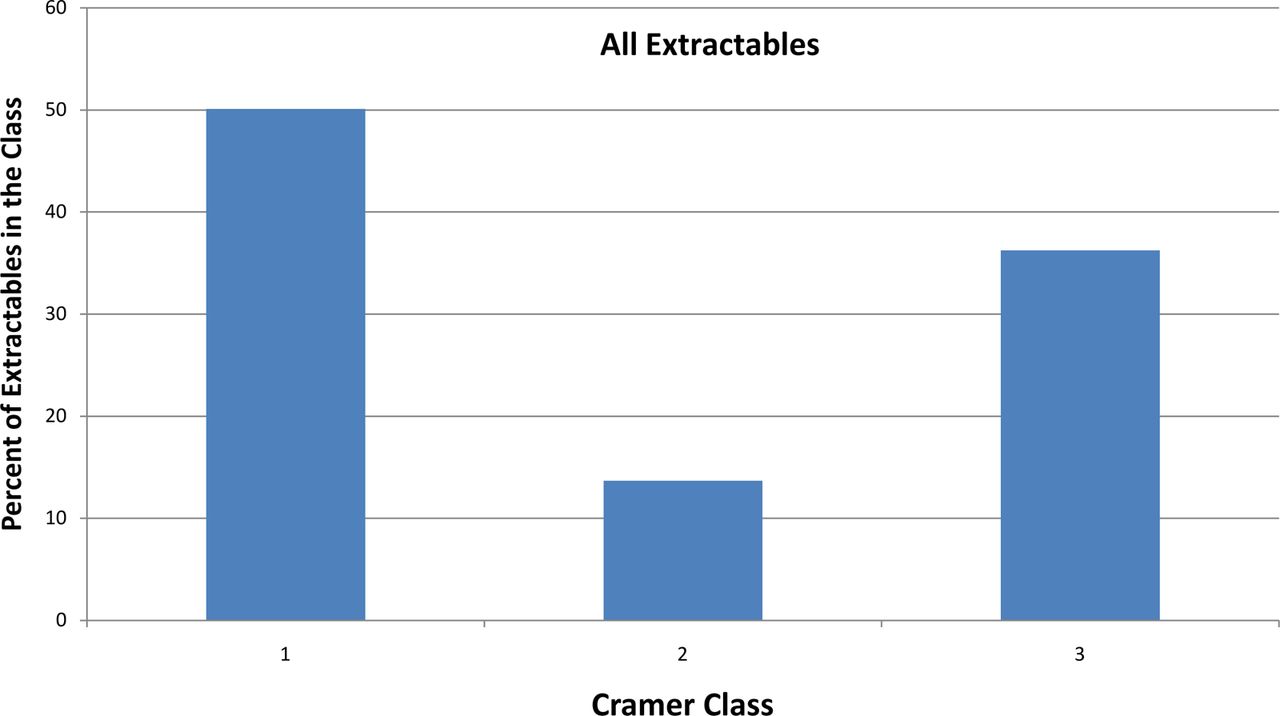
Distribution plots of Cramer classifications for all extractables. In general, approximately 50% of the extractables were classified as Cramer Class 1 while 35% were classified as Cramer Class 3.
Summary Statistics for the RI (mg/day) Values
Considering the Cramer classifications, approximately 50% of the extractables were classified as Cramer Class 1 and approximately 35% of the extractables were classified as Cramer Class 3 (Figure 6). Approximately 65% of the extractables would not trigger a safety alert based on their Cramer classification, as they were classified into Cramer Classes 1 and 2.
It is reasonable to expect that there be some correlation between the RI values and the Cramer class assignments, with the extractables having the largest RIs being assigned to the lowest Cramer class and the extractables having the lower RIs being assigned to the higher risk Cramer classes, as both the RI and Cramer classification are indictors of potential safety concerns. A plot of RI distributions in for the extractables classified into the three Cramer classes is shown in Figure 7. A clear and definitive distribution of low and high RI values versus Cramer classes was not obtained. While there is some shifting of the frequency distribution towards the lower RIs, Class 3 versus Class 1, the distributions of RIs is generally similar, Class 1 versus Class 3. Thus a clear link between the RI and the Cramer classifications was not established with this dataset. It is noted that this comparison of RI and Cramer classes did not include a consideration of the pharmacological activity of the extractables [e.g., ADME (absorption, distribution, metabolism, and excretion) analysis].

Distribution plots, Cramer class versus RI values, all extractables. In general, the distribution of the RI values is similar across the three Cramer classes, although the distribution is shifted slightly towards the lower RI values for the Cramer Class 2 and 3 extractables.
Thirteen of the extractables collated in this article (≈2% of the total populations of extractables) had RIs of 0.1 mg/day or less (Table VI). In addition to the fact that there actually were thirteen extractables with RIs less than 0.1 mg/day, there are two points of interest in Table VI. Firstly, it is noted that four of the compounds with RIs below 0.1 mg/day had a second source of toxicological data whose analysis produced RI values higher than the 0.1 mg/day level, illustrating the inherent uncertainty in toxicological safety assessment. For example, oleic acid has one of the lowest RI values (0.006 mg/day), based on a TDLO reported in monkeys by the i.v. route. Alternatively, a RI of 7 mg/day is calculated based on a TDLO value in rats by the same i.v. route. This second RI value is more consistent with the Cramer Class 1 designation for oleic acid. A similar situation was encountered for three other Cramer Class 1 extractables with an RI of less than 0.1 mg/day including acetophenone, toluene, and succinic acid. It is anticipated that these types of variations in the toxicological data would be addressed more rigorously in the formal safety assessment of the individual extractables.
Extractables with RI Values Lower than 0.1 mg/day
Secondly, it is noteworthy that not all the extractables with the lowest RI values triggered a safety alert via Cramer classification. Of the 13 compounds with a RI less than 0.1 mg/day, only four triggered a Cramer Class 3 alert. The RI values and Cramer classifications of these four compounds, pyridine, carbon disulfide, 5-quinolinol, and acrylonitrile, effectively address the potential safety risk associated with these extractables that is established by a more detailed toxicological assessment of these compounds.
Considering Carcinogenicity and Mutagenicity
Carcinogenicity and/or mutagenicity endpoints are not well represented in the either the RI dataset or the Cramer classification. As noted previously, it is beyond the scope of this article to perform a detailed and complete safety assessment of each of the over 500 individual extractables. Nevertheless, the mutagenic potential of an extractable can be inferred by two means: via in vitro and in vivo testing, or by in silico calculation. Considering the former approach, two carcinogenicity/mutagenicity databases were queried for the Group 1 extractables. Considering Group 2 and Group 3 extractables would not have been a particularly fruitful exercise because these extractables are, by definition, substances for which relevant toxicity information is either scarce or non-existent. Specifically, the CPDB and the CCRIS databases were queried for relevant information. The CPDB (286) is a widely used international resource of the results of 6540 chronic, long-term carcinogenicity studies conducted in animals for 1547 chemicals. Results, including the mean toxic dose (TD50), are reported in the CPDB for tests in rats, mice, hamsters, dogs, and non-human primates. The CCRIS (287) is a database sponsored by the National Cancer Institute containing primarily carcinogenicity and mutagenicity endpoints for over 8000 chemicals. Forty-two Group 1 extractables were documented in the CPDB; information that could be obtained for these extractables is included in Table I, including whether the extractable was found to be mutagenic and, if it was, the TD50. One hundred twenty-five of the Group 1 extractables were present in CCRIS; information that was obtained for these extractables included the results of in vitro testing performed using a number of test systems. For the purpose of this article, test results obtained using the Ames Salmonella typimurium and Mouse Lymphoma test systems were considered to be primary indicators of mutagenic potential.
The information obtained from these databases is summarized in Table I. Considering the CCRIS data, 103 of the Group 1 extractables were reported with negative test results, while 22 of the extractables exhibited positive alerts for mutagenicity. These two sets of extractables (negative and positive in vitro testing) were further considered in the context of their reported RIs and Cramer classifications. Figure 8 shows the distribution of the test-positive and test-negative extractables among the various RI groups and among the three Cramer classes. In the case of both RI and Cramer classification, the distribution of extractables that were reported to test positive for carcinogenicity and mutagenicity was skewed towards the greater safety risk versus the distribution of extractables that were reported to test negative for carcinogenicity/mutagenicity. Thus, the test-positive extractables were more frequently in Cramer Class 3 and more frequently had the lower RI values.

Distribution plots for the RI values and the Cramer classifications as a function of the presence or absence of in vitro mutagenicity alerts. The upper plot is for the RI and the lower plot is for the Cramer classifications. In both cases, a higher degree of safety risk (as reflected in lower RI values or higher Cramer classifications) was indicated for those Group 1 extractables that had a positive in vitro alert for mutagenicity, although the difference between extractables with and without an alert was small.
CCRIS data that were available for a very small number of the Group 2 and 3 extractables are summarized in Tables II and III.
In silico models, based on QSARs, have been developed for estimating the potential mutagenicity and carcinogenicity of chemical compounds. For example, the Benigni/Bossa rule base has been developed as a module to Toxtree software (285). The main tool of this model is a list of structural alerts (SAs) for carcinogenicity. The SAs for carcinogenicity are molecular functional groups or substructures known to be linked to the carcinogenic activity of chemicals. As one or more SAs embedded in a compound's molecular structure are recognized, potential carcinogenic compounds are flagged. The Benigni/Bossa rule base includes SAs that flag potential genotoxic and non-genotoxic carcinogens. Because of their nature, the SAs have the ability to flag compounds that are potentially toxic, but the lack of SA flags does not necessarily indicate that the compounds are non-toxic.
All of the extractables in all of the groups were taken through the Toxtree analysis. Of the approximately 550 extractables, 48 of the extractables were flagged as being potentially carcinogenic considering gentoxicity effects, while an additional 60 extractables were flagged considering non-genotoxic effects; information for approximately 20 of the extractables could not be obtained due to the complexity or inexact nature of their structures.
The distribution of the flagged extractables with respect to their RI values and Cramer classifications are summarized in Figure 9. In the case of the RI values, the distribution of extractables that were reported to test positive for carcinogenicity and mutagenicity was skewed towards the greater safety risk versus the distribution of extractables that were reported to test negative for carcinogenicity/mutagenicity. Thus the test-positive extractables more frequently had the lower RI values, especially for the higher RI compounds. Alternatively, there is no significant shift in the Cramer classifications as a function of the presence or absence of an in silico mutagenicity alert. In general, the predominant genotoxicity SA flags triggered by the extractables included flags for simple aldehydes (35% of the genotoxicity flags), epoxides and aziridines (21%), and α, β-unsaturated carbonyls (17%). The non-genotoxic flags were almost solely related to substituted n-alkylcarboxylic acids (58%) and phthalate diesters and monoesters (33%).

Distribution plots for the RI values and the Cramer classifications as a function of the presence or absence of in silico mutagenicity alerts. The upper plot is for the RI and the lower plot is for the Cramer classifications. The distribution of RI values is shifted downward towards lower RI values, extractables with alerts versus extractables without alerts, especially at the higher RI values. Alternatively, there is no signficiant shift in the Cramer classifications as a function of the presence or absence of an in silico mutagenicity alert.
Comparing the Critical RI to Safety Thresholds (STs)
As noted previously, the concept of a safety threshold (ST), and its closely related analytical derivation, the analytical threshold (AT), are essential in the rigorous and efficient evaluation of the potential product safety and quality impacts of plastic packaging materials used in pharmaceutical applications. Grossly oversimplified, the ST, and its related quantities such as the SCT (safety concern threshold) and the TTC (threshold of toxicological concern), is derived from a set of compounds of known toxicities and is set such that a high percentage of compounds have PDEs (permissible daily exposures), or other similar indicates of a safe dose, above the ST. Thus if all the members of the toxicological database upon which the ST were based were leachables (or extractables), and if the leachables were present in the drug product at levels equal to their PDE, they would be flagged for further consideration if the leachables data is reviewed versus the ST. A similar situation would be the case for extractables, except that in this case one is not considering the actual impact on patient safety but rather an inferred impact on patient safety and one is not testing the drug product but rather an extract of the test system.
This is not exactly the same situation used for deriving the RIs. In the case of establishing the RI, a database of known extractables (and probable leachables in certain circumstances), many of which have no associated toxicological concerns, was assessed for potential safety impact via a standardized approach. This analysis produced the individual RIs, whose distribution was examined to produce the critical RI of 0.1 mg/day.
Despite this difference in the derivation of the critical RI and the ST, these quantities could be somewhat related. However, it is unreasonable to expect that the numbers would be numerically equivalent, given their different derivation. Rather, as safety assessment is a conservative process and the ST was established via a conservative assessment of toxicological data for substances with known toxicological alerts, it is reasonable to expect that the critical RI should be larger than the ST. This is the case, for example, when the critical RI is compared to an SCT of 1.5 μg/day (0.0015 mg/day), which has been proposed by the Product Quality Research Institute (PQRI) for parenteral and ophthalmic drug products. Moreover, this was the case for every extractable considered in this article except for acrylonitrile, which was the single extractable considered in this article that had an RI below the SCT of 1.5 μg/day, thereby attesting to the conservative nature of the SCT derivation.
Considering the implications of the differing magnitudes of the critical RI and the SCT, if there are any such implications, is beyond the scope of this article. Nevertheless, one can establish the differences between the SCT and RI concepts. Specifically, the SCT is intentionally derived from a database of compounds with an established toxicity potential. The compounds in this database were chosen based on their toxicological implications and do not consist of extractables and leachables except by circumstance. Alternatively, the compounds in the RI database were intentionally chosen because they are extractables and/or leachables but without regard to their toxicological potential.
An obvious outcome of the analysis performed in this article is that in general the population of extractables and leachables has a lower toxicological potential than does the population of compounds upon which the SCT is based. Thus it is logical that the SCT would have a lower absolute value than the RI.
Other Factors to Consider in Interpreting the RI
The RI calculations performed in this study are based on the assumption that the drug product in which the extractables accumulate in as leachables is dosed on a daily basis for the duration of the patient's lifetime. While this may be the case in some clinical situations and for certain therapies, the clinical use of many drug products is such that their administration falls well short of the patient's lifetime. In such circumstances, it is a well accepted practice to use a “staged” safety threshold based on the duration of patient exposure (for example, Reference 284). Specifically, while an allowable daily intake (ADI) may be 1.5 μg/day for clinical situations in which the exposure exceeds 12 months, a higher ADI of 120 μg/day may be appropriate for a single-dose exposure. Thus one could envision a staged RI for application consistent with the clinical use of relevant drug products.
Furthermore, a completely rigorous and acceptable safety assessment, performed, for example, in a manner consistent with ISO 10993 part 17, allows for a consideration of a “benefit factor” (2). Whereas many of the factors used in toxicological assessment drive down a number such as the RI, the benefit factor drives the value up, for the simple reason that “no medical procedure is without health risk and the risks associated … are balanced against the health benefit arising from their use” (2). As the assessment of the data used in this study did not include a benefit factor, one could envision circumstances where the use of such a factor would be appropriate and justified.
It is interesting to consider the juxtaposition of the concepts benefit factor and staged thresholds in the context of lifetime patient exposure. This juxtaposition occurs because it is frequently the case that lifetime patient exposure occurs in circumstances in which the therapeutic benefit is high. In such a situation, the lower threshold established for lifetime exposure can be offset somewhat by the benefit factor, potentially facilitating the analytical process of generating an extractables or leachables profile for a packaged drug product.
Conclusion
RIs for over 550 known extractables from plastic materials used in pharmaceutical applications have been calculated via a standardized approach that converts documented toxicological safety data for the individual extractables into a RI using a set of four consistently applied UFs. The RI is calculated in terms of a daily exposure to the extractable, (e.g., mg/day) for a 70 kg subject based on daily lifetime exposure. Extractables were either assessed directly, if they possessed sufficient toxicological data, or via surrogate substances if the extractables' toxicological data was inadequate. Additionally, the extractables were classified for potential safety impact via the Cramer classification. Lastly, the extractables were evaluated via in vitro and in silico means with respect to their mutagenic potential. The population of RIs, Cramer classifications, and mutagenicity alerts were mathematically assessed to establish their frequency distributions. Such an assessment produced the following outcomes:
The RI values were normally distributed around a band of values between 5 and 20 mg/day.
The 95% level in the cumulative frequency distribution occurred at an RI of approximately 0.1 mg/day. This value was termed the critical RI.
Thirteen of the extractables had individual RI values less than 0.1 mg/day. However, when a second source of toxicological data was considered for several of these extractables, a RI greater than 0.1 mg/day was obtained.
Approximately 55% of the extractables were classified as Cramer Class 1 (low risk of toxicity), and 35% of the extractables were classified as Cramer Class 3 (no basis to assume safety).
While there was no significant relationship between the RI values and the Cramer classifications, the distribution of RI values was shifted towards the lower RI values for Cramer Class 3 extractables versus Cramer Class 1 extractables.
QSAR analysis of the extractables and examination of databases containing information on in vitro mutagenicity testing established that approximately 20% of the extractables produced alerts for mutagenicity. In general, a higher degree of safety risk (as reflected in lower RI values) was indicated for those extractables that had a positive in vitro or in silico alert for mutagenicity.
The critical RI of 0.1 mg/day is somewhat higher than the SCT that is currently proposed for leachables in parenteral drug products (0.0015 mg/day). The higher RI value is appropriate considering the different datasets upon which the critical RI and the SCT are based and the different means by which they are calculated.
Acknowledgements
The authors wish to acknowledge the efforts of the current and past members of Baxter's Technology Resources Extractables and Leachables and Life Sciences Departments, as it is their work related to extractables testing and safety assessment that is collated in this article. Specifically, the authors would like to acknowledge Laura Anderson and Paul Valaitis for their help in verifying toxicologic information pertaining to the extractables listed herein as well as providing technical support with respect to their structural classifications.
- © PDA, Inc. 2014
References
- 1.↵
- 2.↵
- 3.↵
- 4.
- 5.
- 6.
- 7.
- 8.
- 9.
- 10.
- 11.
- 12.
- 13.
- 14.
- 15.
- 16.
- 17.
- 18.
- 19.
- 20.
- 21.
- 22.
- 23.
- 24.
- 25.
- 26.
- 27.
- 28.
- 29.
- 30.
- 31.
- 32.
- 33.
- 34.
- 35.
- 36.
- 37.
- 38.
- 39.
- 40.
- 41.
- 42.
- 43.
- 44.
- 45.
- 46.
- 47.
- 48.
- 49.
- 50.
- 51.
- 52.
- 53.
- 54.
- 55.
- 56.
- 57.
- 58.
- 59.
- 60.
- 61.
- 62.
- 63.
- 64.
- 65.
- 66.
- 67.
- 68.
- 69.
- 70.
- 71.
- 72.
- 73.
- 74.
- 75.
- 76.
- 77.
- 78.
- 79.
- 80.
- 81.
- 82.
- 83.
- 84.
- 85.
- 86.
- 87.
- 88.
- 89.
- 90.
- 91.
- 92.
- 93.
- 94.
- 95.
- 96.
- 97.
- 98.
- 99.
- 100.
- 101.
- 102.
- 103.
- 104.
- 105.
- 106.
- 107.
- 108.
- 109.
- 110.
- 111.
- 112.
- 113.
- 114.
- 115.
- 116.
- 117.
- 118.
- 119.
- 120.
- 121.
- 122.
- 123.
- 124.
- 125.
- 126.
- 127.
- 128.
- 129.
- 130.
- 131.
- 132.
- 133.
- 134.
- 135.
- 136.
- 137.
- 138.
- 139.
- 140.
- 141.
- 142.
- 143.
- 144.
- 145.
- 146.
- 147.
- 148.
- 149.
- 150.
- 151.
- 152.
- 153.
- 154.
- 155.
- 156.
- 157.
- 158.
- 159.
- 160.
- 161.
- 162.
- 163.
- 164.
- 165.
- 166.
- 167.
- 168.
- 169.
- 170.
- 171.
- 172.
- 173.
- 174.
- 175.
- 176.
- 177.
- 178.
- 179.
- 180.
- 181.
- 182.
- 183.
- 184.
- 185.
- 186.
- 187.
- 188.
- 189.
- 190.
- 191.
- 192.
- 193.
- 194.
- 195.
- 196.
- 197.
- 198.
- 199.
- 200.
- 201.
- 202.
- 203.
- 204.
- 205.
- 206.
- 207.
- 208.
- 209.
- 210.
- 211.
- 212.
- 213.
- 214.
- 215.
- 216.
- 217.
- 218.
- 219.
- 220.
- 221.
- 222.
- 223.
- 224.
- 225.
- 226.
- 227.
- 228.
- 229.
- 230.
- 231.
- 232.
- 233.
- 234.
- 235.
- 236.
- 237.
- 238.
- 239.
- 240.
- 241.
- 242.
- 243.
- 244.
- 245.
- 246.
- 247.
- 248.
- 249.
- 250.
- 251.
- 252.
- 253.
- 254.
- 255.
- 256.
- 257.
- 258.
- 259.
- 260.
- 261.
- 262.
- 263.
- 264.
- 265.
- 266.
- 267.
- 268.
- 269.
- 270.
- 271.
- 272.
- 273.
- 274.
- 275.
- 276.
- 277.
- 278.
- 279.↵
- 280.↵
- 281.↵
- 282.↵
- 283.↵
- 284.↵
- 285.↵
- 286.↵
- 287.↵


Jump to section
Related Articles
Cited By...
- Using Extractables Data of Sterile Filter Components for Scaling Calculations
- Assessment of Extractable Elements from Elastomers
- Comparative Extractables Study of Autoclavable Polyethersulfone Filter Cartridges for Sterile Filtration
- Does an interaction exist between ketamine hydrochloride and Becton Dickinson syringes?
- Creating a Holistic Extractables and Leachables (E&L) Program for Biotechnology Products