
Abstract
In reaction to the limitations of the traditional sterility test methods, in 2008, the U.S. Food and Drug Administration issued the guidance “Container and Closure System Integrity Testing in Lieu of Sterility Testing as a Component of the Stability Protocol for Sterile Products” encouraging sterile drug manufacturers to use properly validated physical methods, apart from conventional microbial challenge testing, to confirm container closure integrity as part of the stability protocol. The case study presented in this article investigated the capability of four container closure integrity testing methods to detect simulated defects of different sizes and types on glass syringes, prefilled both with drug product intended for parenteral administration and sterile water. The drug product was a flu vaccine (Agrippal, Novartis Vaccines, Siena, Italy). Vacuum decay, pharmacopoeial dye ingress test, Novartis specific dye ingress test, and high-voltage leak detection were, in succession, the methods involved in the comparative studies. The case study execution was preceded by the preparation of two independent sets of reference prefilled syringes, classified, respectively, as examples of conforming to closure integrity requirements (negative controls) and as defective (positive controls). Positive controls were, in turn, split in six groups, three of with holes laser-drilled through the prefilled syringe glass barrel, while the other three with capillary tubes embedded in the prefilled syringe plunger. These reference populations were then investigated by means of validated equipment used for container closure integrity testing of prefilled syringe commercial production; data were collected and analyzed to determine the detection rate and the percentage of false results. Results showed that the vacuum decay method had the highest performance in terms of detection sensitivity and also ensured the best reliability and repeatability of measurements. An innovative technical solution, preventing possible prefilled syringe plunger movement during container closure integrity testing execution, is presented as well.
LAY ABSTRACT: The growing need to meet sterile drug products' regulatory, quality, and safety expectations has progressively driven new developments and improvements both in container closure integrity testing methods and in the respective equipment, over the last years. Indeed, container closure integrity testing establishes the container closure system capability to provide required protection to the drug product and to demonstrate maintenance of product sterility over its shelf life. This article describes the development of four container closure integrity testing approaches for the evaluation of glass prefilled syringe closure integrity, including two destructive (pharmacopoeial and Novartis specific dye ingress test) and two non-destructive (vacuum decay and high-voltage leak detection) methods. The important finding from the validation of comparative studies was that the vacuum decay method resulted in the most effective, reliable and repeatable detection of defective samples, whether the defect was exposed to sterile water, to drug product, or to air. Complete sets of known defects were created for this purpose (5 μm, 10 μm, 20 μm certified leakages by laser drilled holes and capillary tubes). All investigations and studies were conducted at Bonfiglioli Engineering S.r.l. (Vigarano Pieve, Ferrara, Italy) and at Novartis Vaccines (Sovicille, Siena, Italy).
- Prefilled syringes
- Non-destructive
- CCI
- Leak detection
- Leak test
- ASTM F2338
- Vacuum decay
- Dye ingress
- High-voltage leak detection
- Leakage
- Sterility
- Integrity
- Package integrity
- Defect
- Plunger movement
- Stopper movement
1. Introduction
In 2008, the U.S. Food and Drug Administration (FDA) has promoted the use of validated physical container closure integrity (CCI) methods as an alternative to sterility testing in drug product stability programs (1). Thus, over the last years, several growing needs in terms of regulatory expectations have progressively driven new developments and improvements in CCI testing. On the other hand, parenteral containers such as prefilled syringes (PFSs) are now currently used across a wide range of medical sectors such as biopharmaceuticals and vaccines; the market has moved in this direction for a number of reasons, including ease of drug administration, additional safety, lower risks of contamination, misidentification, and mix-up.
One of the key aspects of PFS quality control is the assurance of closure integrity after filling and terminal sterilization. Leaking through the PFS is a crucial defect which exposes the drug product to the lack of sterility assurance. This article serves to explore the development of various CCI testing techniques applicable to PFSs filled with medicinal products. It is a case study, conducted jointly by a leading manufacturer of CCI testing equipment (Bonfiglioli Engineering S.r.l., Vigarano Pieve, Ferrara, Italy) and a world leader in vaccines manufacturing (Novartis Vaccines, Sovicille, Siena, Italy). Data and findings of a challenge test performed as stated in a U.S. FDA Recognized Consensus Standard, referred to package integrity testing (2), are provided.
The study demonstrates that an automated CCI testing equipment is effective in detecting PFS leakages less than or equal to 5.0 μm in diameter by using the vacuum decay method (VDM). VDM and its quantitative measurements were examined in comparative studies with high-voltage leak detection (HVLD) and methylene blue dye ingress test (DIT) methods, the final results demonstrating that VDM (2) achieved the highest performance in detection sensitivity, reliability, and repeatability of measurements (3). A suitable set of test kits was employed to determine the detection capability, the process sigma level, and test efficiency indicators. An innovative system preventing possible PFS plunger movement during CCI testing execution—thus guaranteeing the sterility and safety of the drug product—is presented.
2. Case Study
The project was conducted in the year 2013 and consisted of four stages starting with CCI testing method development and ending with validation:
Stage 1: VDM (ASTM F2338)
Stage 2: Pharmacopoeial DIT
Stage 3: Specific DIT
Stage 4: HVLD
Stage 1 and Stage 2 were performed at Bonfiglioli Engineering S.r.l., while Stage 3 and Stage 4 were conducted at Novartis Vaccines. The case study investigated the capability of such methods to detect simulated defects of different sizes and types on glass syringes and to quantify the false result rates. Therefore this study aimed to determine CCI method process indicators as the
detection rate of positive controls (DRPC)
detection rate of negative controls (DRNC)
and then to obtain the
false-negative rate (FNR) = 1 − DRPC
false-positive rate (FPR) = 1 − DRNC
Each and every stage was run over 1 day. A preliminary set-up phase to establish recipe parameters was carried out for each and every piece of equipment used before proceeding with the case study; these settings were then kept unvaried through all stages.
2.1. Sample Test Kits Preparation
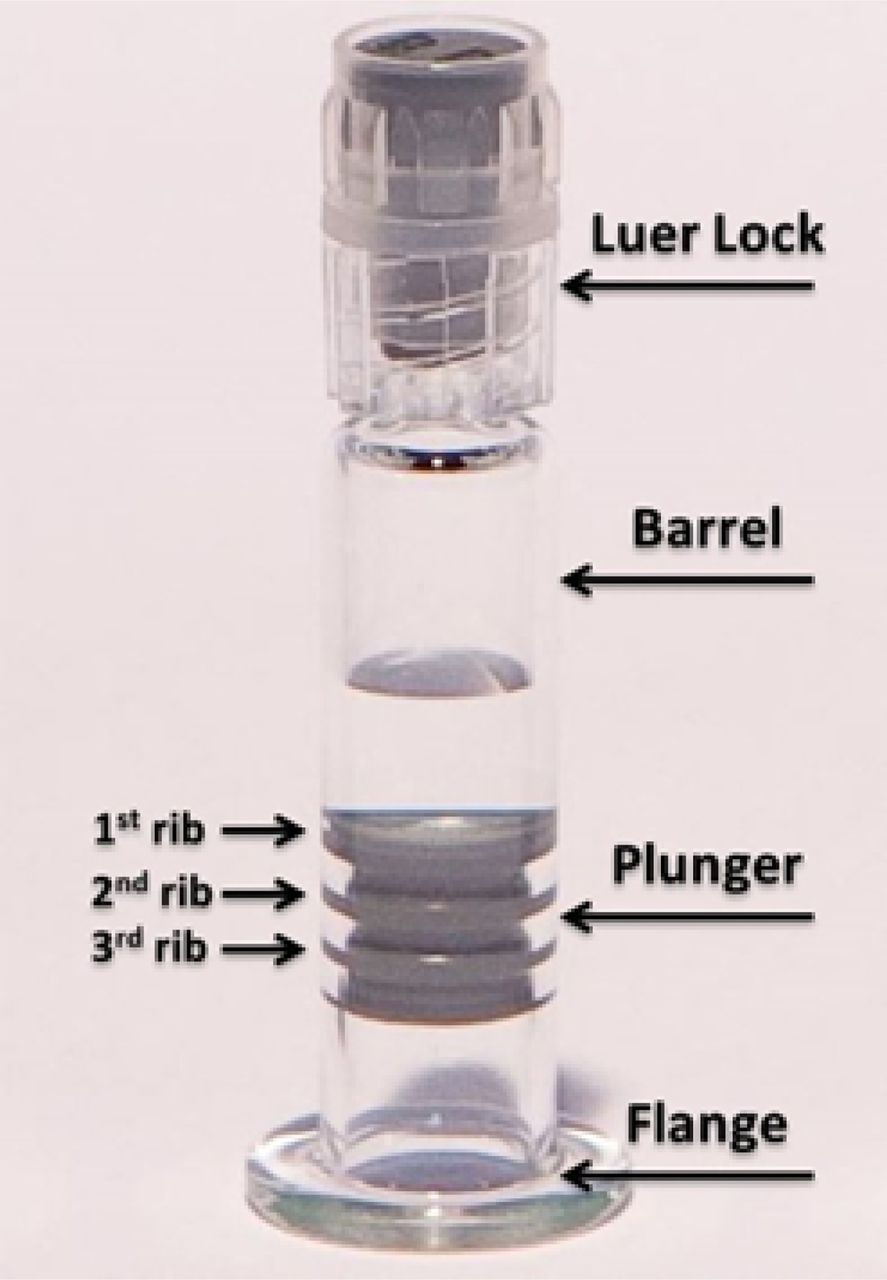
The background, for the case study stage, was the arrangement of a large set of glass syringes with Luer lock plastic tip and rubber plunger/stopper (Figure 1), the dimensions of the glass barrel being 10.85 mm (diameter) and 55.4 mm (overall height). The sample test kits population was prepared according to the following criteria:
negative control PFSs, having no leakages
positive control PFSs, having artificially created known defects in the same number of units.

Pre-filled syringe—container system used for the case study.
In the preparation of sample test kits, each reference plunger was positioned at a height of 13 mm above PFS flange lower extremity, to be consistent with the commercial product specifications. The study was then arranged as a cycle showing two main scenarios:
Real product–filled syringe (fill level 0.4 mL): This scenario applied to Stages 1, 2, 3, and 4;
Sterile water–filled syringe (fill level 0.4 mL): This scenario applied to Stage 1, in order to make a quantitative comparison with the vacuum decay values, and, therefore, to establish a qualitative correlation in terms of real product/sterile water vaporization capability.
In all case study stages, the sample test kits were oriented in upwards direction (Luer lock on top) as in Figure 1. The sample test and kits were duly cleaned when switching from one scenario and/or stage to another.
2.1.1. Negative Controls:
Sixty conforming PFSs were selected from a large initial sample set following the execution of microbiological test. The test (4) was based on the immersion of PFS filled with a tryptic soy broth in a bacterial suspension (solution with Brevundimonas diminuta). All PFSs were then cleansed and incubated for 7 days at a temperature range of 25 to 30 °C. PFSs that did not show any growth following incubation were included in the negative control set.
2.1.2. Positive Controls:
2.1.2.1. Laser-Drilled Holes:
Holes ranging in size from 5 μm to 20 μm (refer to Table I) were laser-drilled into the barrel of the PFS, positioned both above (position “A”) and below the aforesaid fill level (position “B”). The hole size lower limit was established to be coherent with the recognized standard (2) and with previous studies in the literature (5); this case was not intended to represent a possible limit of leak detection (6).
Laser-Drilled Holes—Specifications
The reference PFSs were then individually numbered from 1 to 60. The differential pressure across the PFS leak path was set to 980 mbar: This value was required to be consistent with the intended vacuum level of the subsequent VDM tests. The hole size standards and the respective flow rates were certified using a National Institute of Standards and Technology (NIST)-traceable absolute pressure gauge. The PFS with serial number #60 was broken during transportation, therefore it was excluded from the sample test kits set prior the case study kick-off. The following hole diameter tolerances were stated in the certificates of calibration: 5 μm ± 2 μm, 10 μm ± 3 μm, and 20 μm ± 5 μm. Regarding the 5 μm position “B” group, the hole size of three drilled samples out of 10 was less than 3.5 μm.
2.1.2.2. Capillary Tubes:
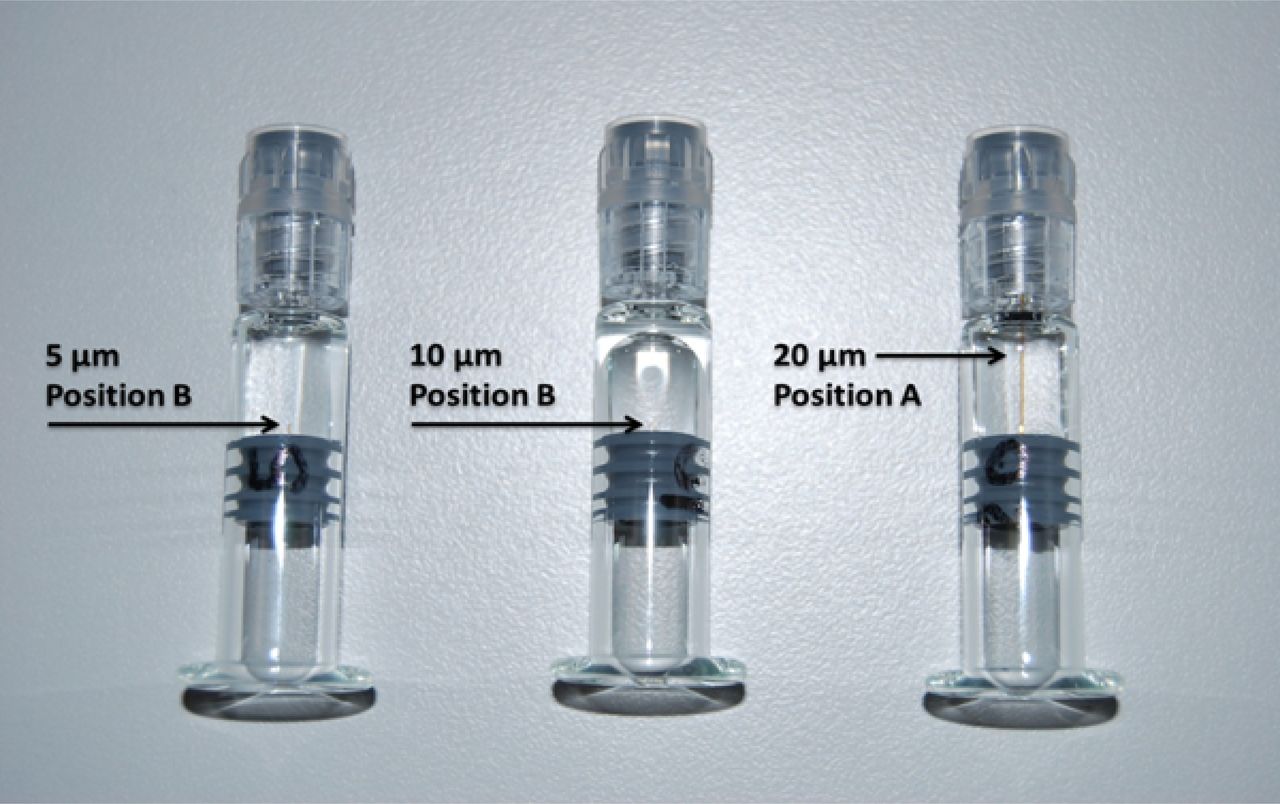
The second set of defective PFSs was built up by introducing ceramic capillary tubes into rubber plungers to contain external leakages (refer to Table II). The capillary tubes length and diameter were sized and calibrated to measure the same flow rate as the laser-drilled hole groups in correspondence of a 980 mbar differential pressure across the flow path.
Capillary Tube—Specifications
The position of the capillary tubes was adjusted to the proper setting, to get the leakages respectively below fill level (10 units—position “B”) and above fill level (10 units—position “A”), as illustrated in Figure 2. PFSs with embedded capillary tubes were, in turn, filled with sterile water and real product and used in Stage 1 to establish their correlation with laser-drilled PFSs.

Capillary tubes preparation – for each component carry out the following procedure: Step a: Determine the diameter and length of the tube that will lead to the required flow rate until the reference differential pressure of 980 mbar is attained between the inlet and outlet. Step b: Cut the selected tube perpendicularly on the desired length. Step c: Set the reference differential pressure between the inlet and outlet sides of the tube and then measure the flow rate across it. Step d: Place the tube in a needle, insert the needle in the plunger, adjust the position of the tube according the required height and remove the needle from the plunger in the end.
2.2. Stage 1: VDM (ASTM F2338)
2.2.1. Test Description:
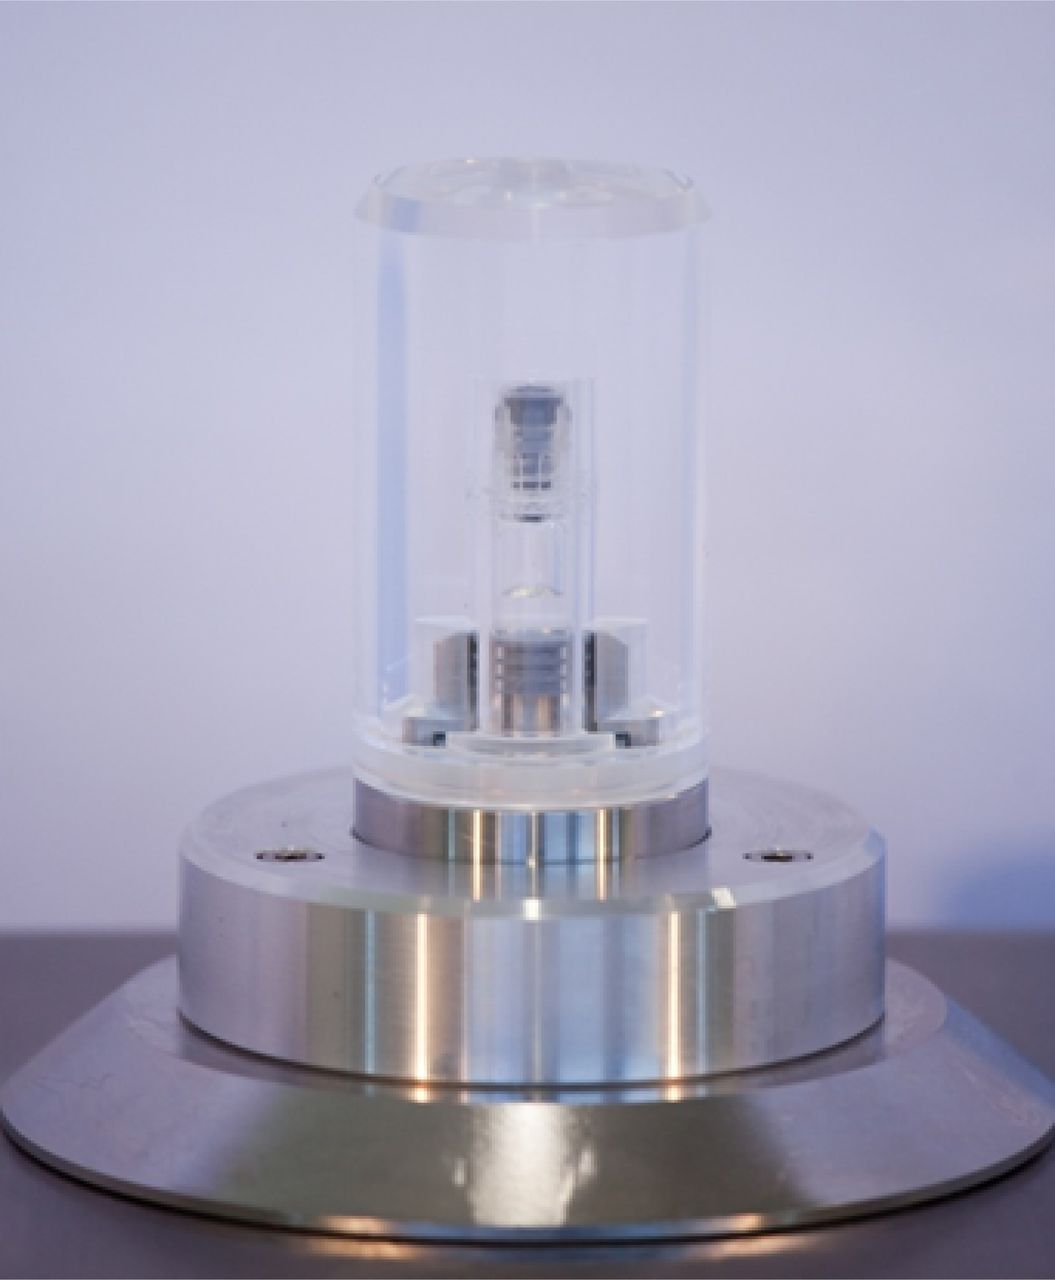
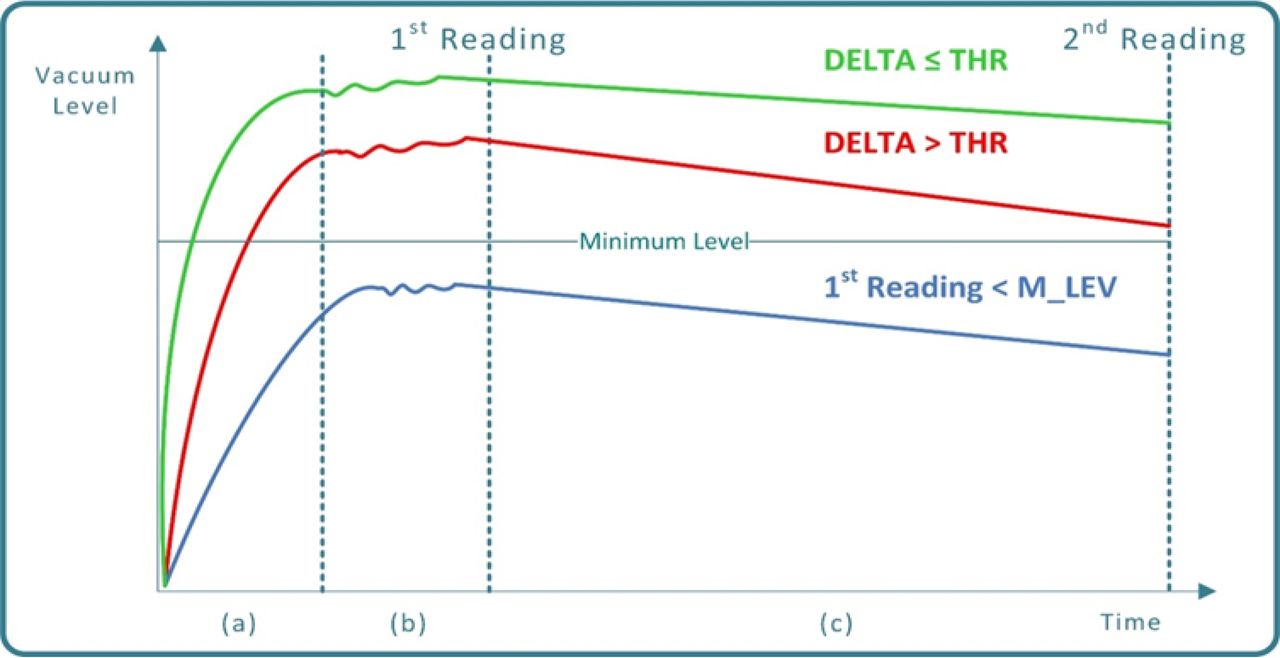
The VDM is a non-destructive CCI testing practice applicable to most pharmaceutical package systems. When dealing with PFSs, the CCI testing is performed while the PFS itself is held within an hermetically sealed test chamber, as shown in Figure 3. The principle underlying the VDM is that, as a consequence of the application of vacuum within the test chamber and hence of a differential pressure between the inside and the outside of the PFS, the air moves from the high-pressure zone (within the PFS) to the low-pressure zone (outside the PFS), causing a progressive pressure rise (that is, a vacuum decay) outside the PFS. Vacuum decay can also result from the volatilization of packaged liquid that partially or fully occludes the leak path. In this case, vacuum decay will only occur if the chamber test pressure is lowered below the liquid's vaporization pressure (2). A vacuum decay greater than a given threshold at the end of the testing phase indicates a failure in the PFS closure integrity (leakage). Once the test chamber is loaded with the PFS to be tested and hermetically closed, the VDM process comprises the following phases (refer to Figure 4):
Vacuuming: the period of vacuum setting within the test chamber
Stabilization: the time necessary to get a homogeneous vacuum distribution within the test chamber
Testing: the time frame in which the vacuum level is monitored by means of a dedicated transducer; two measurements are taken respectively at the beginning (1st reading) and at the end (2nd reading) of this phase

Test chamber of the VDM equipment.

Vacuum curves during VDM process execution: (a) Green curve: PFS Conforming to closure integrity requirements (non-leaking). (a) Red curve: Defective PFS (small-size closure integrity failure), (b) Blue curve: Defective PFS (large-size closure integrity failure).
Following the testing phase the VDM decision making is performed by means of comparing the vacuum decay delta “Δ” (Δ = first to second reading) to a predetermined threshold (THR):
if Δ ≤ THR the PFS is classified as conforming (no detectable leakages)
if Δ > THR the PFS is classified as defective (a micro-leakage is detected)
In case that a preset minimum level of vacuum (M_LEV) is not reached at the first reading time, the PFS is classified as defective as well (a large leakage is detected).
2.2.2. Product Sterility Issues:
The application of a differential pressure to a PFS, such as that of vacuuming phase, may cause the PFS plunger to move outwards and consequently move back to the ordinary position once the testing phase has been completed and, therefore, the differential pressure has been removed. This plunger movement might induce entry of unwanted foreign matter and cause drug product contamination. PFSs, as every other parenteral package system, must ensure drug product stability and sterility throughout the entire shelf life, hence any potential plunger movement is to be avoided.
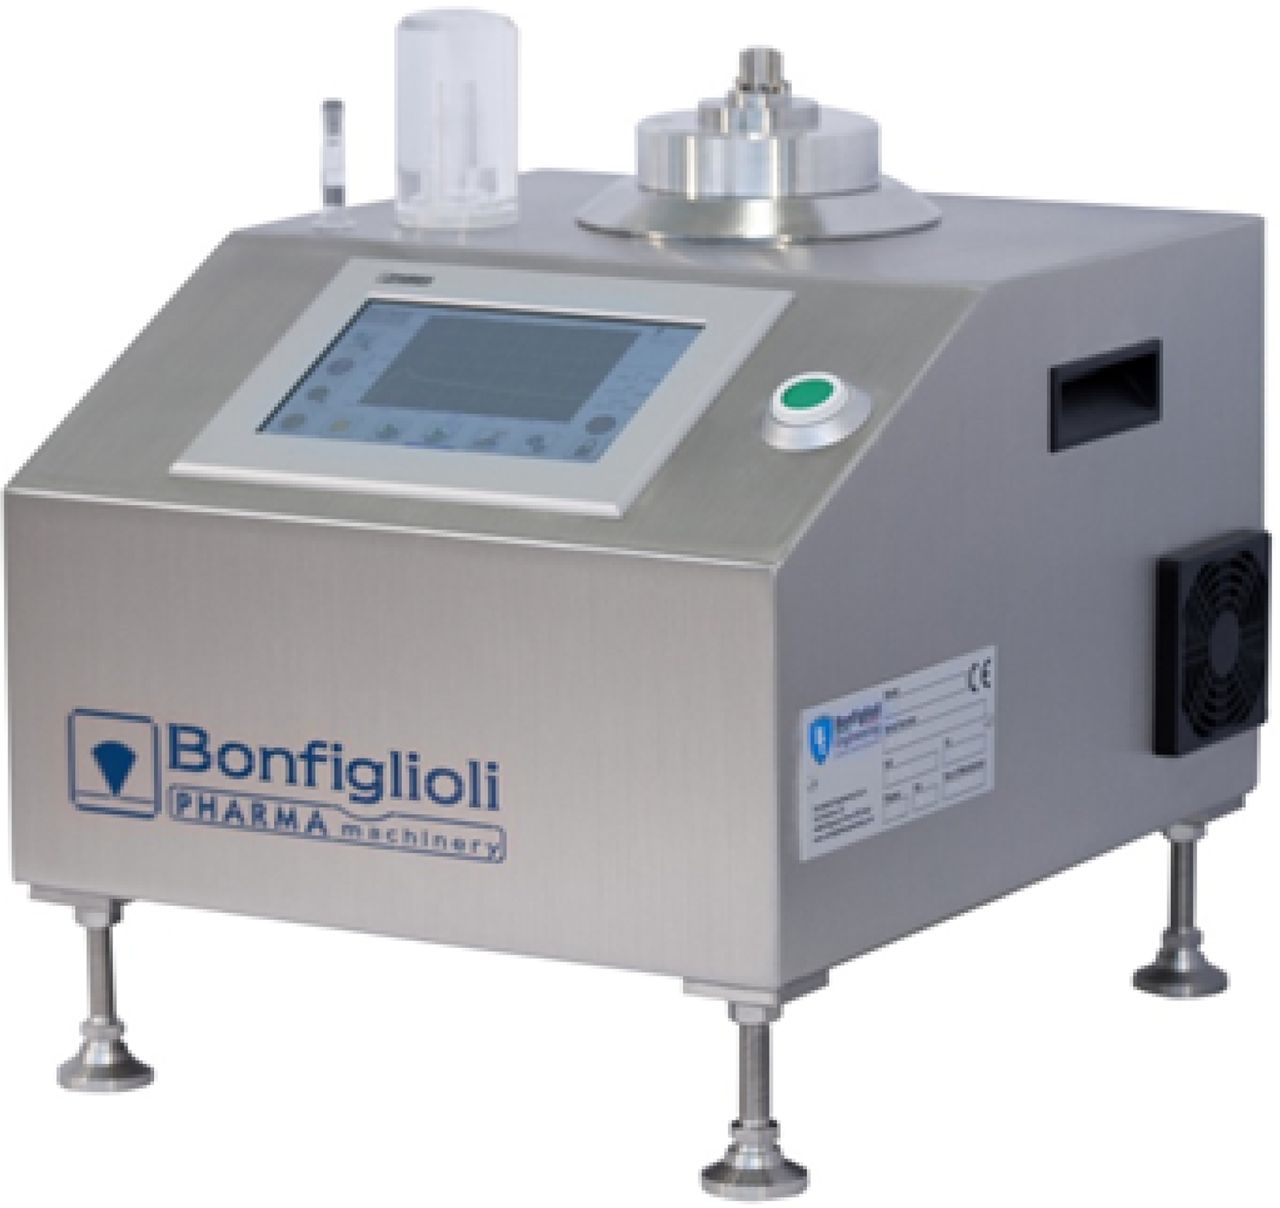
2.2.3. Equipment Overview:
The equipment employed in the Stage 1 is of the laboratory type to test PFSs by using the VDM (Figure 5). One test chamber is installed on the equipment frame (refer to Figure 3) and is made up of
a fixed bottom part which is connected with pneumatic actuators and vacuum transducer
a removable top part (cap) which allows to plug up the testing chamber before testing cycle start. The test chamber fixed bottom part is equipped with a mobile piston plunger stopping device (PSD) having vertical motion between two limit positions, “high” and “low”, and having a section equal to that of the PFS plunger.

VDM equipment.
The test chamber removable top part used in the case study is made of clear polycarbonate plastic providing full visibility of the PFS plunger behavior during CCI testing execution. The vacuum that is generated in the test chamber during phase (a) (refer to Figure 3) produces an upward movement of the PSD. Once the PSD comes in contact with the PFS plunger (“high” position), this exerts a force equal in magnitude and opposite in direction to that of the plunger itself. The same “high” position is kept until the second reading; at that time the action of a dedicated pneumatic actuator provides for exhaust of vacuum in the test chamber bottom area and produces the PSD downward movement towards the “low” position. Therefore, the original position of the plunger within the PFS is maintained during the entire VDM testing cycle. Importantly, this system demonstrated that the application of differential pressure between the inside and the outside of the PFS to perform the CCI testing, which is based on VDM, does not have any negative impact on the product sterility and safety.
The aim of the measurement system design is to maximize performance, reliability, and flexibility. Regarding performance, the PSD motion leads to a significant decrease in the test chamber residual volume during the CCI testing execution and, therefore, to an improvement in the system sensitivity; moreover, the type and position of pneumatic actuators in the mechanical structure lead to a more efficient and quicker vacuuming and stabilization phases, thus resulting in a more accurate first reading measurement. CCI testing outcomes reliability is then ensured by the PSD itself: On one hand, the plunger movement determines a change in the PFS headspace volume, a consequent reduction in the pressure differential between the inside and the outside of the PFS, and hence it may cause a decrease in sensitivity of the CCI method with a potential increase in the false-negative results. On the other hand, plunger movement results in a decrease of test chamber residual volume and may involve a subsequent increase of false-positive results. Finally, the test chamber model is applicable both to laboratory units and to “in-line” equipment, requiring no adjustment, resulting in the same level of precision in the measurement quality and confirming the flexibility of this innovative system design.
2.2.4. Case Study Execution—Stage 1:
Recipe parameters that were used are shown in Table III. Sample test kits were subjected to VDM, one by one, 15 times. The first reading and Δ resulting raw data were gathered; because all first reading values were above the preset M_LEV, the analysis was narrowed down to Δ values. Mean and standard deviation values were calculated for each individual group (negative controls, 5/10/20 μm laser-drilled holes, and 5/10/20 μm capillary tubes). The Kolmogorov-Smirnov test confirmed the normality of the raw measurements, allowing for statistical evaluation of process sigma level. Resulting data were then organized to document (refer to Table IV) the percentage of
positive controls, out of the whole set, which were indeed found positive by VDM (DRPC)
Negative controls, out of the whole set, which were indeed found negative by VDM (DRNC)
FNR and FPR values are reported as well.
Recipe Parameters—VDM (ASTM F2338) Equipment
Stage 1. VDM (ASTM F2338)—Test Results
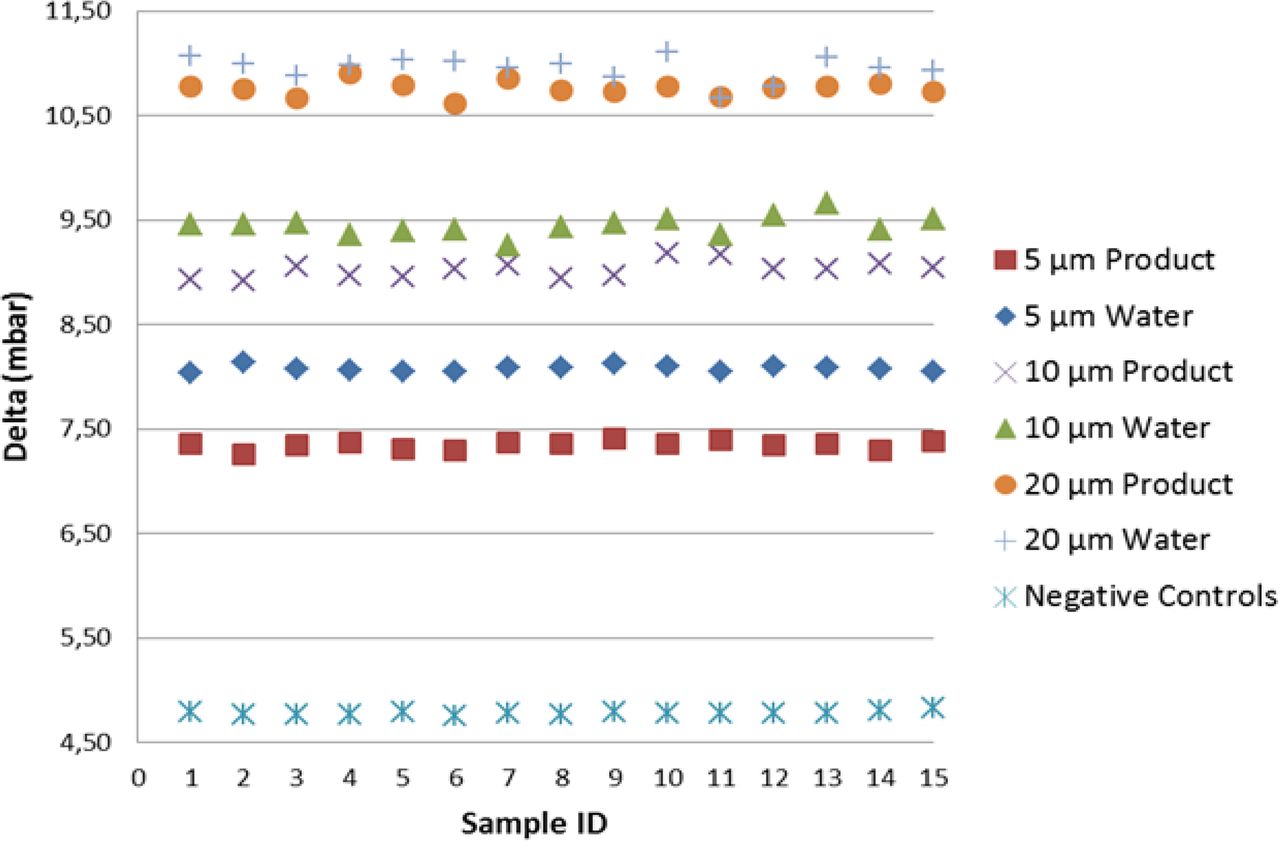
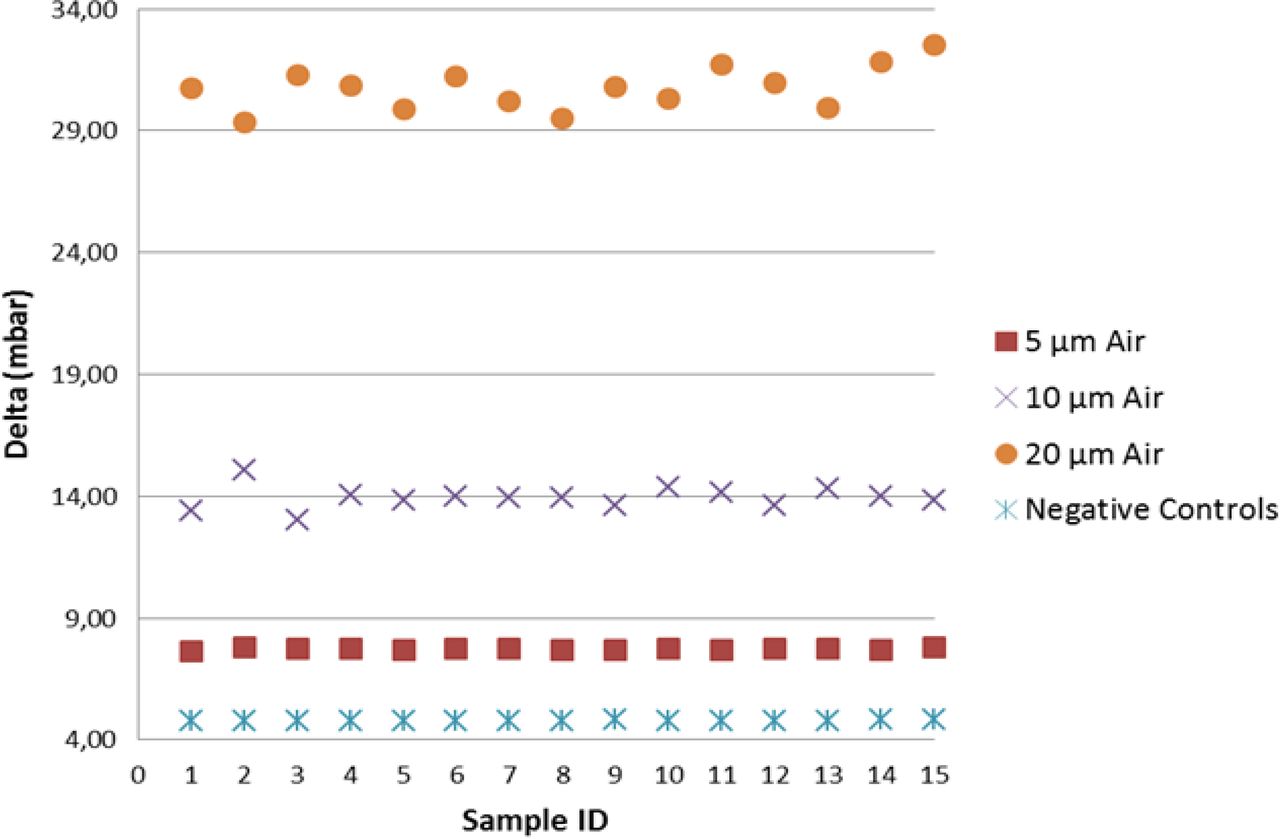
As shown in Figure 6, including the mean of the multiple measurements, the detection of real product–filled positive controls resulted in lower vacuum decay values than those of sterile water, by virtue of slight reduction in the vaporization capability. Note that by focusing on the worst-case scenario (real product), the detection of positive controls was found significant at the 7.2 sigma level, therefore demonstrating negligible false-negative and false-positive probability. Regarding the positive controls with the holes in position “A”, a growing spread of the groups is observed (refer to Figure 7); this confirmed that laser-drilled holes exposed to air led to higher vacuum decay values, which was foreseeable due to the small density of air as compared to real product/sterile water.

Negative controls versus positive controls (position “B”): VDM test results for negative controls and positive controls (5/10/20 μm laser-drilled holes exposed to sterile water (“Water”) and to real product “Product”). For each individual replication, on the x-axis, the average vacuum decay values “Delta” are plotted on y-axis. Average delta values are calculated on the 10 element sample as shown in Table I.

Negative controls versus positive controls (position “A”): VDM test results for negative controls and positive controls [5/10/20 μm laser-drilled holes exposed to air (“Air”)]. In this investigation positive controls are filled with real product.
2.2.4.1. Laser-Drilled Holes versus Capillary Tubes:
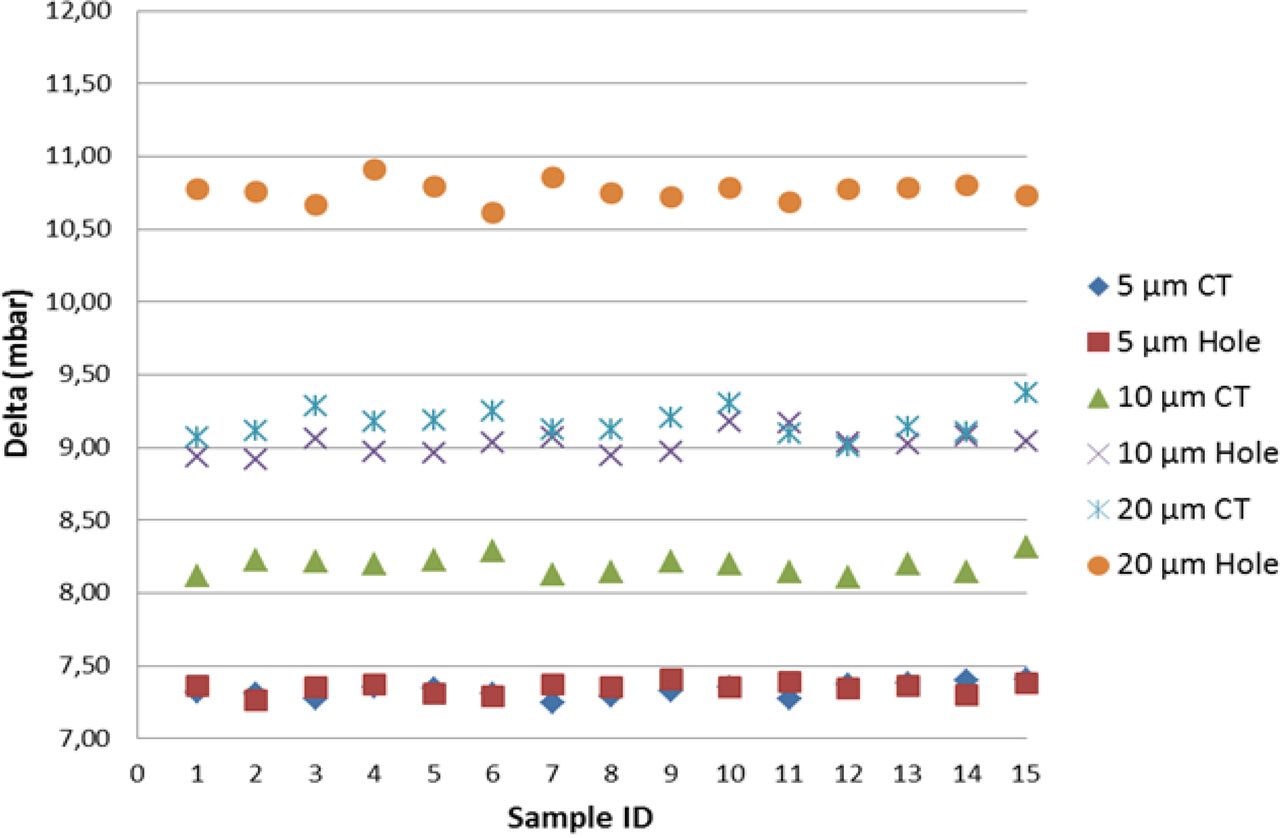
An excellent correlation (difference in vacuum decay values below 0.2%) was found between laser-drilled holes and capillary tubes in the 5 μm group (refer to Figure 8), whether the defect was exposed to sterile water and to drug product (position “B”) or to air (position “A”). This all points out how the two different methodologies developed for positive controls implementation produced parallel results, even though the leakage took place in two channels having length and diameter different from each other (refer to Tables I and II). For as much as it appeared that the defect in position “B” was the most interesting case, with reference to 10 μm and 20 μm groups, capillary tubes led to lower vacuum decay values than those produced by laser-drilled holes (−9% for the 10 μm group, −15% for the 20 μm group). Therefore, the application of the same differential pressure (980 mbar) between the two ends of the laser-drilled hole (respectively 10 μm and 20 μm in diameter and 2 mm in length) and of the capillary tube (respectively 40 μm in diameter and 13 mm in length for the 10 μm capillary tube and 75 μm in diameter and 28 mm in length as for the 20 μm capillary tube) produced, in the former case, thus at the same flow rate, a quicker product leakage vaporization and therefore a higher vacuum decay.

VDM test results for positive controls and correlation between (a) 5/10/20 μm laser-drilled holes (“Hole”) exposed to real product, and (b) 5/10/20 μm capillary tubes (“CT”) in position “B”.
2.3. DIT
2.3.1. Method Overview and Guidance:
The DIT is a destructive method widely used within the pharmaceutical industry for CCI assessment. It uses methylene blue dye or another colored liquid to determine whether or not there is a closure integrity failure. The test is performed by placing the PFS into a vessel previously filled with an aqueous dye solution and by producing a differential pressure. If there is a leak, the dye solution seeps into the PFS by capillary action, thereby giving visual indication of the integrity failure.
Soon after the DIT test execution is over, the PFS content is examined by three qualified inspectors for evidence of dye penetration; an optical desk as specified in the European Pharmacopoeia (7) is used for this purpose, which is a box with two backboards, the left one as a non-glare white panel and the other a matt black one positioned on the right. PFSs are individually held by the operator in front of the white background for about 5 seconds while examining the contents for presence of dye solution. In this instance, the aforesaid procedure is not repeated in front of the black background, as the aim is to detect blue traces in a transparent/opalescent liquid product.
Regarding the decision-making phase, the following criterion was established: each tested PFS was classified as non-conforming if at least two out of the three inspectors detected traces of dye solution (“dye visible”) in its barrel chamber or in the first/second rib of its plunger. On the other hand, the conforming outcome was referred to a condition in which the dye was not visible. Regarding the presence of the dye solution in the third rib zone, this was not deemed as indicative of PFS closure integrity failure. Indeed, according to the plunger's supplier declaration (quality statement), the third rib is only aimed at implementing a functional coupling between the plunger and the rod.
Additional PFS samples are to be used while performing the DIT:
One reference positive control to be included in the sample test kits set to confirm the DIT session validity; the DIT session is considered valid if the dye solution is visible within this sample. With reference to Stage 2 and Stage 3, the positive control PFS was filled with water and provided with a stainless steel wire of 0.040 mm diameter between plunger and barrel.
Two known reference negative controls, which are not immersed in the dye solution, to be used as colorimetric benchmark; when visual inspection is performed they are placed sideways to each PFS previously subjected to DIT, thus providing the operator with a visual reference.
Two distinct approaches were followed in the case study, the one in compliance with United States and European Pharmacopeias, therefore called Pharmacopoeial, and the other in agreement with Novartis standard, named Specific. The details regarding the development of such DIT methods are given in the following sections.
2.3.2. Pharmacopoeial DIT:
2.3.2.1. Test Description:
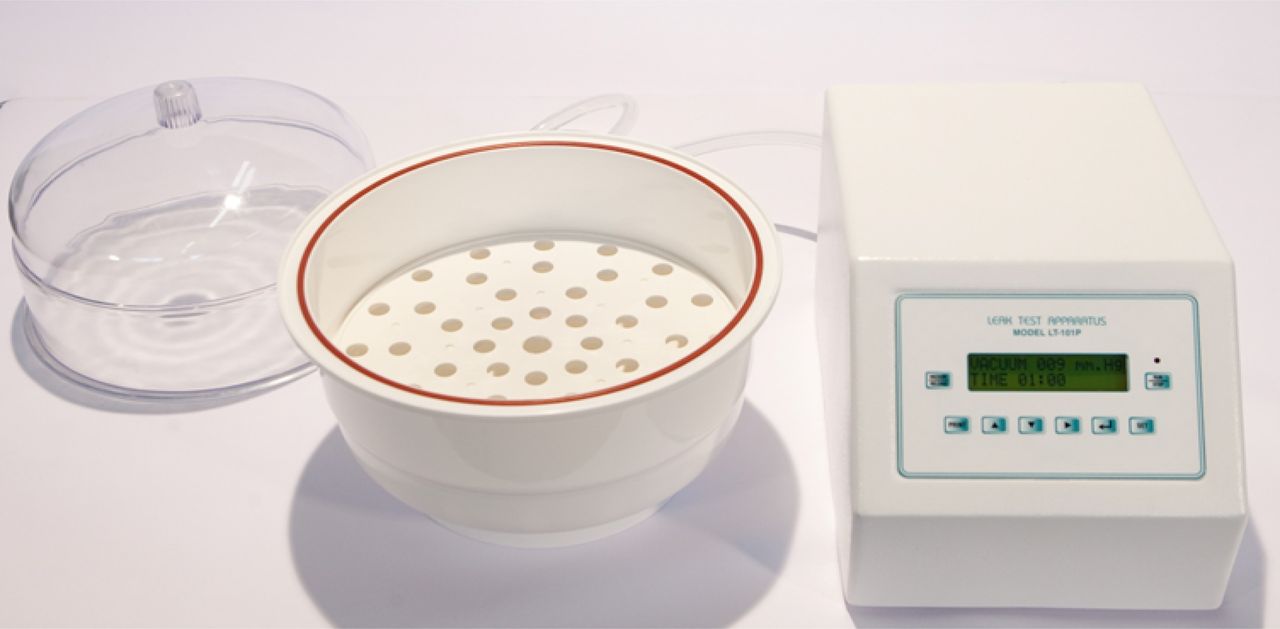
This approach is based on the United States and the European Pharmacopeias (8, 9); the procedure consisted of immersing the sample test kits in a dye solution made up of 0.1% aqueous methylene blue and challenging them with a −270 mbar vacuum for 10 min, followed by a return to atmospheric pressure for 30 min. After immersion, the sample test kits are cleaned and visually inspected for the presence of the dye. The equipment used for this purpose is made up of a desiccator cabinet connected to a vacuum pump; vacuum levels and timings are regulated by a dedicated controller (Figure 9).

Pharmacopoeial DIT method equipment.
2.3.2.2. Case Study Execution—Stage 2:
Negative controls and positive controls (laser-drilled holes) were subjected to the DIT in agreement with the aforementioned specifications. A wire mesh was placed in the vessel, on the top of the samples, ensuring their complete submersion in the dye solution. After test completion, the samples were taken out from the vessel and rinsed with water; indeed, the reference positive control PFS resulted positive to DIT, attesting the validity of the session. At this stage three qualified inspectors performed visual inspection of the tested samples by using the two known negative control PFS as a reference. Most of the visual inspection outcomes were consistent between the three inspectors; due to the resulting DRPC values, dye penetration capability appeared unsatisfactory for all positive controls as shown in Table V. In addition, a negative control FPR > 0 was originally not foreseeable; indeed, dye solution was visible in the second rib of two negative controls out of 60. The two PFSs and their respective plungers were checked for possible failures and were found compliant with integrity/quality expectations. Such results may be considered as a proof of the unreliability of the DIT method.
Stage 2. Pharmacopoeial DIT—Test Results
2.3.3. Specific DIT:
2.3.3.1. Test Description:
A second validated method (10, 11) is executed by submerging the sample test kits entirely in an aqueous dye solution with 1% concentration of methylene blue. The rationale for this method was established to be aligned with ASTM conditions for PFS air transportation (12). The specific DIT is comprised of the following steps:
apply a vacuum of −400 ± 50 mbar for 60 min
return to atmospheric pressure for 10 min
create a positive pressure +400 ± 50 mbar for 60 min
return to atmospheric pressure for 10 min
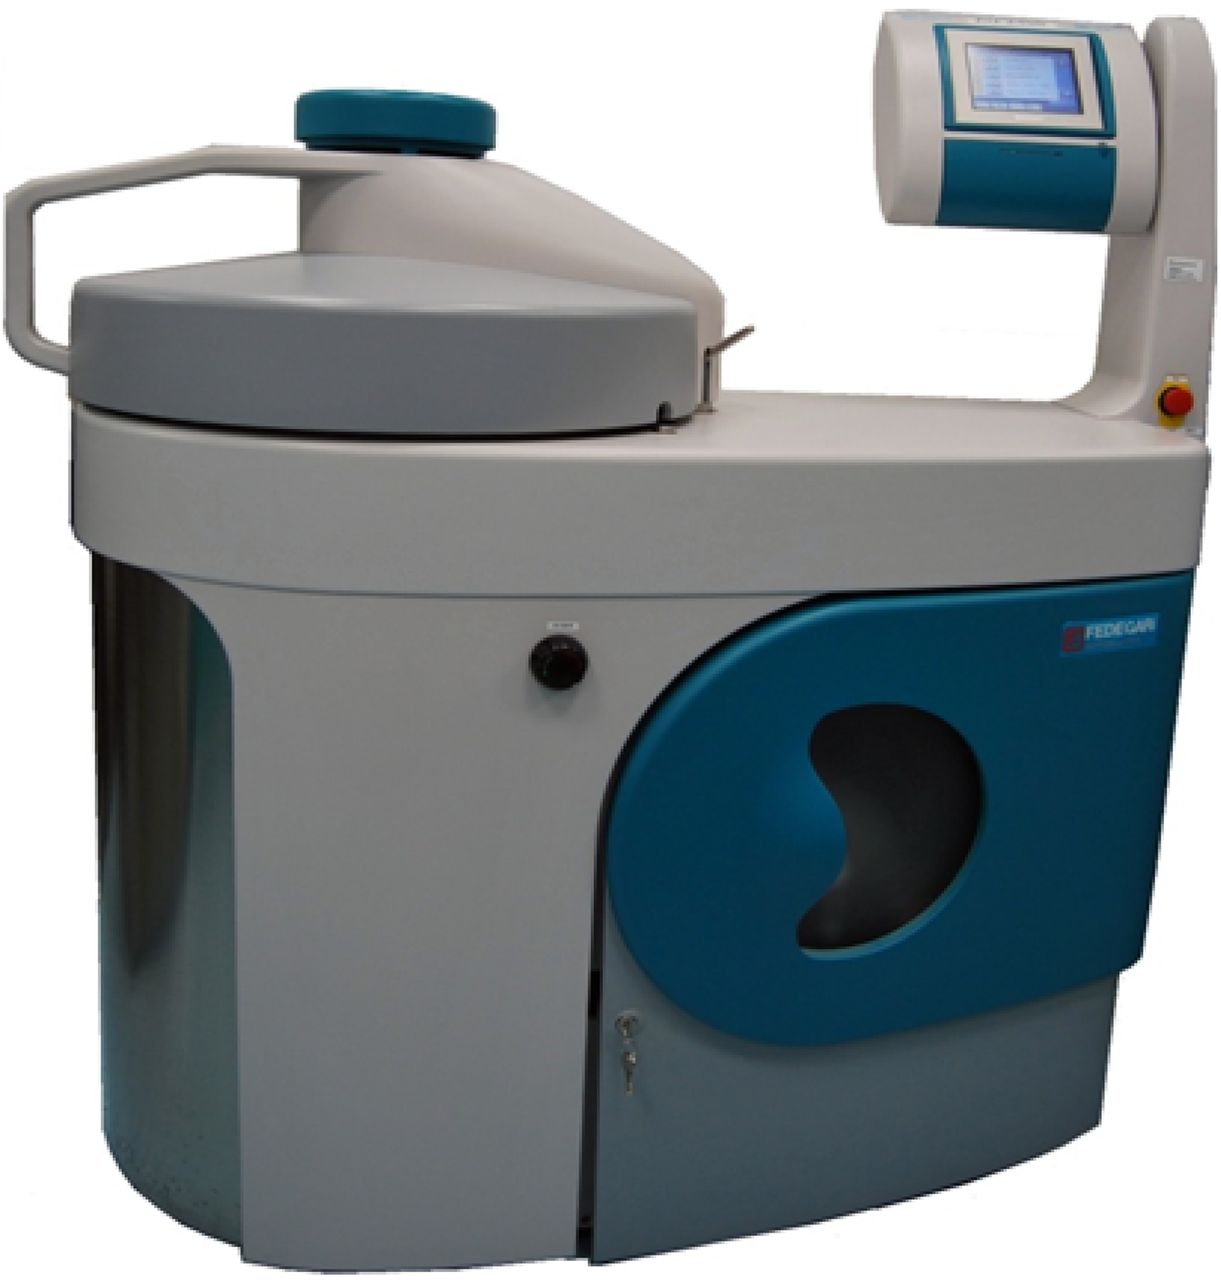
The vessel is then opened and all the tested PFSs are subjected to the planned visual inspection following appropriate cleaning. The equipment used (Figure 10) is an autoclave complete with a vacuum pump and connected to a compressed air line, respectively providing negative and positive pressures as specified above.

Specific DIT method equipment.
2.3.3.2. Case Study Execution—Stage 3:
Negative controls and positive controls (laser-drilled holes) were placed into separate beakers, each containing 800 mL of the dye solution; such beakers were then loaded into the test equipment and subjected to the specific DIT process. The same approach as Stage 2 was adopted both in the visual inspection procedure and in the arrangement of test results as shown in Table VI. These data confirmed that the application of a more challenging test methodology resulted in a higher DRPC, achieving at least 20% improvement in performance. No false-positive results were observed in this stage.
Stage 3. Specific DIT—Test Results
2.4. HVLD
2.4.1. Test Description:
The HVLD method exploits the electrical conductivity of the packaged liquid product in an electrically insulated container. In the Stage 4 background, a high-frequency voltage potential is applied to the PFS by means of two electrodes, and the discharge current is measured. If cracks or pinholes are present on the PFS surface, the circuit capacitance is decreased while the current flow between the electrodes is increased. The range of acceptable values is established in the recipe characterization phase, which takes place prior to the HVLD test execution, aiming to provide the system with parameters in order to decide whether the tested PFSs are conforming or not. Criteria for approval and rejection are established by comparing, respectively,
the discharge current peak P to an upper bound (max peak) and to a lower bound (min peak)
the discharge current peak subtended area A to an upper bound (max area) and to a lower bound (min area)
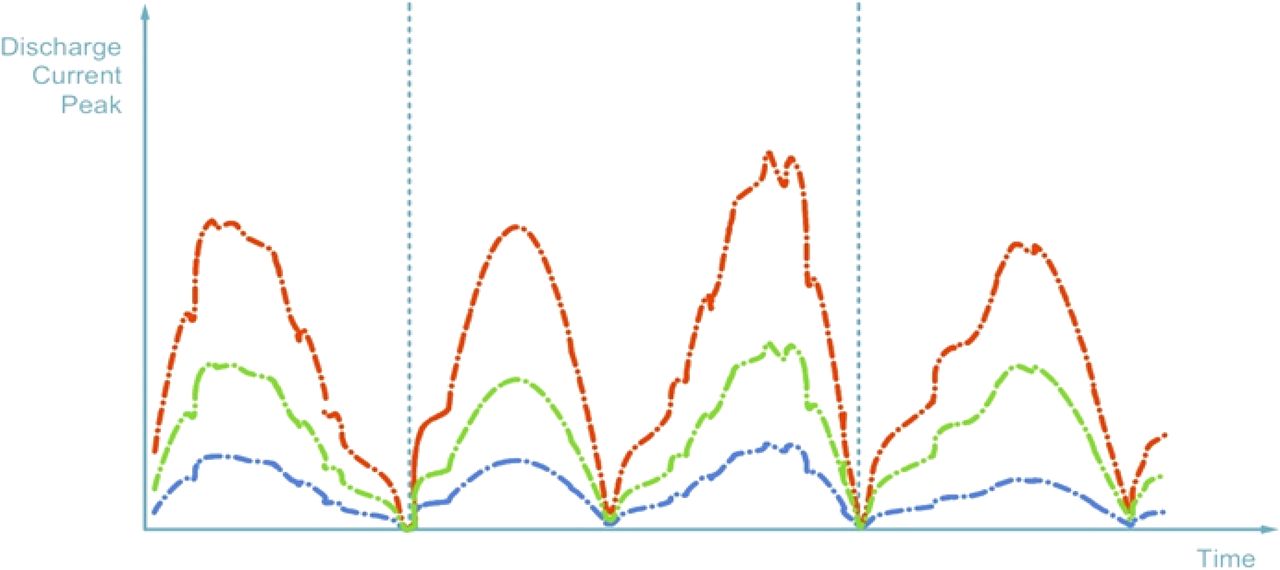
The PFS is classified as conforming if min peak ≤ P ≤ max peak or if min area ≤ A ≤ max area; otherwise the PFS is rejected (refer to Figure 11). In Figure 11 typical discharge current trends are showed with reference to
a conforming PFS (green)
a defective PFS with micro-defect (red)
a defective PFS with large defect or an empty PFS (blue)

Possible test results for HVLD method: curves shown are representative of the discharge current trends obtained in three typical cases in relation to PFS conformity or defectiveness.
2.4.2. Equipment Overview:
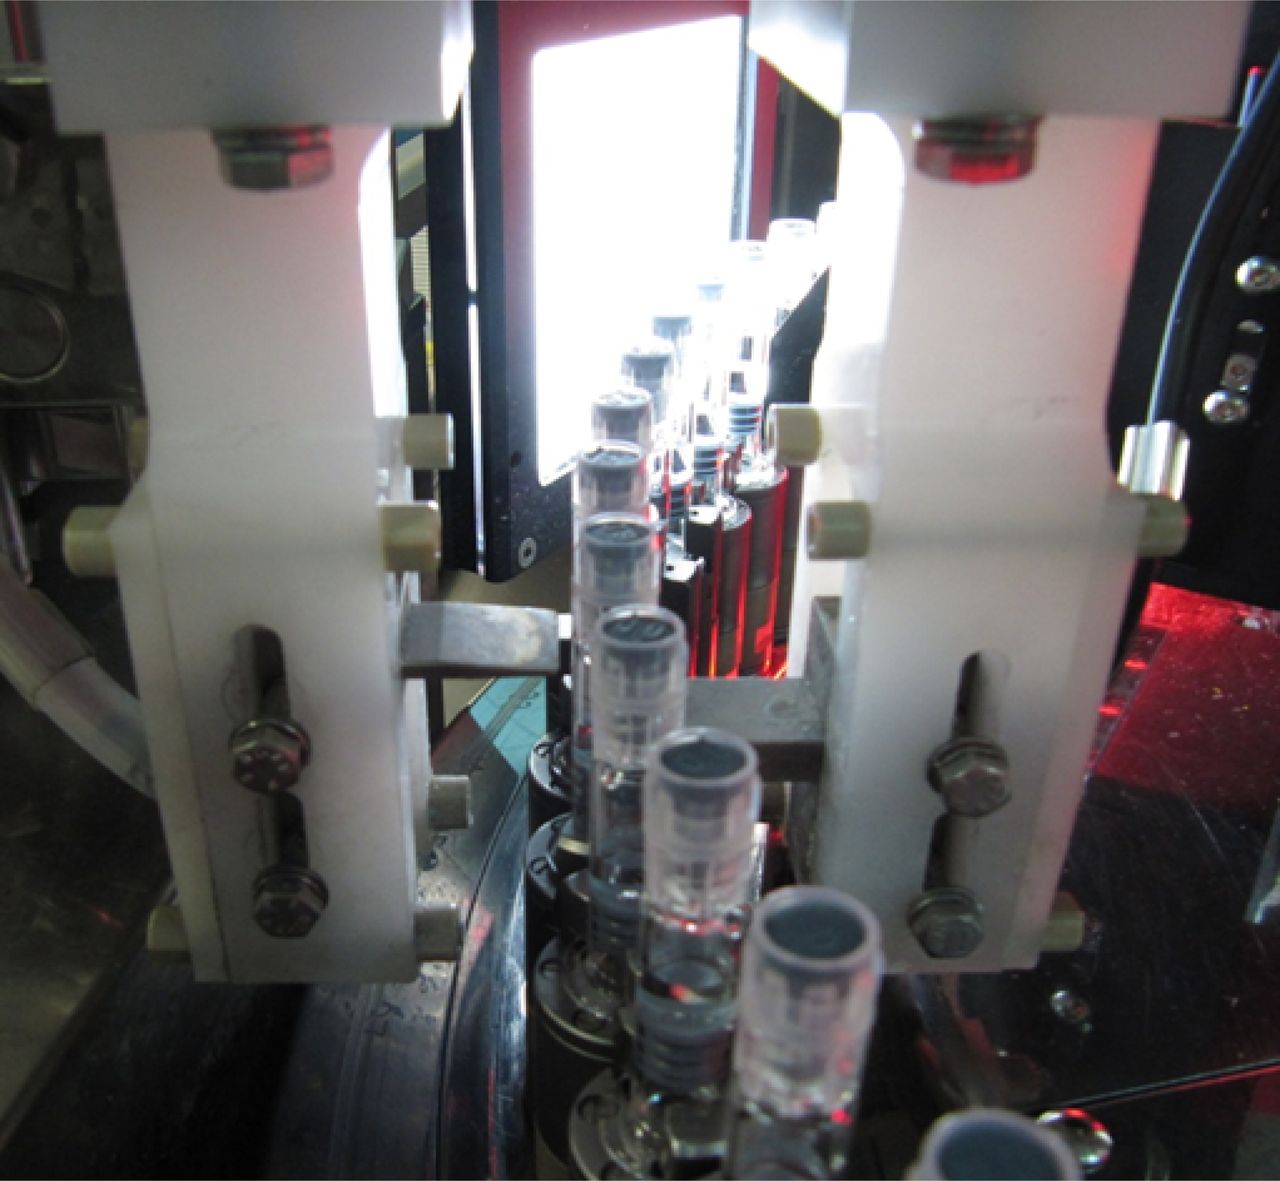
The equipment is of the in-line type at continuous operation, to perform the 100% visual inspection of the production providing a 500 containers-per-minute output rate. The referred HVLD system (refer to Figure 12) is straddle-mounted on the central turret infeed of the aforementioned equipment; PFSs are held in a vertical position while being transported through the equipment's visual inspection area and are one by one exposed to the HVLD system electrodes in a continuous rotation along their vertical axis, allowing CCI testing on the whole external surface. The rotation of the PFS allows for making the barrel internal surface wet by the liquid product; this is a basic requirement for assuring the proper detection capability of the HVLD system.

HVLD system.
2.4.3. Case Study Execution—Stage 4:
Both positive and negative controls were filled with real product only; indeed, the minimum conductivity required for the HVLD proper functioning is 5 μS/cm. Positive control PFSs with serial numbers #30 and #41, in addition to aforementioned unit #60, were excluded from the sample test kits set because they were broken by manual handling. The equipment was mechanically configured to allow the repetitive passage of PFSs through the HVLD system only. The recipe parameters in Table VII were achieved from the characterization phase and used in this test stage. Fifteen individual tests were carried out on each and every PFS; the HVLD test took place in two successive stages, first the positive control set and then the negative one. During the progress of the work, a lack of repeatability was observed (refer to Table VIII); in particular, six positive control samples (serial numbers #21, #23, #29, #43, #57 and #58) were not detected in all 15 replications. These samples were investigated for possible clogging and, therefore, for consistency with the required flow rate (refer to Table I) by using a pressure generator connected to a calibrated flow meter; the respective certificates of calibration were also taken as reference. All of the checked samples were found compliant with respective flow rate specifications, thus confirming the validity of these positive control samples. On the other hand, DRPC of 5 μm laser-drilled holes and DRNC reached 100%.
Recipe Parameters—HVLD Equipment
Stage 4. HVLD—Test Results
3. Conclusion
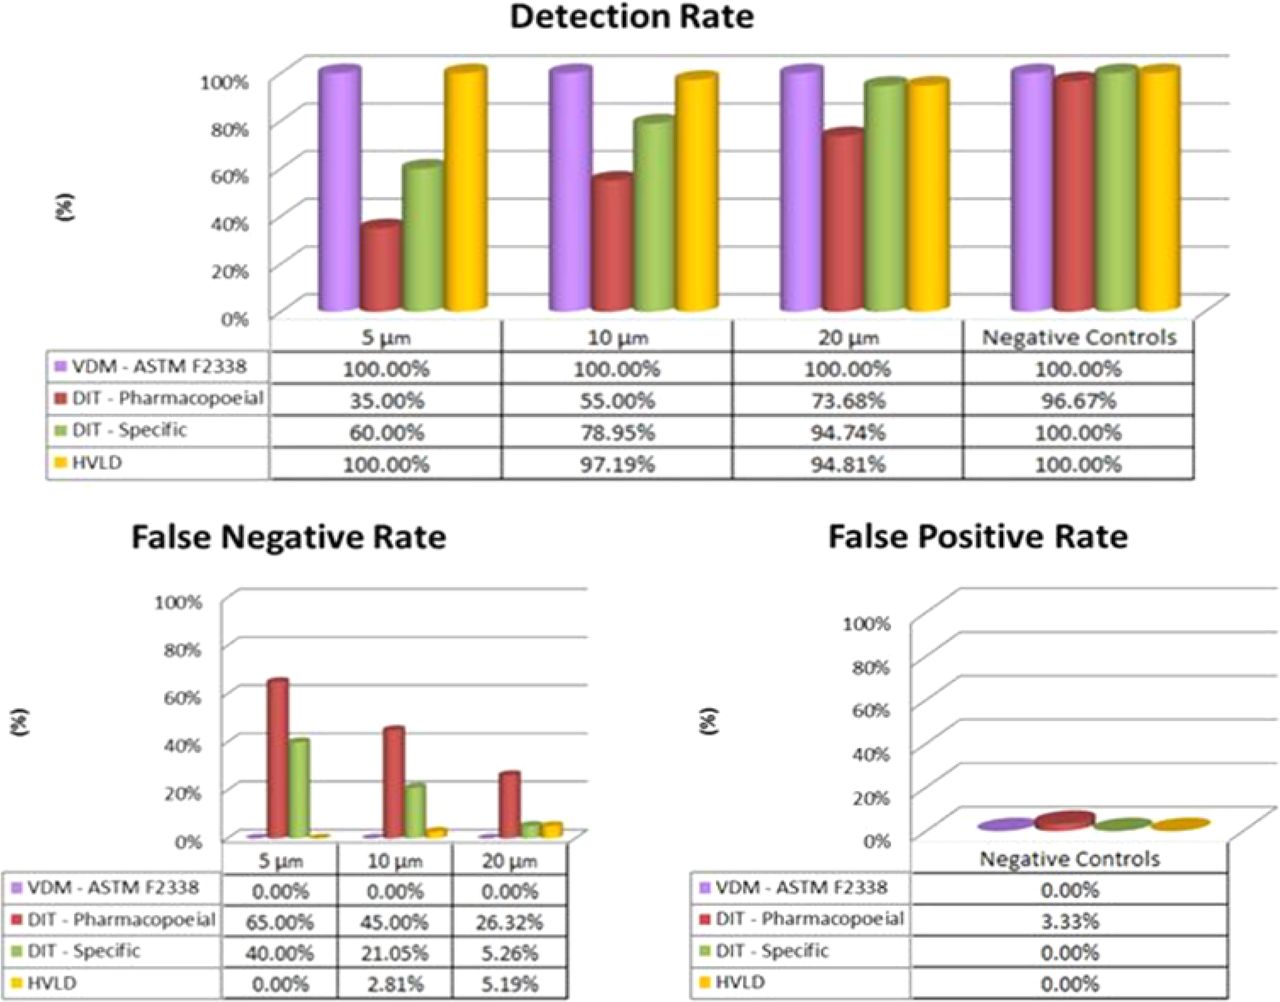
This study provides important contributions to foster a better understanding in the adoption of CCI testing approaches, both non-destructive (VDM and HVLD) and destructive (DIT). The investigation was carried out on suitable sets both of conforming and defective glass syringes pre-filled with a vaccine and sterile water. Known defects, of various sizes, were created by laser-drilling leak paths through the syringe barrel. The main purpose was to perform comparative studies of such methods applied to PFSs and to focus specifically on gathering evidence of known defective sample detection capability and of false results rate. The results, summarized in Figure 13, highlighted certain advantages of CCI based on VDM over the compared methods. Moreover, the VDM proved its effectiveness in combination with an innovative system preventing plunger movement during the CCI testing phase. On the other hand, DIT methods pointed out several limitations while HVLD showed lower repeatability of results. Parallel studies concerning the application of VDM to laser-drilled PFS and PFS with leak paths present through the plunger were undertaken, and a clear correlation between two distinct positive control implementation approaches was determined.

Comparison of results of the four CCI methods. The percentage values are relative to individual performance indicators: Detection Rate (top panel), False Negative Rate (bottom left panel), False Positive Rate (bottom right panel). The following colors code are used: (1) lilac—VDM (ASTM F2338), (b) red—pharmacopoeial DIT, (c) green—specific DIT, and (d) yellow—HVLD.
Conflict of Interest Declaration
The authors declare that they have no competing interests.
Acknowledgements
Bonfiglioli Engineering S.r.l. and Novartis Vaccines are acknowledged for equipment and technical support provided for the duration of this study.
- © PDA, Inc. 2015


