
Abstract
Filling of high-concentration/viscosity monoclonal antibody formulations into vials or syringes by peristaltic pumps is an industrial standard. Control of the peristaltic pump on fill weight/volume accuracy/precision over time, however, has not been fully disclosed in the literature. This study systematically evaluated the impact of a broad range of system/pump parameters, from tubing setup to pump parameter settings to the filling nozzle, on filling precision using a bench-top system with fill weight readings from a high-precision balance. A low fill volume of 0.3 mL was targeted to fill liquids of various viscosities (including a high-concentration monoclonal antibody formulation). Fill weight precision was reported via percent of fill weight data points (at least 100 consecutive points) falling within 3% of the target fill weight (e.g., within 0.009 g for a 0.3 g target fill weight). Experimental results suggested that the 3% precision target is challenging for filling high-viscosity liquids due to run-to-run and day-to-day variability. More importantly, none of the system/pump parameters seemed to directly correlate with fill weight precision. Photograph analysis revealed liquid suck-back height variations during fill, which correlated well with fill weight variability. Suck-back height variation was attributed to two possible root causes: (1) inconsistent liquid stream separation point at the end of fill and (2) pressure-induced variations upon suck-back. Liquid stream break-up was influenced by liquid properties as well as liquid/nozzle interactions, and pressure variations might be associated with tubing and overall mechanism of the peristaltic pump. A custom nozzle tip design featuring a hydrophobic tip and a pressure-resistance barrier enabled consistent suck-back heights for each fill and approximately 90% of fill weight data within 3% precision for a high-concentration monoclonal antibody formulation.
LAY ABSTRACT: Vial and syringe filling by peristaltic pump is considered a well-established manufacturing process and has been implemented by numerous contract manufacturing organizations and biopharmaceutical companies. However, its technical details and associated critical process parameters on fill weight precision are rarely published. Such information on high-concentration/viscosity formulation filling is particularly lacking. This study aimed to identify critical filling parameters that dictate a tight control on fill weight precision. The findings of this study indicate that mitigating suck-back height variation is the key to achieving improved fill weight precision. Liquid properties, the influence of liquid/nozzle interactions, and pressure variations during suck-back are inherent to fill weight variations. Optimizing fill weight precision by manipulating pump system parameters is not a root-cause solution. The outcomes of this study will benefit scientists and engineers who develop pre-filled syringe/vial products by providing a better understanding of high-concentration formulation filling principles and challenges.
- Peristaltic pump
- High-concentration monoclonal antibody
- Fill weight precision
- Suck-back
- Liquid/nozzle interactions
Introduction
Pharmaceutical product fill/finish manufacturing facilities traditionally use the piston pump because of its high level of filling accuracy and precision (1,2), particularly for low-volume fills (≤0.3 mL). This trend is, however, shifting toward peristaltic pump (PP) technology (3,4). PPs are highly user friendly and, more importantly, allow direct contact with the product only via a single piece of tubing, which can be easily cleaned or replaced after use. This single-use feature offers an advantage in aseptic filling operations. In addition, PPs render less stress to biopharmaceutical products, for example, proteins and monoclonal antibodies (mAbs), compared with piston pumps, in which a high-shear zone exists in the narrow clearance (gap) between the piston and the pump housing that tends to shear and grind a protein solution to generate particles (5⇓–7).
The major concern with using PPs in pharmaceutical product manufacturing is its fill accuracy (i.e., deviation from the target fill weight). The use of PPs is particularly challenging at low fill weights/volumes, while meeting stringent industrial standards (i.e., ±0.5% for fill volumes ≥0.5 mL and ±1% for fill volumes ≤0.5 mL) (3). Dose accuracy/precision criteria in pre-filled syringe products are, in general, more stringent than those of their vial counterparts because the entire dose within the syringe will be injected into a patient, whereas a partial dose can be extracted from the vial. There is limited information on the topic of fill weight precision in the scientific literature. Peterson and co-workers (1) compared fill accuracy of four filling systems (piston pump, rolling diaphragm pump, time pressure system, and PP) using water and phosphate-buffered solution. Their data suggested that the PP is indeed the least accurate among the four systems, but it was still able to meet the acceptance criterion for fill volumes as low as 0.07 mL. They also noted a downward drift of fill volume when using the PP as a result of the silicone tubing being flattened by the rollers of the pump. Despite the tight tolerances and the drift tendency, fill accuracy of the PP becomes less of a manufacturing concern because fill weight/volume can be calibrated via manual in-process control or via an automated closed-loop inline weigh-check control system (3). Precision remains, however, a poorly understood characteristic of PPs and a challenging issue in manufacturing.
The purpose of this investigation is three-fold: (1) to understand the limit of fill precision of a PP in the low-volume fill (0.3 mL) of high-concentration mAb formulations, (2) to identify the underlying mechanism affecting fill precision, and (3) to improve fill weight precision via mitigation of that underlying root cause. There are no clear regulatory requirements on fill weight precision, which is often determined by filling capability at the manufacturing sites based on the level of target fill weight/volume. The precision of filling pharmaceutical liquids is typically set at 3–5% of the high fill volume (i.e., ≥1 mL) and can be 10% of the low fill volume (i.e., ≤0.2 mL) (unpublished data). Our goal was to achieve 3% precision at a 0.3 mL target fill volume for a fluid with high viscosity (up to 10 cP).
Materials and Methods
All experiments in this study used purified water, a mAb A formulation (200 mg/mL; produced at Genentech, South San Francisco, CA), or a sucrose solution (48% w/w). The mAb A was formulated with arginine salt. For each experiment, 200 fills of a liquid were dispensed into a 200 mL polyethylene terephthalate glycol (PETG) bottle (receiving vessel) via different types of filling nozzles using the bench-top filling system described below. A variety of straight-shaped nozzles of different sizes (inner diameters [ID] and wall thicknesses) constructed from various materials were evaluated in this study, as listed in Table I.
Straight-Shaped Filling Nozzles Evaluated in Filling Precision Experiments
Bench-Top Filling System
A Flexicon PD12 PP system controlled by a Flexicon MC12 control unit (Watson-Marlow Flexicon, Ringsted, Denmark) was used for filling. Two pieces of 1.6 mm ID pump tubing (G30417-10, Sani-Tech®, Saint-Gobain, Valley Forge, PA) were connected via a Y-connector pre- and post-pump. The 3.2 mm ID pre-pump tubing (G30417-15, Sani-Tech®) was connected to a liquid reservoir; the same tubing was used post-pump to the receiving vessel, which was placed on a high-precision weighing scale (XP1203S, Mettler Toledo, Greifensee, Switzerland). Each fill was weighed and recorded through a computer using WinWedge v3.4.3 software (TAL Technologies, Philadelphia, PA). For some fills, a camera (Canon 5D, Canon, or iPhone, Apple) was used to monitor the filling process.
Pump/Filling Operation and Experiments
Filling experiments used the PP at a pre-set velocity of 600 rpm and acceleration setting of 125. Suck-back (SB) was set at 0 (SB0), 3 (SB3), or 4 (SB4). For the Flexicon PP, the acceleration and SB settings are nominal numbers with no units attached. The range for acceleration settings is 1–200 and the range for SB settings is 1–10. Prior to each experiment, the PP was calibrated to a fill volume of 0.3 mL. To calibrate the PP, a series of five fills were dispensed and weighed. The average fill weight of the five fills was calculated. If the average fill weight was within 1% of the target fill weight, then the fill weight was accepted; if it was not, the PP was recalibrated using the “calib” function on the control unit, and the process was repeated.
Viscosity Measurement
The method for measuring viscosity was identical to what has been described in a previously published manuscript (9).
Results and Discussion
Establishment of Experimental Setup and Initial Evaluation of Filling Parameters on Fill Weight Precision
PPs dispense liquid based on positive displacement. As liquid enters the pump head in the tubing, it becomes trapped (or occluded) between two rollers, which is designated as the “pillow” as the rollers pinch the tubing against the wall of the pump head. Liquid flow discontinues at the pinched area (called the “void”). If the pump operates at a constant speed, the rollers move forward and push the liquid out in pulsation (i.e., the pattern of pillow-void). For syringe/vial filling, the fill nozzle typically dives into the container and delivers the liquid while retreating out of the syringe/vial. Thus, in synchronization with fill-nozzle movement, the pump needs to deliver liquid continuously with minimum pulsation in order to achieve acceptable fill accuracy/precision. Innovations in PP technology have been focused on removing (or reducing) the pulse. Two design features have been most successful: the use of two offset roller sets, and multiple rollers (3,8). Although the Flexicon pump used in this study features two offset rollers, it remains unknown whether pulsation is an inherent limitation in accuracy/precision for low volume/weight fills.
A systematic investigation assessing the impact of various parameters associated with the PP (Table II) on fill weight precision was first attempted. These parameters can be categorized into five different groups: pump setting, tubing size, setup configuration, nozzle characteristics, and liquid properties. A target fill volume of 0.3 mL was selected to fill water, 48% sucrose solution (density of 1.145 g/L and viscosity ∼10 cP at ambient temperature), or mAb A formulation (density of 1.06 g/L and viscosity ∼10 cP at ambient temperature). Fill weight experiments were initially performed on filling these liquids to understand (1) the capability of the PP (precision under the optimized conditions), (2) the run-to-run and day-to-day reproducibility, and (3) the impact of liquid viscosity on precision. Based on their densities, the fill weights for the target fill volume of 0.3 mL are 0.3435 g for the 48% sucrose solution and 0.319 g for the mAb A formulation. Although fill-finish manufacturers typically use nozzles and tubing with ID sizes of ≤1.0 mm for a low-volume (<0.5 mL) fill, nozzle sizes of ≥1.5 mm ID were used in this study. The rationale of using larger-sized nozzles and tubing is two-fold: (1) small nozzle and tubing sizes make SB control difficult, especially for viscous liquids; (2) small tubing sizes (i.e., 0.8 mm ID) make pumping viscous fluids more difficult.
Initial Assessment of Potential Parameters Affecting Fill Weight Precision
A filling precision of 1%, 2%, or 3% is defined as the percentage of data points falling within the mean fill volume ±1% (i.e., ±0.003 mL), ± 2% (i.e., ±0.006 mL), or ±3% (i.e., ±0.009 mL), respectively, of the target fill volume.
The outcome of these initial studies (data not shown) suggested that SB has a direct impact on fill weight precision. Parameters related to the PP (e.g., velocity) and experimental setup (e.g., tubing length) also appear to affect fill weight precision, but in an inconsistent, irreproducible manner. Because the overall results were inconsistent and showed significant day-to-day variations under identical setup and conditions, subsequent experiments were performed with the following objectives: (1) to better understand the effect of SB on fill weight precision, and (2) to determine the root causes of fill weight variability.
Evaluation of the Effect of Suck-Back (SB) on Fill Weight Precision
Dripping is undesirable as it may cause splashing/bubbles/foaming of the liquid product, and it can also potentially result in fill weight variations. One liquid drop (e.g., water or liquids of similar viscosity) typically has a volume of approximately 0.05 mL. A drop of this size can easily swing the fill weight outside the 3% precision range for the target fill volume of 0.3 mL (3% equivalent to ± 0.009 mL). SB is an important pump function that reverses the pump and pulls the liquid stream back into the nozzle at the end of each fill to prevent residual liquid from dripping into the filled container. In addition, SB prevents nozzle clogging, which may occur due to solidification of a liquid drop at the tip of the nozzle during an extended process interruption (9,10). As determined in previous studies, nozzle characteristics (e.g., size and material) and liquid properties (e.g., viscosity, surface tension, contact angle, etc.) affect SB performance (9,10). Therefore, in this study, the effects of nozzle characteristics and liquid properties on fill weight precision were also investigated due to their potential impact on SB behavior.
The initial experimental setup described above was utilized to evaluate the effect of SB on fill weight precision. In addition, pump setting with fixed velocity (600 rpm) and acceleration (125) was used by default, and the SB setting was varied at 0, 3, and 4 to generate a representative data set that included multiple filling runs (typically >10 runs) performed across different days using different nozzle sizes and nozzle materials. Fill results are presented in 1%, 2%, and 3% precision and/or graphed based on box plots using a statistical tool (JMP® 10, SAS Institute).
Figure 1a shows box plots summarizing 15 fill runs of water and 24 fill runs of 48% sucrose solution/mAb A formulation for 1%, 2%, and 3% precision. Overall data (far left box for water and 48% sucrose/mAb A formulation) indicated significant variations for both water and 48% sucrose/mAb A formulation fills. Compared with 48% sucrose/mAb A formulation fills, water fills showed slightly better filling precision, for example, 64% (water) versus 59% (48% sucrose/mAb A) in 3% precision (Figure 1b). Water fills also demonstrate tighter run-to-run/day-to-day variations. These comprehensive data confirmed that although the PP is capable of delivering high-precision fill volume/weight (i.e., having precise mechanical controls), fill weight is sensitive to parameter/process changes, particularly in filling viscous liquids. The data shown in Figure 1 also confirmed that SB is a critical parameter for fill weight precision. Filling with SB (SB3 and SB4) resulted in highly variable fill weight results compared to filling without SB (SB0), which will be further discussed later.

(a) JMP® box plot comparing fill weight precision (3%, 2%, and 1% precision) for water and 48% sucrose solution/mAb A formulation. Data sets (15 runs for water and 24 runs for 48% sucrose solution/mAb A formulation, each run containing 200 fill dispenses) plotted into three groups: overall, filling without SB (SB0), and with SB (SB3 and SB4); (b) summary of filling precision obtained from the data in (a).
The fact that run-to-run and day-to-day variations became more prominent upon filling more viscous solutions (i.e., 48% sucrose solution and mAb A formulation) presents a daunting task for the PP to consistently fill low-volume viscous liquids meeting the target precision (i.e., having the majority of data points within 3% precision) set in this study. Identifying the root cause/source of fill weight variations would benefit the achievement of this goal.
Investigation of the Potential Root Causes/Sources of Fill Volume/Weight Variations
Fill weight variations may originate from two sources: “pillow-void” pulsation and inconsistent liquid-flow behaviors at the nozzle tip. Pulsation and mechanical controls of the pump are inherent to the pump, so they are not within the scope of this study. Because SB and liquid properties were found to consistently affect fill weight precision, subsequent studies, which included photograph analysis (visual observation), were performed to better understand whether inconsistent liquid flow behaviors at the nozzle tip are the root cause of fill weight variations.
Photographs were taken during a series of fills of 48% sucrose solution using a transparent glass nozzle (1.5 mm ID) to monitor the consistency of the liquid's SB height. Figure 2 shows photographs of five consecutive fills using the default pump setting at SB3. The SB pattern consists of an air bubble and a liquid plug (depicted in Figure 2). The top of the air bubble (highlighted by a red line) represents the height of the SB level, which was manually measured using a ruler. It is apparent that these five fills have different liquid and air bubble heights.
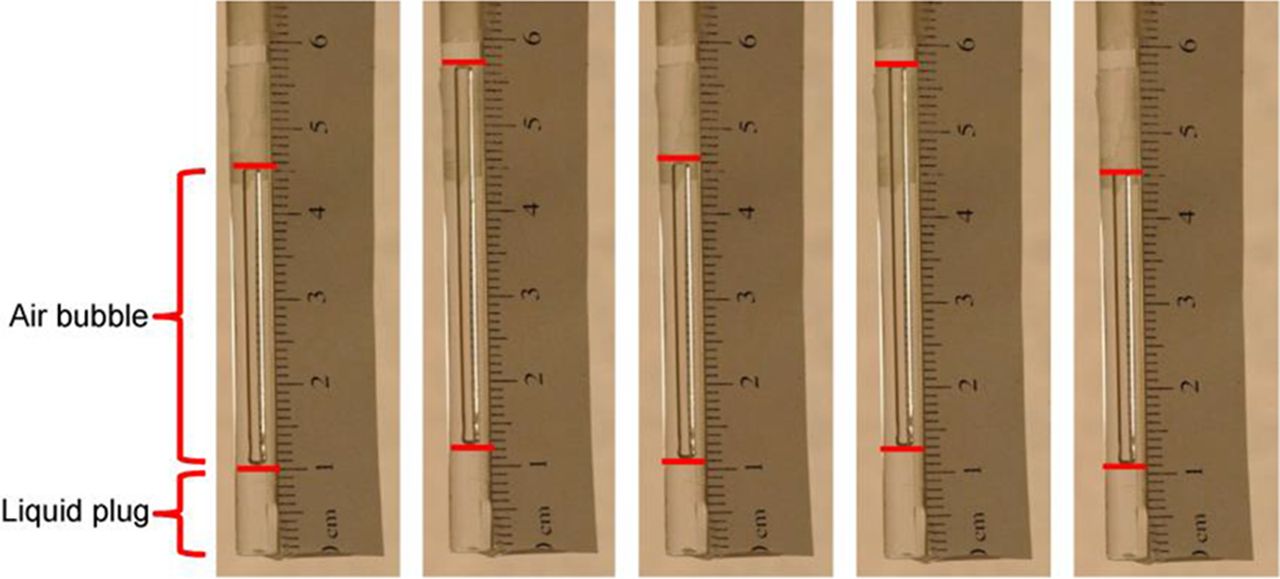
Photographs demonstrating liquid level variations for filling 48% sucrose solution using a 1.5 mm glass nozzle with default pump setting and SB3.
A more detailed photograph analysis was performed on the first two photos of Figure 2, as illustrated in Figure 3a, in order to determine if the observed inconsistencies in the liquid height could be the main cause for fill weight variability. In theory, the air bubble does not contribute to fill weight while the liquid plug does. The height of the air bubble and the liquid plug was measured from a photograph before fill (Figure 3a, Photo A) and after fill (Figure 3a, Photo B). Thus,
 where hA(air bubble) and hA(liquid plug) are the heights of the air bubble and the liquid plug, respectively, in Photo A; hB(air bubble) and hB(liquid plug) are the heights of the air bubble and the liquid plug, respectively, in Photo B; and Δv represents the calculated fill volume increase (positive Δv) or decrease (negative Δv).

(a) Photograph analysis for calculating fill volume variation associated with liquid SB height variation; (b) comparison of measured (actual) fill weight versus calculated (model) fill weight based on photograph analysis of 20 data points.
Based on the calculation shown in Figure 3a, Δv is –0.0168 mL. The fill volume of the dispense prior to Photo A was calculated to be 0.3109 mL. Therefore, the predicted volume for the fill between A and B is 0.31095 – 0.0168 = 0.2941 mL. This fill volume is outside the ± 3% range (i.e., 0.3 ± 0.009 mL). This photo analysis was performed on 20 consecutive fills. Subsequent fill volumes were predicted by taking the previously predicted fill volume and adding Δv. The predicted fill volume (or fill weight after density conversion) was compared with the actual measured fill volume. As shown in Figure 3b, fill volume calculated via photograph analysis (blue diamond) could effectively predict the actual fill volume (red square), further demonstrating that SB level variations from fill to fill appear to be the main factor affecting fill weight precision.
After it was determined that there was a strong correlation between SB height variations and fill weight variability, two potential root causes for SB height variations were investigated: (1) liquid flow and breakup behavior at the fill nozzle tip and (2) changes in pressure drop at the end of fill when the pump rollers stop or reverse.
Impact of Liquid Stream Breakup
One possible root cause of SB height variation is inconsistent liquid stream breakup (or separation) at the end of each fill. In principle, the liquid stream should separate at, or near, the nozzle tip when the roller stops rotating. However, a combination of factors, including liquid properties, liquid interactions with the nozzle tip material, and the pump's SB action, may affect the liquid stream breakup point.
I. Liquid Properties:
Liquid properties, such as surface tension, density, and viscosity, may affect how a liquid jet breaks up. The impact of viscosity has been studied in detail based on physical principles (11). Generally, a thin stream of liquid can break up into many discrete small droplets or into a large drop. The case of forming a large drop simulates a “clean” breakup. A viscoelastic liquid stream can form an elongated filament before breaking up. Thus, it may be more challenging to fill liquids of high viscosity with high precision.
II. Liquid/Nozzle Interactions:
The interaction of the liquid with the nozzle tip material and its effect on liquid stream breakup was visually assessed by comparing hydrophobic (silicone and Teflon®) and hydrophilic (glass and stainless steel) filling nozzles (10). The impact of hydrophilic and hydrophobic nozzles on liquid stream patterns at the nozzle tip was observed in Figure 4a. Overall, nozzle material (hydrophilicity versus hydrophobicity) and nozzle wall thickness (thick-walled versus thin-walled) affected the pattern of the liquid stream at the tip of the nozzle. When the mAb A formulation was filled from a 2.0 mm ID thick-walled (1.5 mm wall thickness) hydrophilic glass nozzle, the liquid stream expanded at the nozzle tip. This behavior might result from the liquid's tendency to spread over the hydrophilic surface, and the thick-walled nozzle provided additional surface for such spreading. When using nozzles constructed of hydrophobic material, that is, the 3.2 mm ID thick-walled (1.6 mm wall thickness) silicone nozzle and the 1.6 mm ID thin-walled (0.75 mm wall thickness) Teflon nozzle, the mAb A formulation established a thin, uniform liquid stream due to its tendency to stay away from the hydrophobic surface. For the 2.0 mm ID thin-walled (0.35 mm wall thickness) hydrophilic stainless steel and glass nozzles, a uniform liquid stream was also established during filling, likely because the thin-wall configurations provide less hydrophilic surface (compared with the thick-walled glass counterpart) over which the liquid could spread.
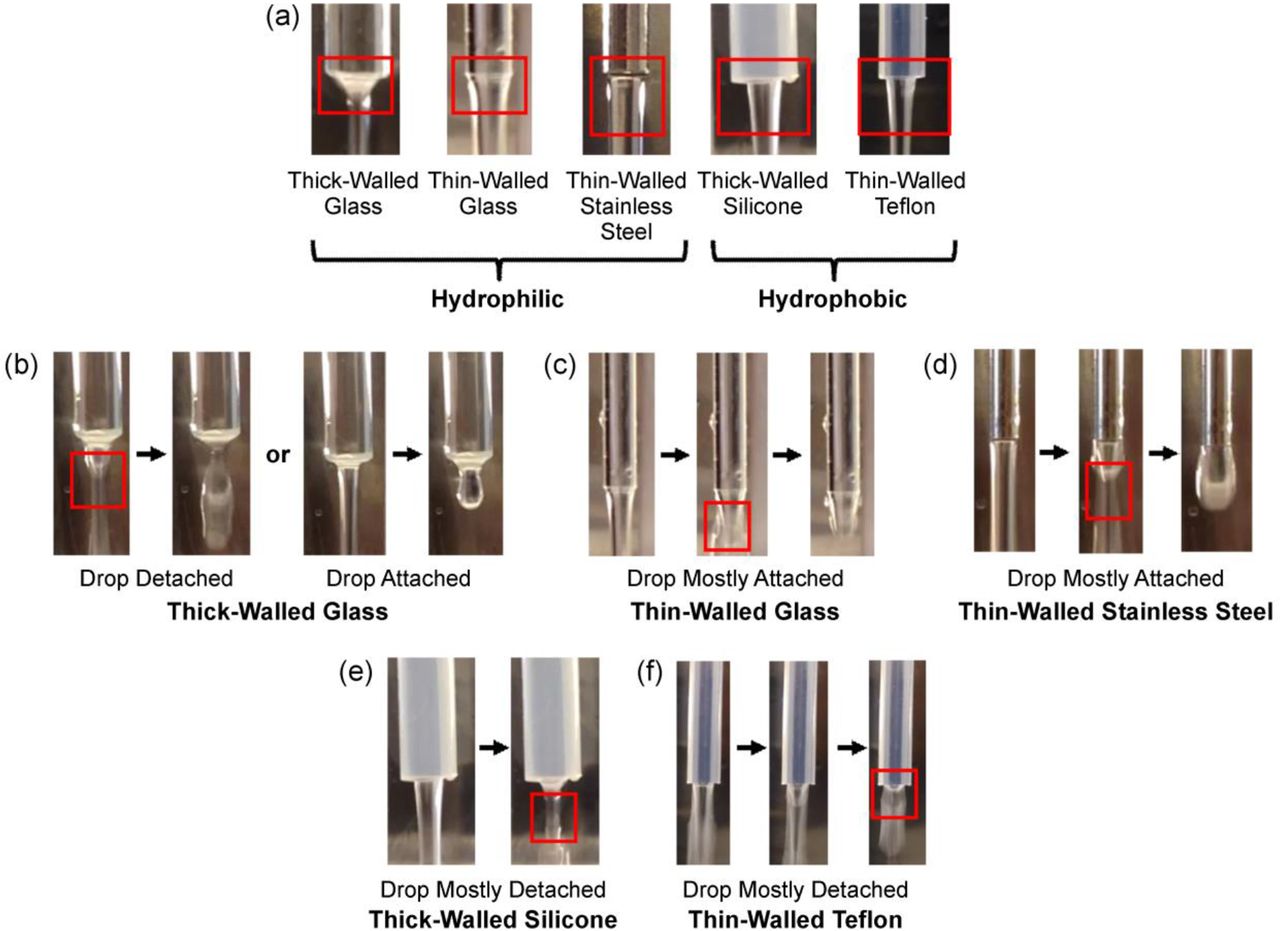
(a) Impact of the liquid stream/nozzle material interaction on liquid stream breakup point of mAb A formulation: 2.0 mm thick-walled glass nozzle, 2.0 mm thin-walled glass nozzle, 2.0 mm thin-walled stainless steel nozzle, 3.2 mm thick-walled silicone nozzle, and 1.6 mm thin-walled Teflon nozzle; (b) photographs highlighting potential breakup position of the 48% sucrose solution stream and drop formation on a thick-walled glass nozzle; (c) photographs highlighting potential breakup position of the 48% sucrose solution stream and drop formation on a thin-walled glass nozzle; (d) photographs highlighting potential breakup position of the 48% sucrose solution stream and drop formation on a thin-walled stainless steel nozzle; (e) photographs highlighting potential breakup position of the 48% sucrose solution stream and drop formation on a thick-walled silicone nozzle; (f) photographs highlighting potential breakup position of the 48% sucrose solution stream and drop formation on a thin-walled Teflon nozzle.
The liquid stream breakup patterns at the end of fill dispenses from each nozzle were also monitored. For the hydrophilic nozzles, the liquid breakup point typically occurred below and away from the nozzle tip. For the 2.0 mm ID thick-walled (1.5 mm wall thickness) glass nozzle (Figure 4b), this low breakup point would leave a liquid drop at the nozzle tip that could either drip (detach) from the nozzle tip (left of Figure 4b) or stay (attach) to the nozzle tip (right of Figure 4b). In the case of the 2.0 mm ID thin-walled (0.35 mm wall thickness) glass (Figure 4c) and stainless steel (Figure 4d) nozzles, a liquid drop did form at the end of fill, but it consistently remained attached to the nozzle tip. In contrast, when the same liquid was filled from the hydrophobic nozzles, the liquid stream typically broke up at a point much closer to the nozzle tip. This behavior likely resulted in minimal liquid droplet formation at the tip of these nozzles (see photographs in Figure 4e and Figure 4f).
To better understand the impact of these liquid/nozzle interactions on fill weight precision, three nozzles—2.0 mm ID thick-walled glass (worst-case), 2.0 mm ID thin-walled glass, and 1.6 mm ID thin-walled Teflon nozzle (best-case)—were used to fill the 48% sucrose solution with the default pump setting (velocity at 600 rpm and acceleration at 125) without SB (SB0). The fill weight data presented in Table III show that the thin-walled Teflon nozzle performed the best (>95% of data points within 3% precision). Wall thickness also played a role; the thin-walled glass nozzle outperformed the thick-walled glass nozzle with 89% versus 53% of the fill weight points within 3% precision, respectively. The precision data appeared to correlate with the consistency of the final drop staying attached at or detaching from the tip of the nozzle.
Impact of Liquid (48% Sucrose Solution) and Nozzle Interactions on Fill Weight Precision Using Three Nozzles
Impact of Pressure Variations
In addition to liquid breakup position, another factor that could potentially affect fill weight precision is the pressure variations arising from the pumping action when the rollers stop (without SB) or reverse (with SB). As mentioned earlier, SB was identified as a critical parameter for fill precision (Figure 1), where filling without SB (SB0) displayed substantially better precision (>90% of data points were within 3% precision for water fills and 48% sucrose solution/mAb formulation fills) compared with fills with SB action (SB3 and SB4). The tight run-to-run/day-to-day variability suggests that these data are statistically significant and the SB action causes fill weight variations. Pressure changes that occur during SB were observed via photo analysis (Figure 5). Figure 5a shows seven photographs taken in time sequence from a 2.0 mm ID thin-walled glass nozzle during filling the 48% sucrose solution using the default pump setting with SB3. The liquid level in Figure 5a, Photo 5, which represented the moment that SB action was about to end, was higher than the liquid level in Photos 6 and 7. This suggests that the tubing might expand briefly and then relax during SB. The same behavior was observed in Figure 5b from identical filling parameters using a 3.2 mm ID silicone nozzle (liquid level in Figure 5b, Photo 6, is higher than that in Photo 7). To address the tubing issue, two separate experiments were performed, one using Flexicon Accusil tubing in the pump and another replacing the flexible silicone tubing (between the pump and the nozzle) with inflexible Teflon tubing. Accusil tubing was used in this experiment because of claims that it provides an excellent dispensing accuracy of ± 1% for fill volumes between 0.2 mL and 1 mL for Flexicon pumps. Our overall data for both sets of experiments suggest that there was no statistically significant improvement to fill weight precision. Run-to-run and day-to-day variations were still observed (data not shown), indicating that the source of pressure variations cannot be isolated to the tubing used within the system.
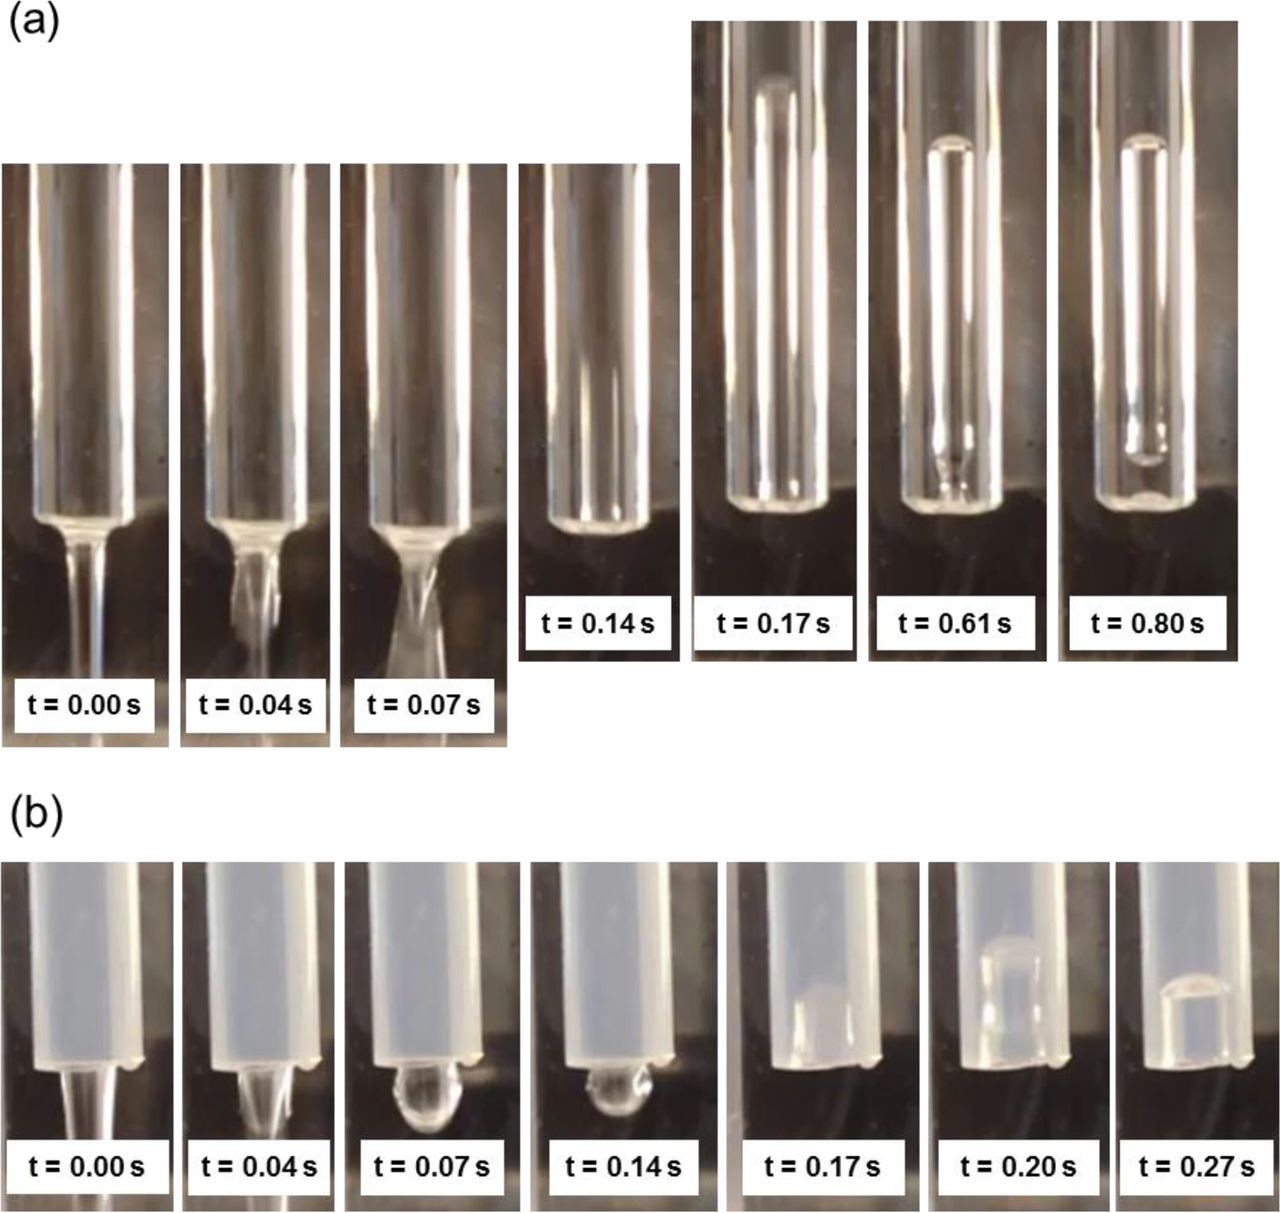
(a) A sequence of photographs from a 2.0 mm thick-walled glass nozzle during filling a 48% sucrose solution to demonstrate pressure variation–induced liquid level changes during SB (with default pump setting and SB3); (b) a sequence of photographs from a 2.0 mm thick-walled Teflon nozzle during filling a 48% sucrose solution to demonstrate pressure variation–induced liquid level changes during SB (with default pump setting and SB3).
Custom Nozzle Design with Pressure Barrier
A custom nozzle was assembled and tested with the aim of mitigating liquid stream breakup and pressure drop at the nozzle tip. This nozzle (Figure 6) was assembled using a piece of 3.2 mm ID silicone tubing to connect a 2.0 mm ID glass nozzle and a 1.6 mm ID Teflon nozzle. A piece of sponge could be placed inside the silicone tubing between the glass nozzle and the Teflon nozzle. In addition, the Teflon nozzle tip could be coated with a super-hydrophobic material (NeverWet, Rust-oleum Industrial Brand, Vernon Hills, IL). The silicone tubing connection and/or the addition of sponge were intended to serve as a buffer zone to modulate/reduce pressure associated with rapid liquid's reverse flow action. The purpose of using the Teflon tip or the super-hydrophobic coating was to better control the liquid stream breakup position.

Photograph of a custom nozzle assembled using a piece of 3.2 mm silicone tubing connecting a 2.0 mm glass nozzle and a 1.6 mm Teflon nozzle. A piece of sponge was placed in the silicone tubing between the glass nozzle and the Teflon nozzle.
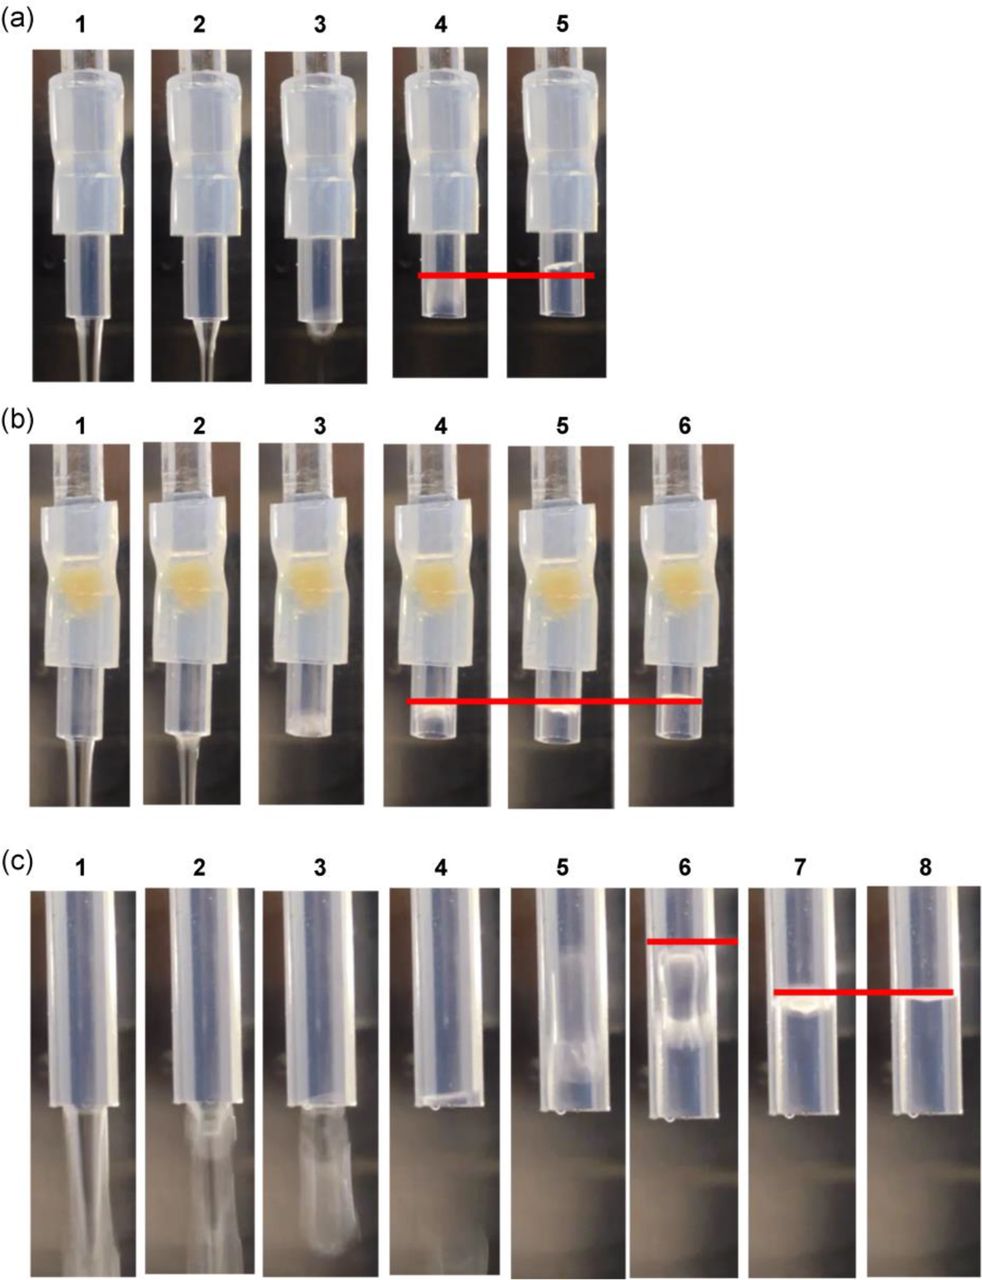
The custom nozzle assembly with and without sponge was evaluated on filling the 48% sucrose solution or the mAb A formulation under the default pump setting with SB3. Photographs depicting the time sequence of filling are presented in Figure 7. Both the nozzle assembly without the sponge (Figure 7a) and the assembly with the sponge (Figure 7b) displayed a constant liquid level (highlighted by the red line) upon SB while the Teflon nozzle (Figure 7c) shows a “rise-and-fall” pattern upon SB (similar to Figure 5). This observation suggested that this custom nozzle assembly may have indeed reduced pressure variation during SB action. The impact of these three nozzle types on the liquid SB height was determined based on SB height measurement. Each nozzle dispensed the 48% sucrose solution five times, and their SB heights are summarized in Table IV. The liquid SB height from lowest to highest was as follows: (1) the custom nozzle assembly with sponge (3.9 ± 0.3 cm), (2) the custom nozzle assembly without sponge (4.8 ± 0.3 cm), and (3) the standard Teflon nozzle (6.8 ± 1.5 cm). This observation might correlate with the level of pressure reduction at the nozzle tip. In addition, the variation (or standard deviation) of the liquid SB height using the custom nozzle assembly with and without the sponge is significantly less than that using the standard Teflon nozzle, suggesting that pressure reduction/variation at the nozzle tip might play a critical role in fill weight precision/consistency.

(a) A sequence of photographs from the custom nozzle assembly (no sponge) during filling a 48% sucrose solution to demonstrate no liquid level change during SB (with default pump setting and SB3); (b) a sequence of photographs from the custom nozzle assembly (with sponge) during filling a 48% sucrose solution to demonstrate no liquid level change during SB (with default pump setting and SB3); (c) a sequence of photographs from a 1.6 mm ID Teflon nozzle during filling a 48% sucrose solution to demonstrate liquid level change during SB (with default pump setting and SB3).
Impact of Nozzle Design on 48% Sucrose Solution Suck-Back Height
To demonstrate the performance of this custom nozzle assembly (with and without the sponge), these two nozzle types were tested on fill weight precision to compare with that of the 1.6 mm ID Teflon nozzle and 1.5 mm ID glass nozzle. All fill weight data (3% precision) are summarized in the box plot shown in Figure 8a for filling the 48% sucrose solution or the mAb A formulation. Data sets included 12 fill runs (across four days with SB0, SB3, and SB4) for each of the four nozzles. The plot suggests that the custom nozzle assembly (with or without sponge) outperformed the Teflon and glass nozzles in both precision and consistency. As shown in Figure 8b, the nozzle assembly with the sponge performed the best, with 89 ± 14% of all fill weight data points within 3% precision. The nozzle assembly without the sponge performed slightly worse than the counterpart nozzle with the sponge, with 80 ± 14% of all data points being within 3% precision. The performances of the Teflon nozzle and the glass nozzle are comparable (58 ± 38% versus 60 ± 32%, respectively, of data points within 3% precision) but significantly worse than the performances of both custom nozzle assemblies The same trend was observed in percentage of data points within 2% and 1% precision.
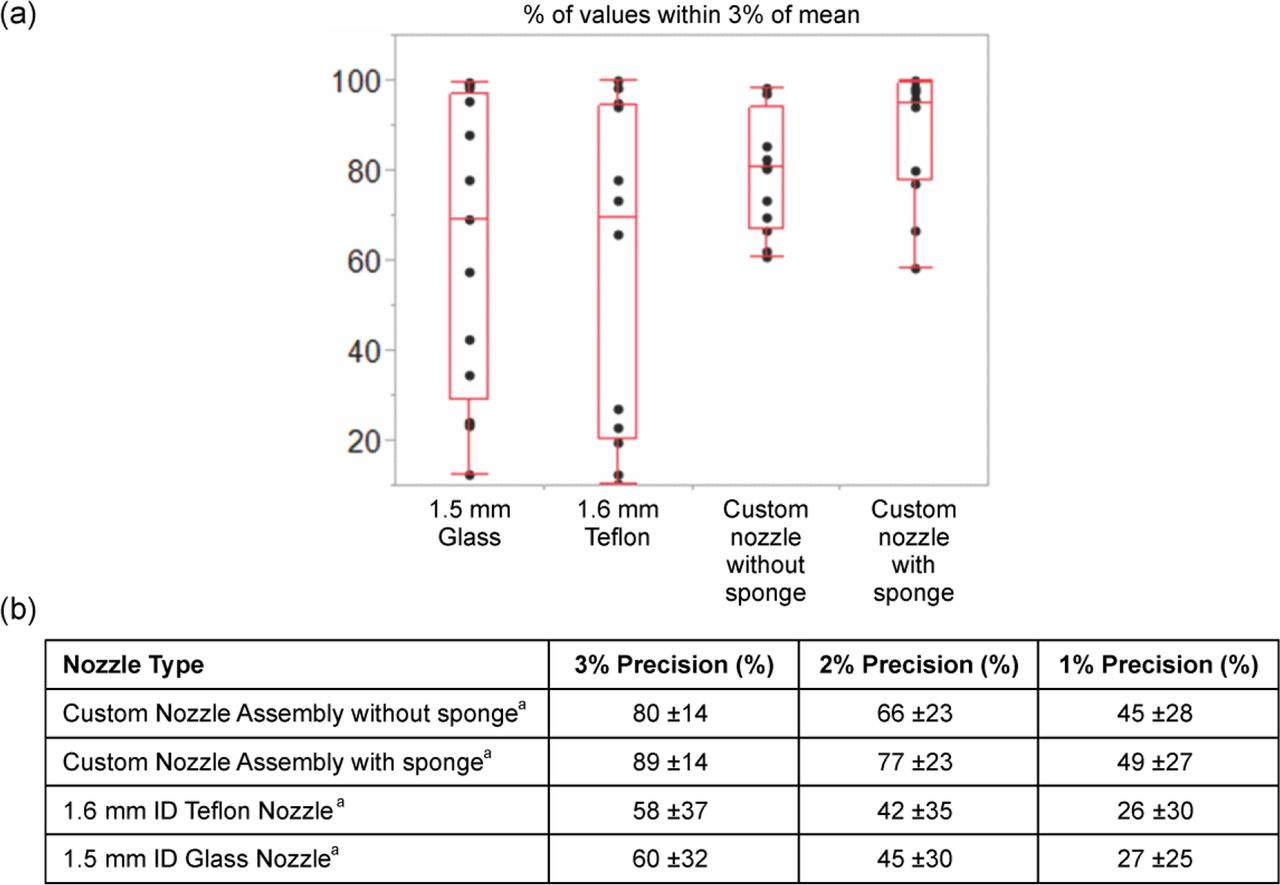
JMP® box plot comparing fill weight precision (3% precision) for filling 48% sucrose solution or mAb A formulation. Data sets (12 runs across 4 days with SB0, SB3, and SB4) using four different nozzles: the custom nozzle assembly with and without the sponge, a 1.5 mm glass nozzle, and a 1.6 mm Teflon nozzle.
As discussed earlier, SB action is a critical parameter that demonstrated deteriorated fill weight precision as opposed to filling without SB. The impact of SB was again assessed using the custom nozzle assembly (with and without the sponge) to compare with the standard glass nozzle and Teflon nozzle (Table V). There is no clear difference in fill weight precision between fills without SB (SB0) and with SB (SB3 or SB4) using the custom nozzle assembly, whereas in the case of the Teflon nozzle and the glass nozzles, good fill weight precision could be achieved only without SB (SB0). These results confirmed that pressure variations at, or near, the nozzle tip are the main root cause for fill weight variations. Although the custom nozzles utilized in this study are prototypes and not for use in manufacturing, this design concept that enables liquid pressure reduction could be an effective solution to fill weight variability when filling small volumes.
Impact of Nozzle Design on Fill Weight Precision for Filling with and without Suck-Back Control
Conclusion
This study set a very stringent fill weight precision requirement to enable the identification of the root causes of fill weight variations associated with filling small volumes of viscous solutions (i.e., high-concentration mAb formulations) using a PP. The primary source of fill weight variations originated from liquid level variations at the end of the fill due to the quick SB action at the nozzle tip. Custom nozzle assemblies capable of reducing liquid pressure could effectively and consistently improve fill weight precision. Identifying the root cause and the underlying mechanism for controlling the precision of low-volume fill of high viscosity mAb formulations has provided the foundation for scientists and engineers to design improved nozzles for sterile filling processes in pharmaceutical product manufacturing.
Conflict of Interest Declaration
The authors declare that they have no competing interests.
- © PDA, Inc. 2016


