
Abstract
Certain types of glass vials used as primary containers for liquid formulations of biopharmaceutical drug products have been observed with delamination that produced small glass like flakes termed lamellae under certain conditions during storage. The cause of this delamination is in part related to the glass surface defects, which renders the vials susceptible to flaking, and lamellae are formed during the high-temperature melting and annealing used for vial fabrication and shaping. The current European Pharmacopoeia method to assess glass vial quality utilizes acid titration of vial extract pools to determine hydrolytic resistance or alkalinity. Four alternative techniques with improved throughput, convenience, and/or comprehension were examined by subjecting seven lots of vials to analysis by all techniques. The first three new techniques of conductivity, flame photometry, and inductively coupled plasma mass spectrometry measured the same sample pools as acid titration. All three showed good correlation with alkalinity: conductivity (R2 = 0.9951), flame photometry sodium (R2 = 0.9895), and several elements by inductively coupled plasma mass spectrometry [(sodium (R2 = 0.9869), boron (R2 = 0.9796), silicon (R2 = 0.9426), total (R2 = 0.9639)]. The fourth technique processed the vials under conditions that promote delamination, termed accelerated lamellae formation, and then inspected those vials visually for lamellae. The visual inspection results without the lot with different processing condition correlated well with alkalinity (R2 = 0.9474). Due to vial processing differences affecting alkalinity measurements and delamination propensity differently, the ratio of silicon and sodium measurements from inductively coupled plasma mass spectrometry was the most informative technique to assess overall vial quality and vial propensity for lamellae formation. The other techniques of conductivity, flame photometry, and accelerated lamellae formation condition may still be suitable for routine screening of vial lots produced under consistent processes.
LAY ABSTRACT: Recently, delamination that produced small glass like flakes termed lamellae has been observed in glass vials that are commonly used as primary containers for pharmaceutical drug products under certain conditions during storage. The main cause of these lamellae was the quality of the glass itself related to the manufacturing process. Current European Pharmacopoeia method to assess glass vial quality utilizes acid titration of vial extract pools to determine hydrolytic resistance or alkalinity. As alternative to the European Pharmacopoeia method, four other techniques were assessed. Three new techniques of conductivity, flame photometry, and inductively coupled plasma mass spectrometry measured the vial extract pool as acid titration to quantify quality, and they demonstrated good correlation with original alkalinity. The fourth technique processed the vials under conditions that promote delamination, termed accelerated lamellae formation, and the vials were then inspected visually for lamellae. The accelerated lamellae formation technique also showed good correlation with alkalinity. Of the new four techniques, inductively coupled plasma mass spectrometry was the most informative technique to assess overall vial quality even with differences in processing between vial lots. Other three techniques were still suitable for routine screening of vial lots produced under consistent processes.
- Glass
- Vials
- Lamellae
- Delamination
- Alkalinity
- Conductivity
- ICP-MS
- Flame photometry
- Accelerated lamellae formation
Introduction
Type 1 borosilicate glass vials are used as primary containers for liquid-formulated biopharmaceutical drugs (1) and are generally considered chemically inert. Recently, observations of flake-like glass particles (termed lamellae) delaminating from the inner surface of the glass vials have resulted in an industry-wide recall of over a dozen drug products (2). Exposure of Type 1 glass to neutral to alkaline solutions over time can cause this type of delamination to occur (1⇓⇓⇓⇓–6). The propensity of glass vials to delaminate has been proposed to be derived from the heating (approximately 1200 °C) and cooling cycles deployed during the conversion of glass tubes into vials (7) combined with subsequent washing and depyrogenation steps prior to use (8).
The process of lamellae formation is dependent on the nature of glass itself combined with how that glass is formed into vials and then treated. Type 1 borosilicate glass is mainly composed of oxides of silicon (Si), boron (B), aluminum (Al), and sodium (Na) (8). Silicon oxide is the main component that is arranged into a mainly tetrahedral network of silicon with four bridging oxygen atoms, and the other oxides are interspersed throughout the network. During the vial-forming process at high temperatures (>1000 °C), some of the alkaline oxides vaporize, re-deposit onto the cooler surfaces, and become solvent, accessible on the vial inner surface (7). During the heating and cooling, phase separation may also occur resulting in alkali-rich regions of the glass surface (7). The resulting surface heterogeneity can disrupt the silicon oxide tetrahedral network causing surface texture defects that can be observed using differential interference contrast microscopy (10), scanning electron microscopy, x-ray photo spectroscopy, atomic force microscopy, or analyzed using time of flight secondary ion mass spectrometry (4, 5). Buildup of these inner surface texture defects likely lead to the increased propensity for delamination of those vials.
Currently, the industrial standard for determining glass vial quality is the European Pharmacopoeia (Ph. Eur.) glass vial surface hydrolytic resistance method (11) or alkalinity. First, a requisite number (depending on vial size) of glass vials are extracted with water at 121 °C to dissolve any soluble alkaline salts on the surface of the vials. The vial extracts are then pooled together and measured for hydroxide concentration using acid titration, which results in an alkalinity value. Higher concentration of hydroxide in the water extract (higher alkalinity) corresponds to poorer glass quality, which may indicate higher delamination risk when the vials are actually used for drug products. The Ph. Eur. method requires pooling of the extracts from multiple vials (n > 25 for 3 cc vials) in order to obtain suitable measurements, as the actual quantity of hydroxide per vial is low. This pooling does not allow for discriminating vial-to-vial glass quality within a lot. A variation of the Ph. Eur. method using different extraction solvents under accelerated conditions was studied and also showed to be good in determining vial surface corrosion, which can be used as acceptance criteria for vials to be used to fill drug product (12).
In this paper, four alternative techniques to determine the glass vial quality were compared to the current Ph. Eur. method. Three techniques—conductivity, flame photometry, and inductively coupled plasma mass spectrometry (ICP-MS)—were assessed as alternatives to acid titration for analysis after vial water extraction. These three techniques directly measure ions or elements that are extracted from the glass vial surfaces, which should increase with increased surface texture defects or lower glass quality. Conductivity indiscriminately measures all ionic content within a solution, including glass composing ions like sodium, aluminum, boron, and others at low parts-per-billion (ppb) concentrations. Flame photometry can measure elements like sodium and potassium individually in aqueous solutions at concentrations as low as 50 ppb. ICP-MS can measure an even wider range of elements individually within a solution at parts-per-trillion concentrations and give a far detailed elemental profile within the extracted solution. All three techniques are sensitive and require only small solution volumes (∼3 mL) for testing, which allows for screening variability in vial-to-vial glass quality.
A fourth technique to compare with the Ph. Eur. method is visual inspection of vials subjected to the accelerated lamellae formation (ALF) technique (9). Pre-cleaned vials are extracted with base solution under harsher conditions, and then that solution is studied visually for particles including lamellae, instead of a chemical analysis to determine glass quality. Effectiveness of the four techniques were determined by comparing the alkalinity values determined by the Ph. Eur. method of multiple lots of Type 1A glass vials with the results of conductivity, flame photometry, and ICP-MS analyses on same vial extracts and with visual inspection of same vials treated with the ALF method. Good correlation of the analytical results of the new four techniques to Ph. Eur. alkalinity would suggest that these alternative techniques could also serve to screen vials for glass quality and hence delamination propensity.
Materials and Methods
Sample Preparation
Seven total lots of commercially available, 3 cc Type 1A glass vials of a known wide range of alkalinity levels were obtained from two suppliers, A and B. The glass vials were tested for glass quality by five different techniques.
For the acid titration, conductivity, flame photometry, and ICP-MS methods, three sets of 60 vials per lot were extracted with Millipore MilliQ water (Billerica, MA, USA) by autoclave for 1 h at 121 °C according to the Ph. Eur. method (12). Vial extracts per set were pooled together, and the aliquots from each pool analyzed by the four techniques.
For visual inspection after ALF, 140 vials per lot were each filled with 0.200 mL MilliQ water and placed in a Lindberg Blue M oven from Thermo Scientific (Asheville, NC, USA) for 90 min that was preheated to 250 °C. The vials were then removed from the oven, equilibrated to room temperature, filled with 1.0 mL of 20 mM glycine solution (pH 10.0), capped, and placed in a 50 °C incubator for 24 h. The vials were equilibrated to room temperature and then visually inspected individually using an APK unit.
Technique 1: Acid Titration
The alkalinity of each vial lot was determined by acid titration. As the acid titration indicator, 0.25 mg/mL aqueous solution of methyl red disodium salt from Alfa Aesar (Ward Hill, MA, USA) was prepared. Two drops of the indicator solution was added to each 50 mL centrifuge tube containing 25 mL of the pooled water extract. A Mettler Toledo T50 autotitrator (Columbus, OH, USA) equipped with a photo electrode was used to determine the titration endpoint. Alkalinity values for 25 mL pool of 2∼5 mL glass vials are expressed as a percentage of 0.01 N HCl used for titration in comparison to limit volume of 5.2 mL. Precision (relative standard deviation, RSD) of multiple titration measurements of each sample pool was determined to be <1% (n = 3).
Technique 2: Conductivity
The total level of extracted ions from each vial lot was determined by conductivity in units of microSiemens (μS/cm). The 12 mm diameter conductivity probe from VWR International (WVR, Radnor, PA, USA) was conditioned overnight by placement in a conditioning solution from VWR. The SP70C conductivity meter from VWR was calibrated using a single 100 μS/cm conductivity standard from VWR prior to sample analysis. Conductivity measurements were performed on 2.7 mL aliquots of the pooled water extracts in 16 mL polystyrene tubes from VWR. Between measurements, the probe was rinsed by placing the probe in a 400 mL beaker filled with ≥150 mL of Milli-Q water. A conductivity standard (100 μS/cm) was measured prior, during, and at the end of the sample sequence for accuracy. Each standard measurement was within ±5% of the expected conductivity value (100 μS/cm).
Technique 3: Flame Photometry
The sodium level extracted from each vial lot was determined by flame photometry in units of ppb. A Sherwood model 2655-10 flame photometer from Cole-Parmer (Vernon Hills, IL, USA) capable of selectively measuring sodium in the presence of Li, Mg, and K was used. Sodium standard from Cole-Parmer was used to run a standard curve between 0.05 and 10 ppm with R2 of 0.9998. Spiked recoveries of sodium in vial extracts were between 88% and 111% with RSD of ≤12% (n = 5). Ionization buffer was not used for this analysis.
Technique 4: ICP-MS
The profile of glass composing elements extracted from each vial lot was determined by ICP-MS in units of parts-per-billion (ppb) per element. A NexION 300D ICP-MS equipped with an autosampler (PerkinElmer, Waltham, MA, USA) was used to measure elemental silicon (28 m/z), sodium (23 m/z), boron (11 m/z), and aluminum (27 m/z) in pool samples. Standard curve samples of each element were prepared with 10 ppb cadmium as internal standard and with 0.5% nitric acid (Sigma, St. Louis, MO, USA). The lower limit of quantification for each element was determined to be 1, 1, 5, and 25 ppb for Al, Na, B, and Si, respectively. The vial extracts were diluted 20- or 40-fold to a working volume of 2 mL and spiked to contain 10 ppb elemental cadmium. Spiked recoveries of each element in the vial extracts were between 99% and 110%.
Technique 5: Visual Inspection of Vials Subjected to ALF
The presence of glass particles or lamellae after ALF treatment of each vial lot was determined by visual inspection. Vials were inspected visually using an APK unit (Eisai Machinery Co. Ltd., Tokyo, Japan). The unit pulse spun the vial prior to observation for approximately 1 s, and the vials were visually inspected for any particles including lamellae against a black background while illuminating the solution within the vial from below the base. Glass lamellae, due to their unique morphology and thinness, reflect light and sparkle as they rotate. The results of the inspection were expressed as the percentage of tested vials that contained lamellae per lot.
Results and Discussion
Correlating Alkalinity (Acid Titration), Conductivity, Flame Photometry, ICP-MS, and Visual Inspection after ALF
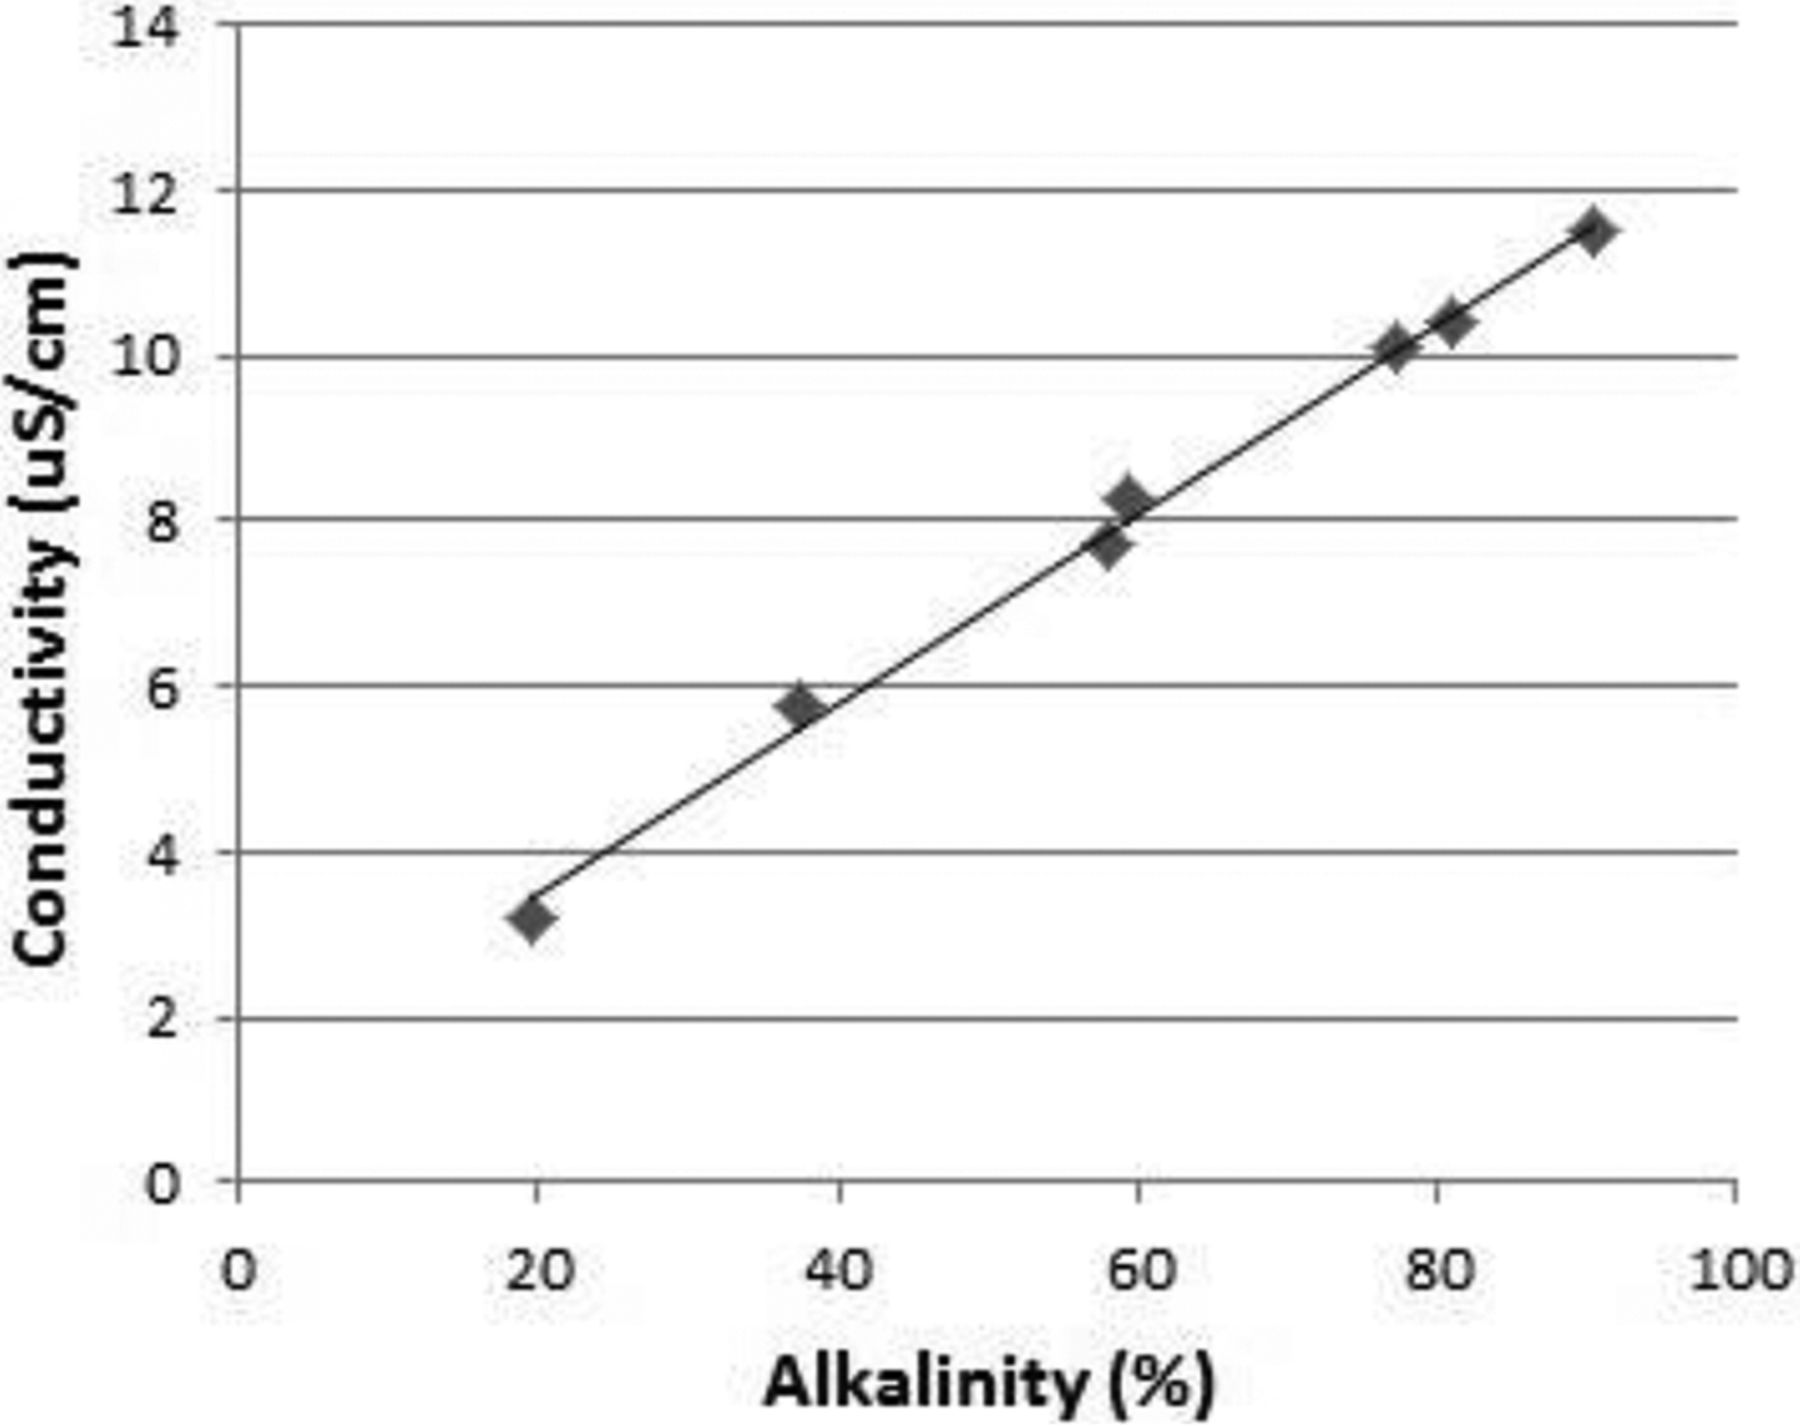
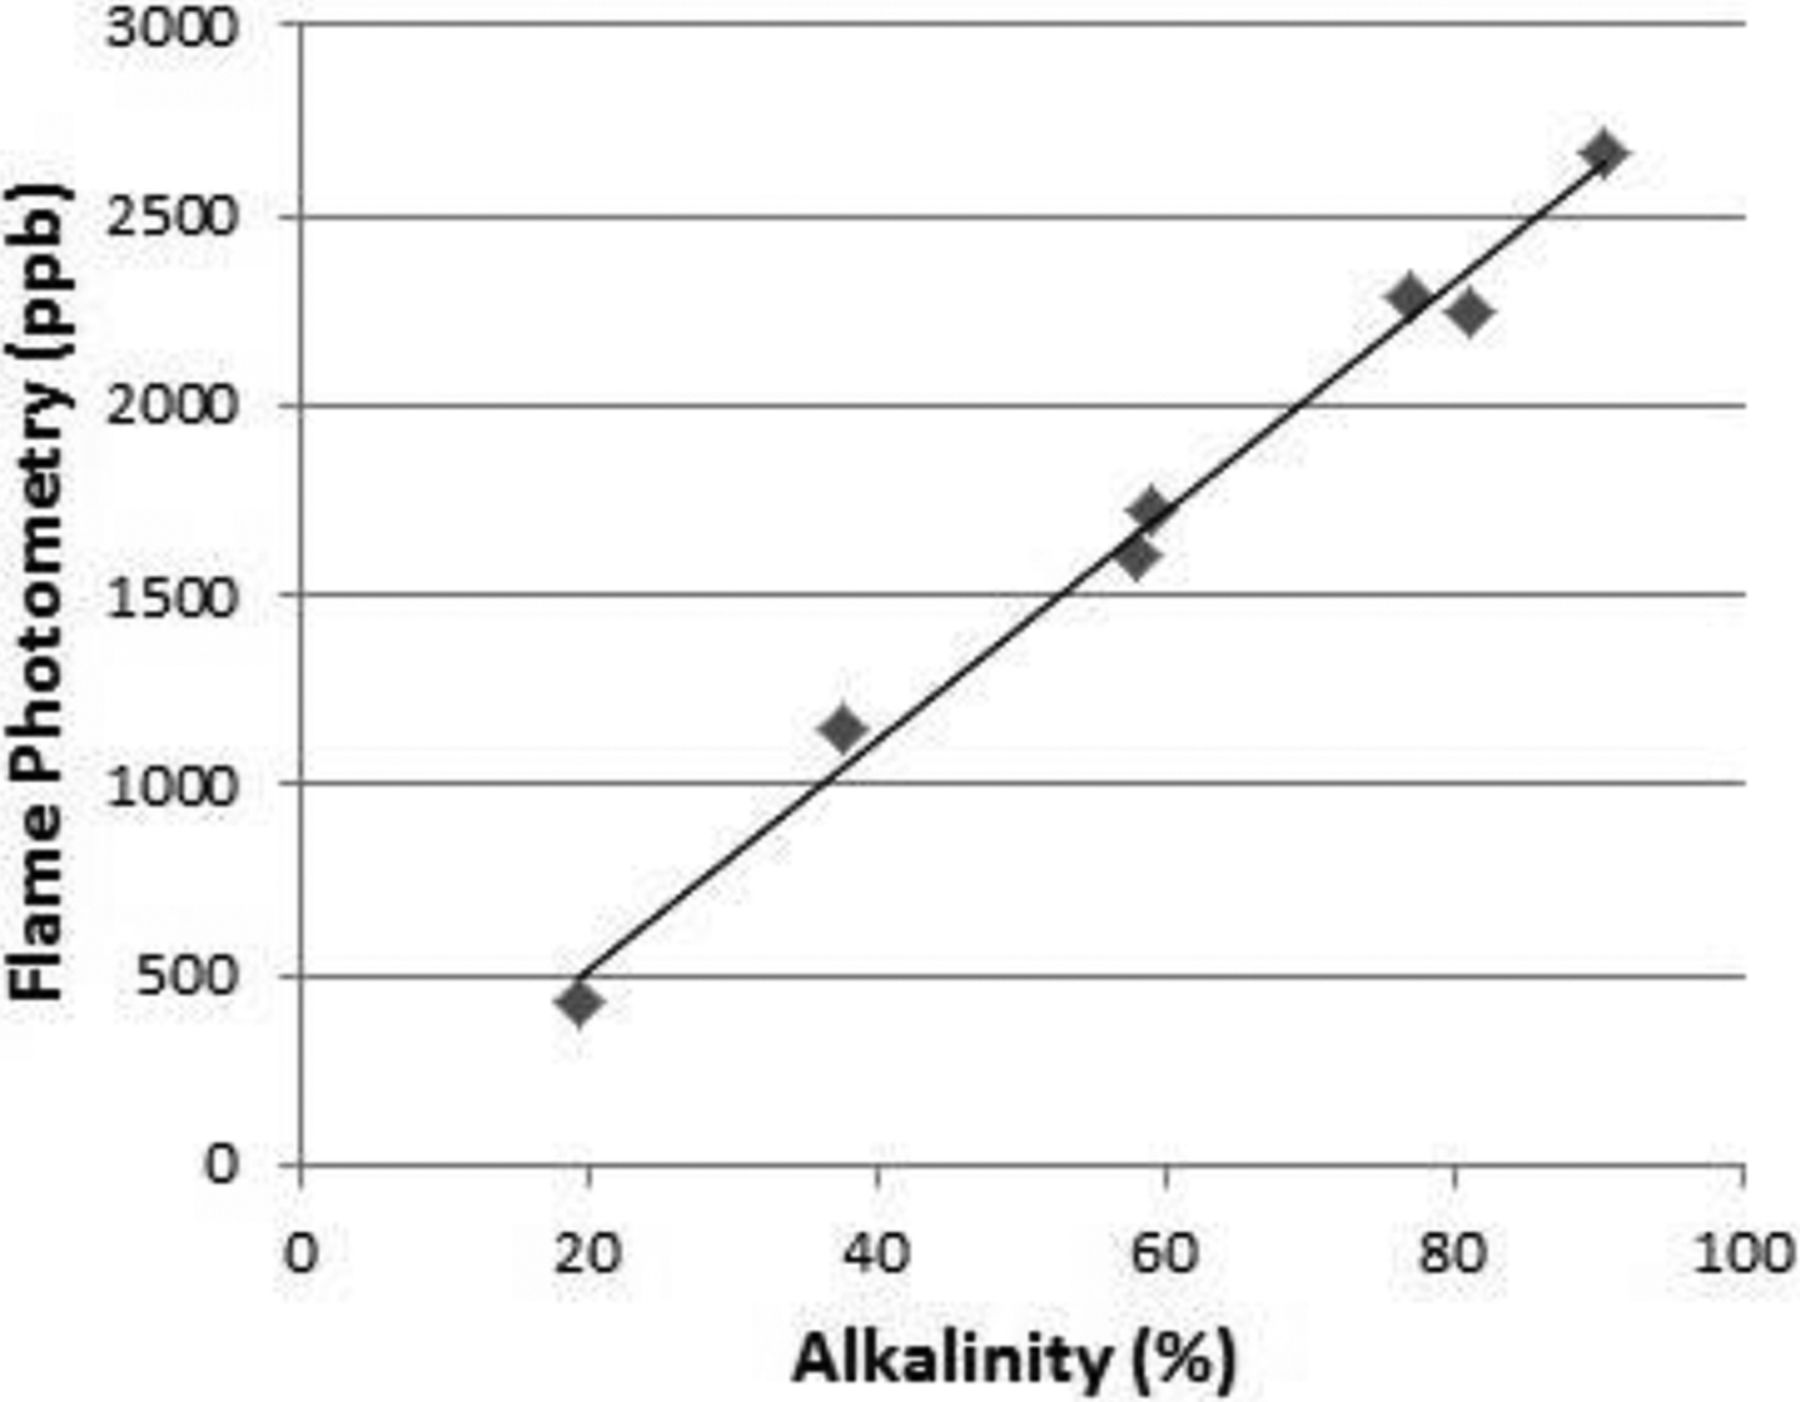
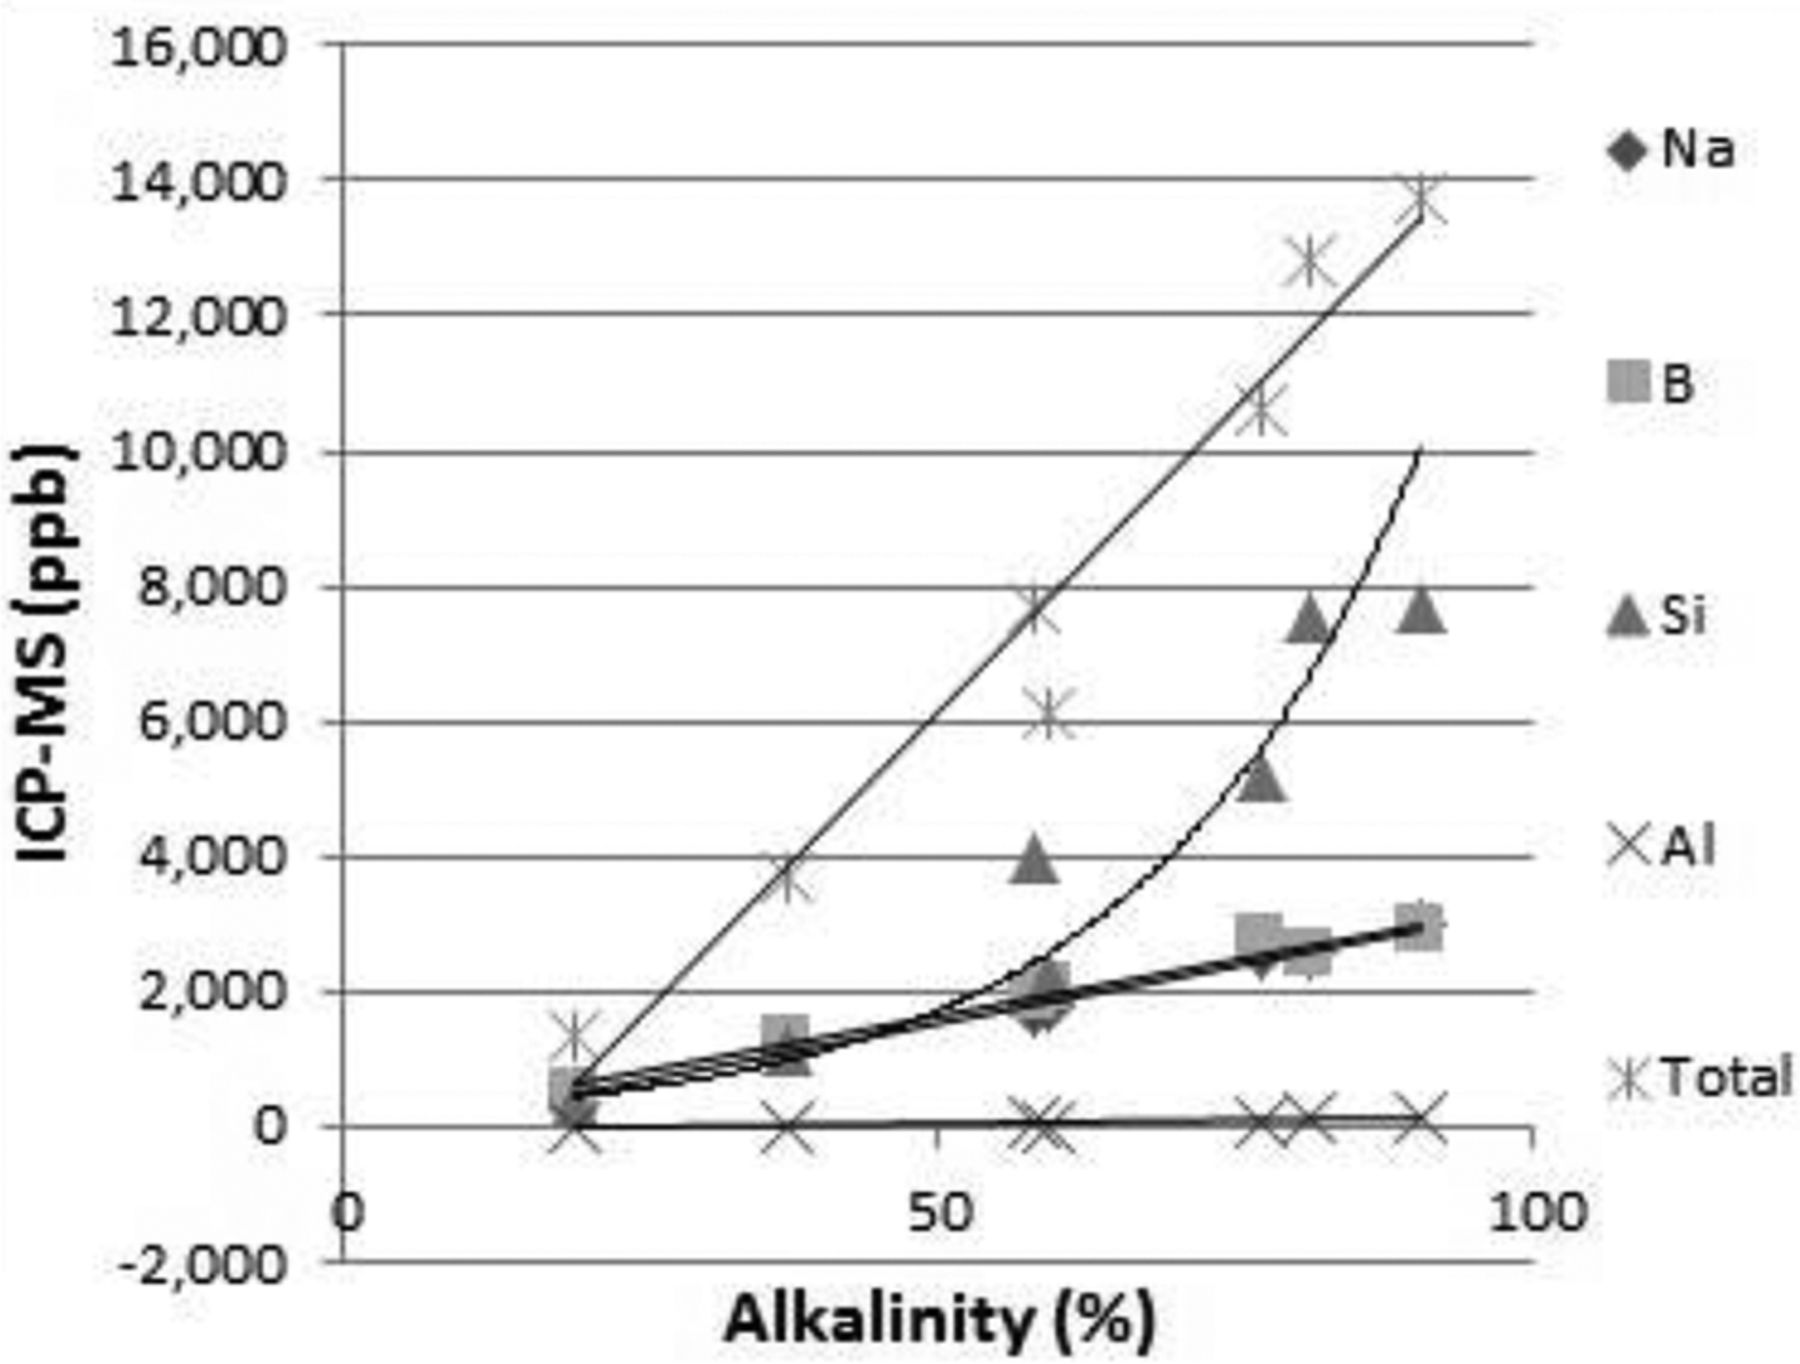
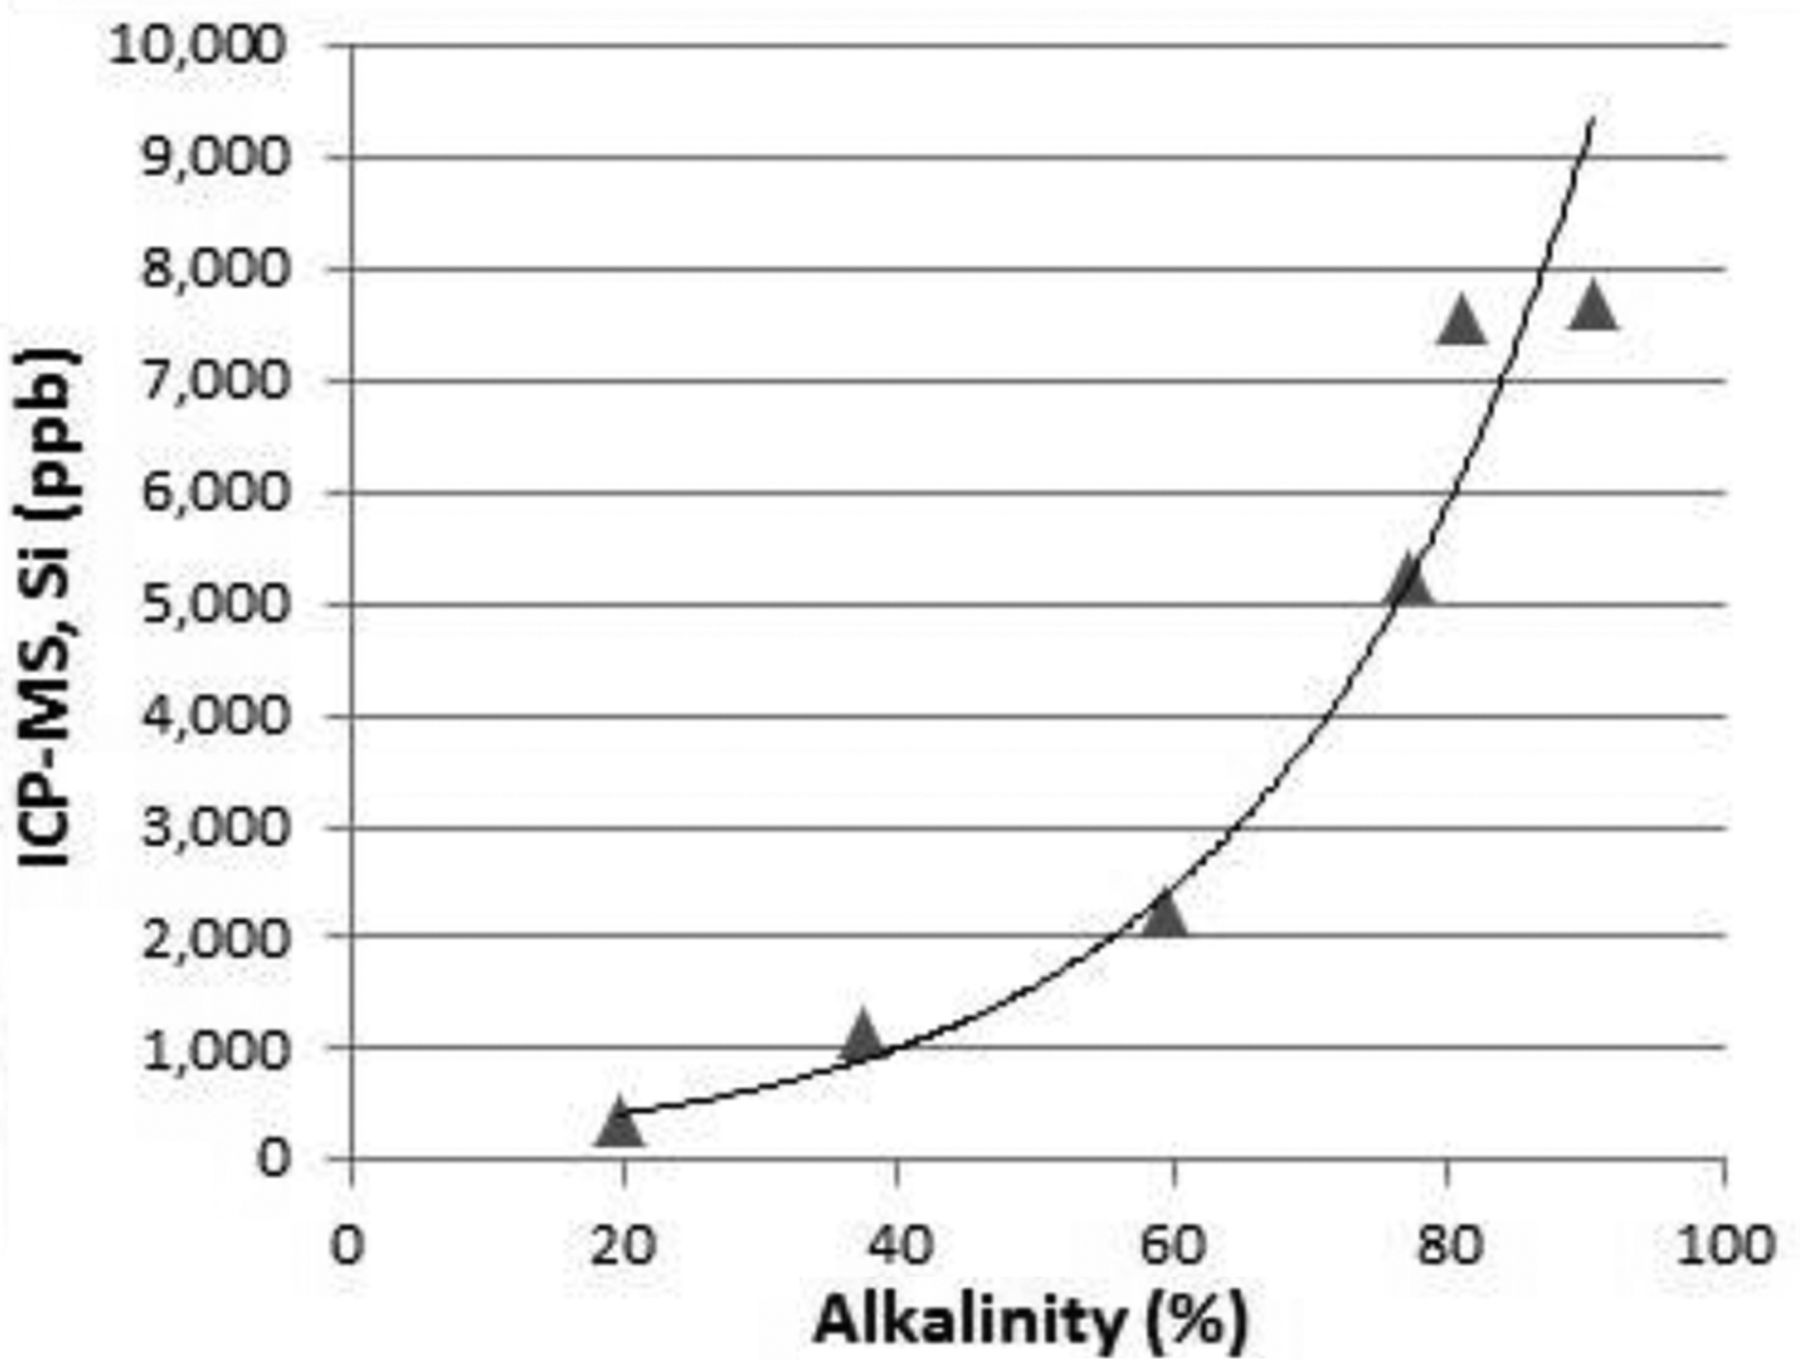
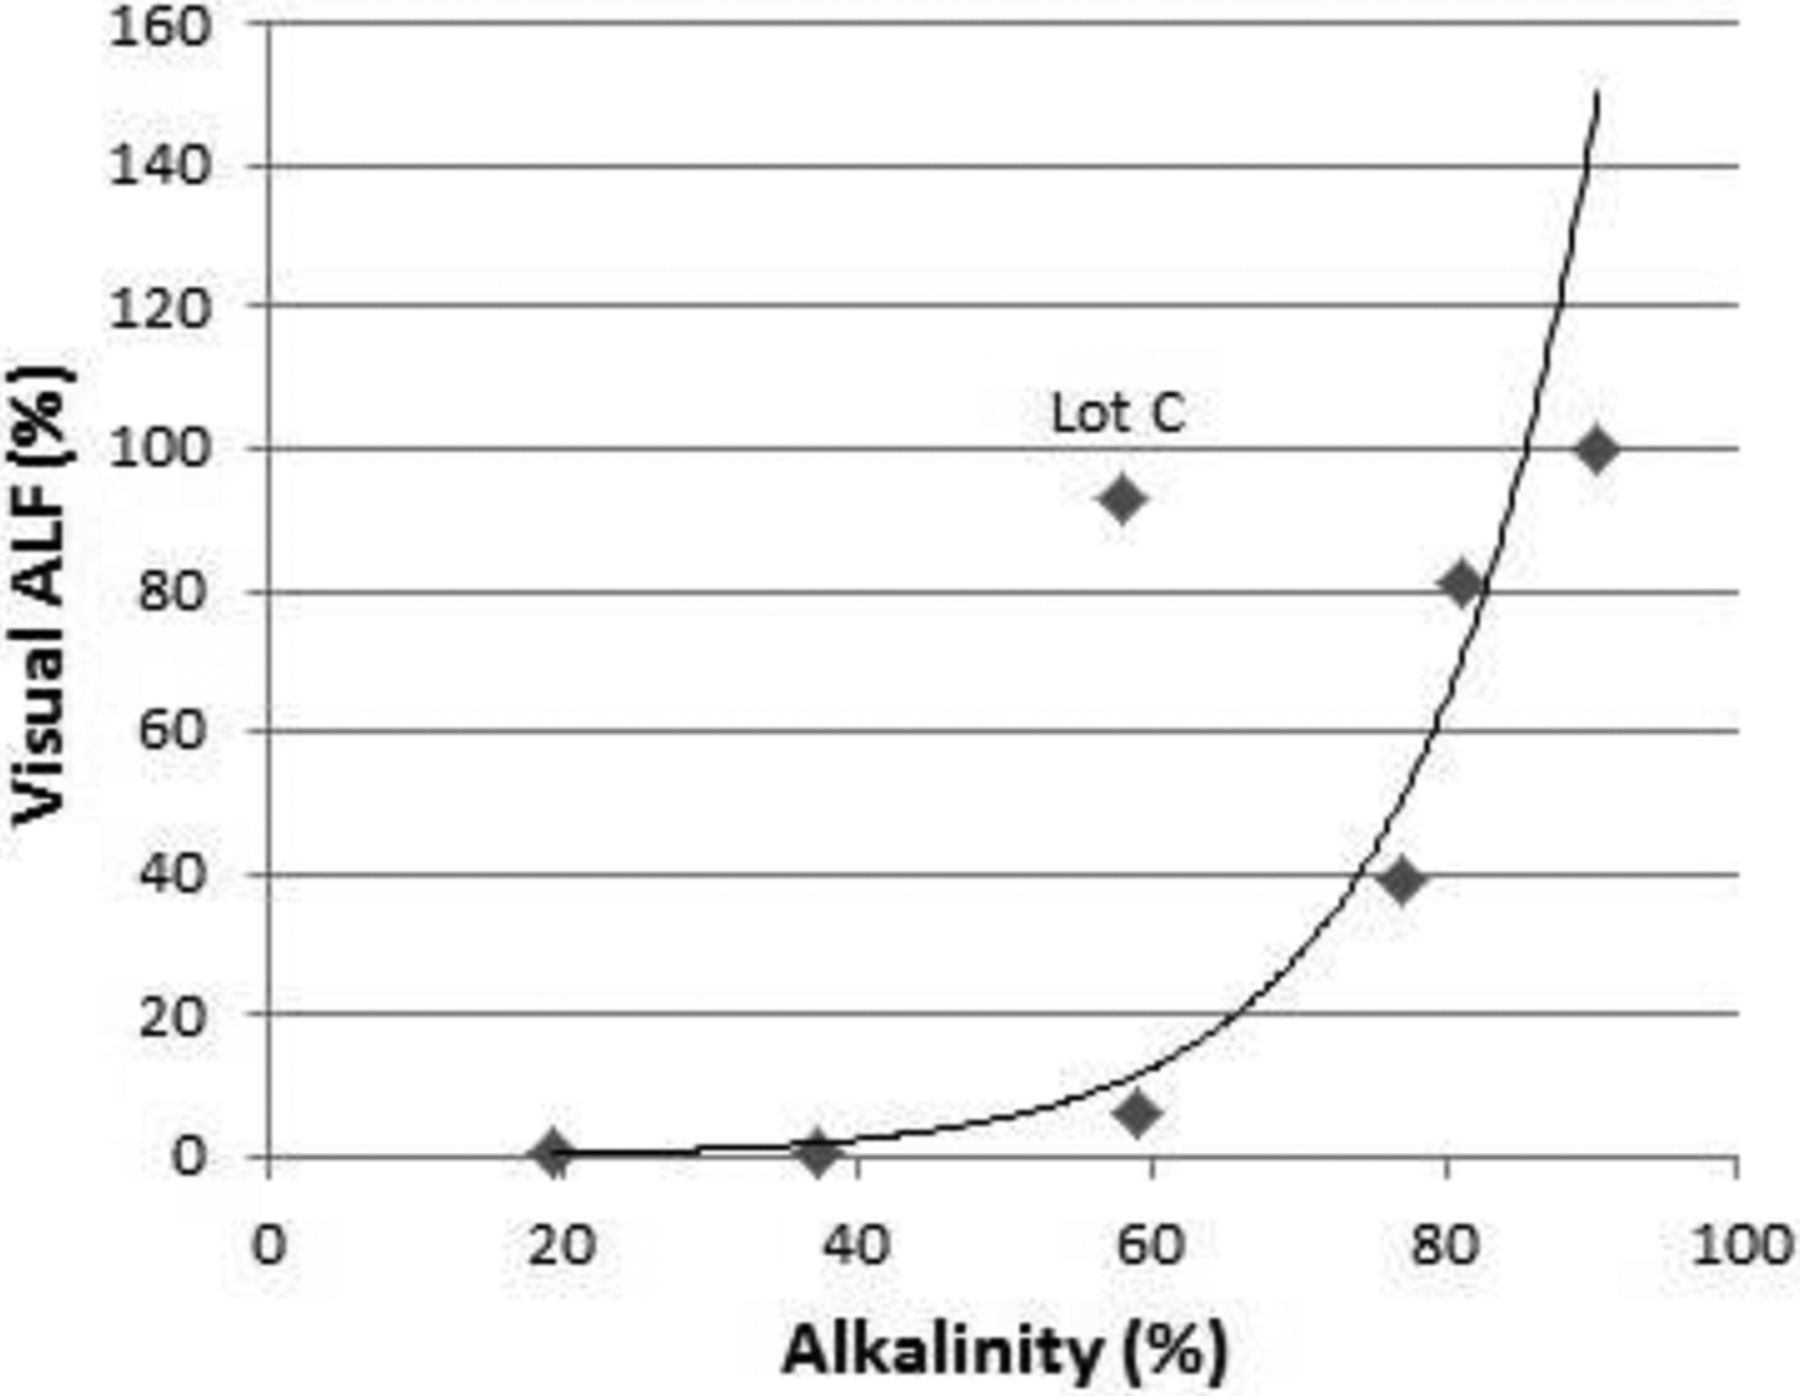
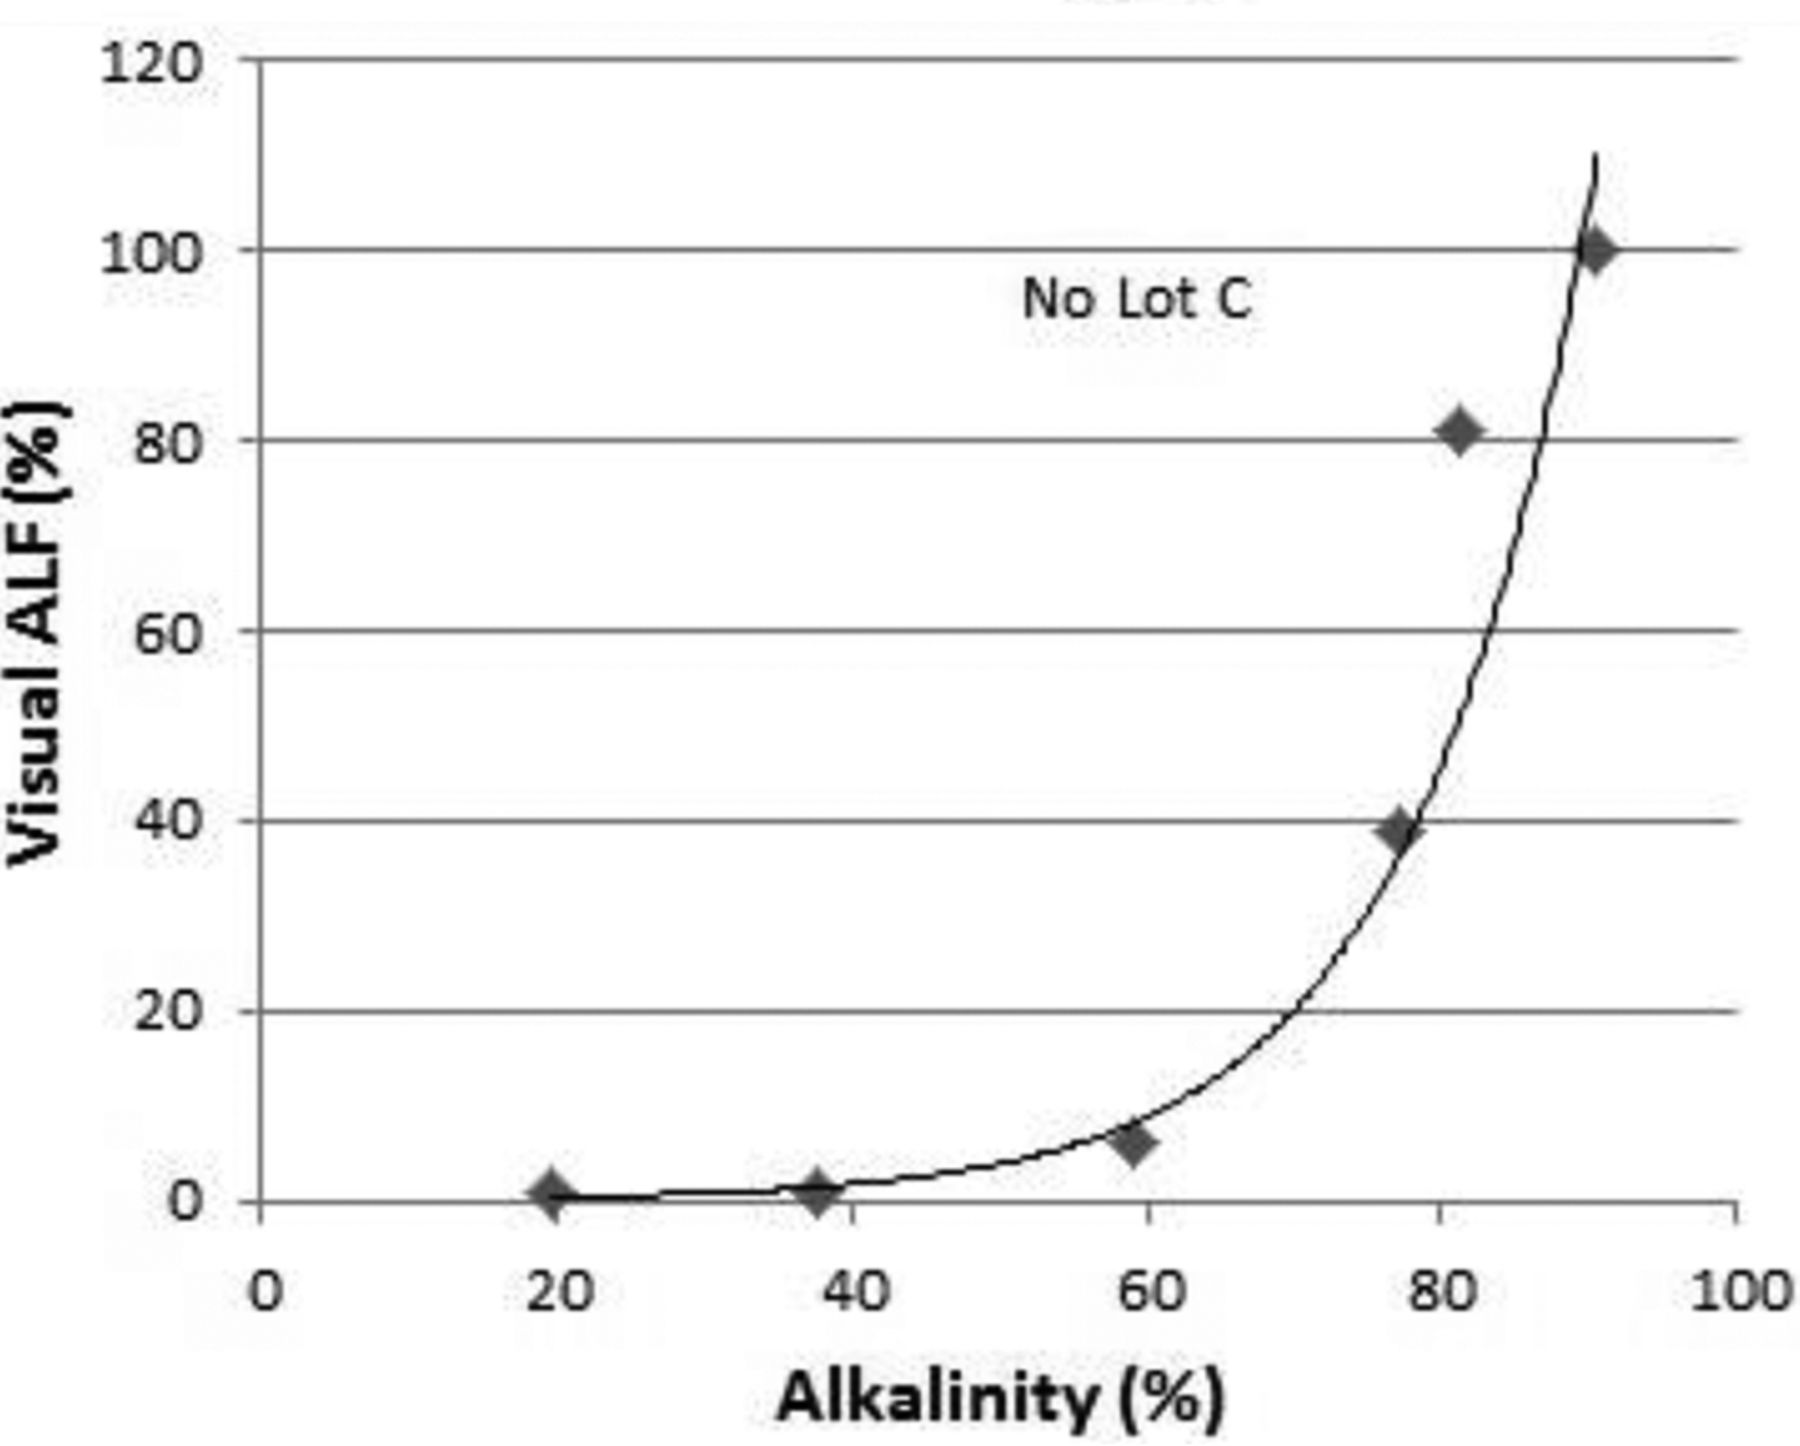
Alkalinity measurements of pools of water extract from seven vial lots were between 19.5% and 90.5% (Table I). The conductivity measurement of the same pools were between 3.20 and 11.50 μS/cm with linear correlation (R2 = 0.9951) with alkalinity (Figure 1). The flame photometry measurement of sodium of the same pools were between 430 and 2660 ppb with linear correlation (R2 = 0.9895) with alkalinity (Figure 2). For ICP-MS measurements, sodium (R2 = 0.9869), boron (R2 = 0.9796), and total (R2 = 0.9635) had linear correlation with alkalinity, while silicon had an exponential correlation (R2 = 0.9426) (Figure 3a). Silicon ICP-MS measurements results excluding the Lot C, which was found later to have different processing than the other lots, led to a higher exponential correlation with alkalinity (R2 = 0.9792) (Figure 3b). Aluminum ICP-MS measurements did not correlate well to alkalinity. The visual inspection of ALF treated vials had lamellae between 0.6 ∼ 100 % with exponential correlation (R2 = 0.7855) with alkalinity (Figure 4a). The visual inspection results without the Lot C results led to a higher exponential correlation with alkalinity (R2 = 0.9474) (Figure 4b).
Correlation of Alkalinity to Conductivity, Flame Photometry, ICP-MS, and Visual Inspection of ALF Measurements of Seven Vial Lots. (n = 60 × 3 per lot, except n = 140 for ALF)

Correlation between alkalinity and conductivity measurements of seven vial lots (n = 60 × 3 per lot). Regression line: y = 0.1148x + 1.2048, R2 = 0.9951.

Correlation between alkalinity and flame photometry sodium measurements of seven vial lots (n = 60 × 3 per lot). Regression line: y = 30.032x − 86.221, R2 = 0.9895.

Correlation between alkalinity and ICP-MS measurements of seven vial lots (n = 60 × 3 per lot). Regression line Na: y = 34.498x − 178.79, R2 = 0.9869; B: y = 33.719x – 25.574, R2 = 0.9796; Si: y = 194.85e0.0436x, R2 = 0.9426; Al: y = 1.8851x − 47.345, R2 = 0.7639; Total: y = 180.61x − 2899.6, R2 = 0.9639.

Correlation between alkalinity and ICP-MS silicon measurements of seven vial lots excluding Lot C (n = 60 × 3 per lot). Regression curve: y = 175.66e0.0439x, R2 = 0.9792.

Correlation between alkalinity measurement and visual inspection of ALF-treated vials of seven lots (n = 140 per lot). Regression curve: y = 0.0962e0.0813x, R2 = 0.7855.

Correlation between alkalinity measurement and visual inspection of ALF-treated vials of seven lots excluding Lot C (n = 140 per lot). Regression curve: y = 0.0612e0.0828x, R2 = 0.9474.
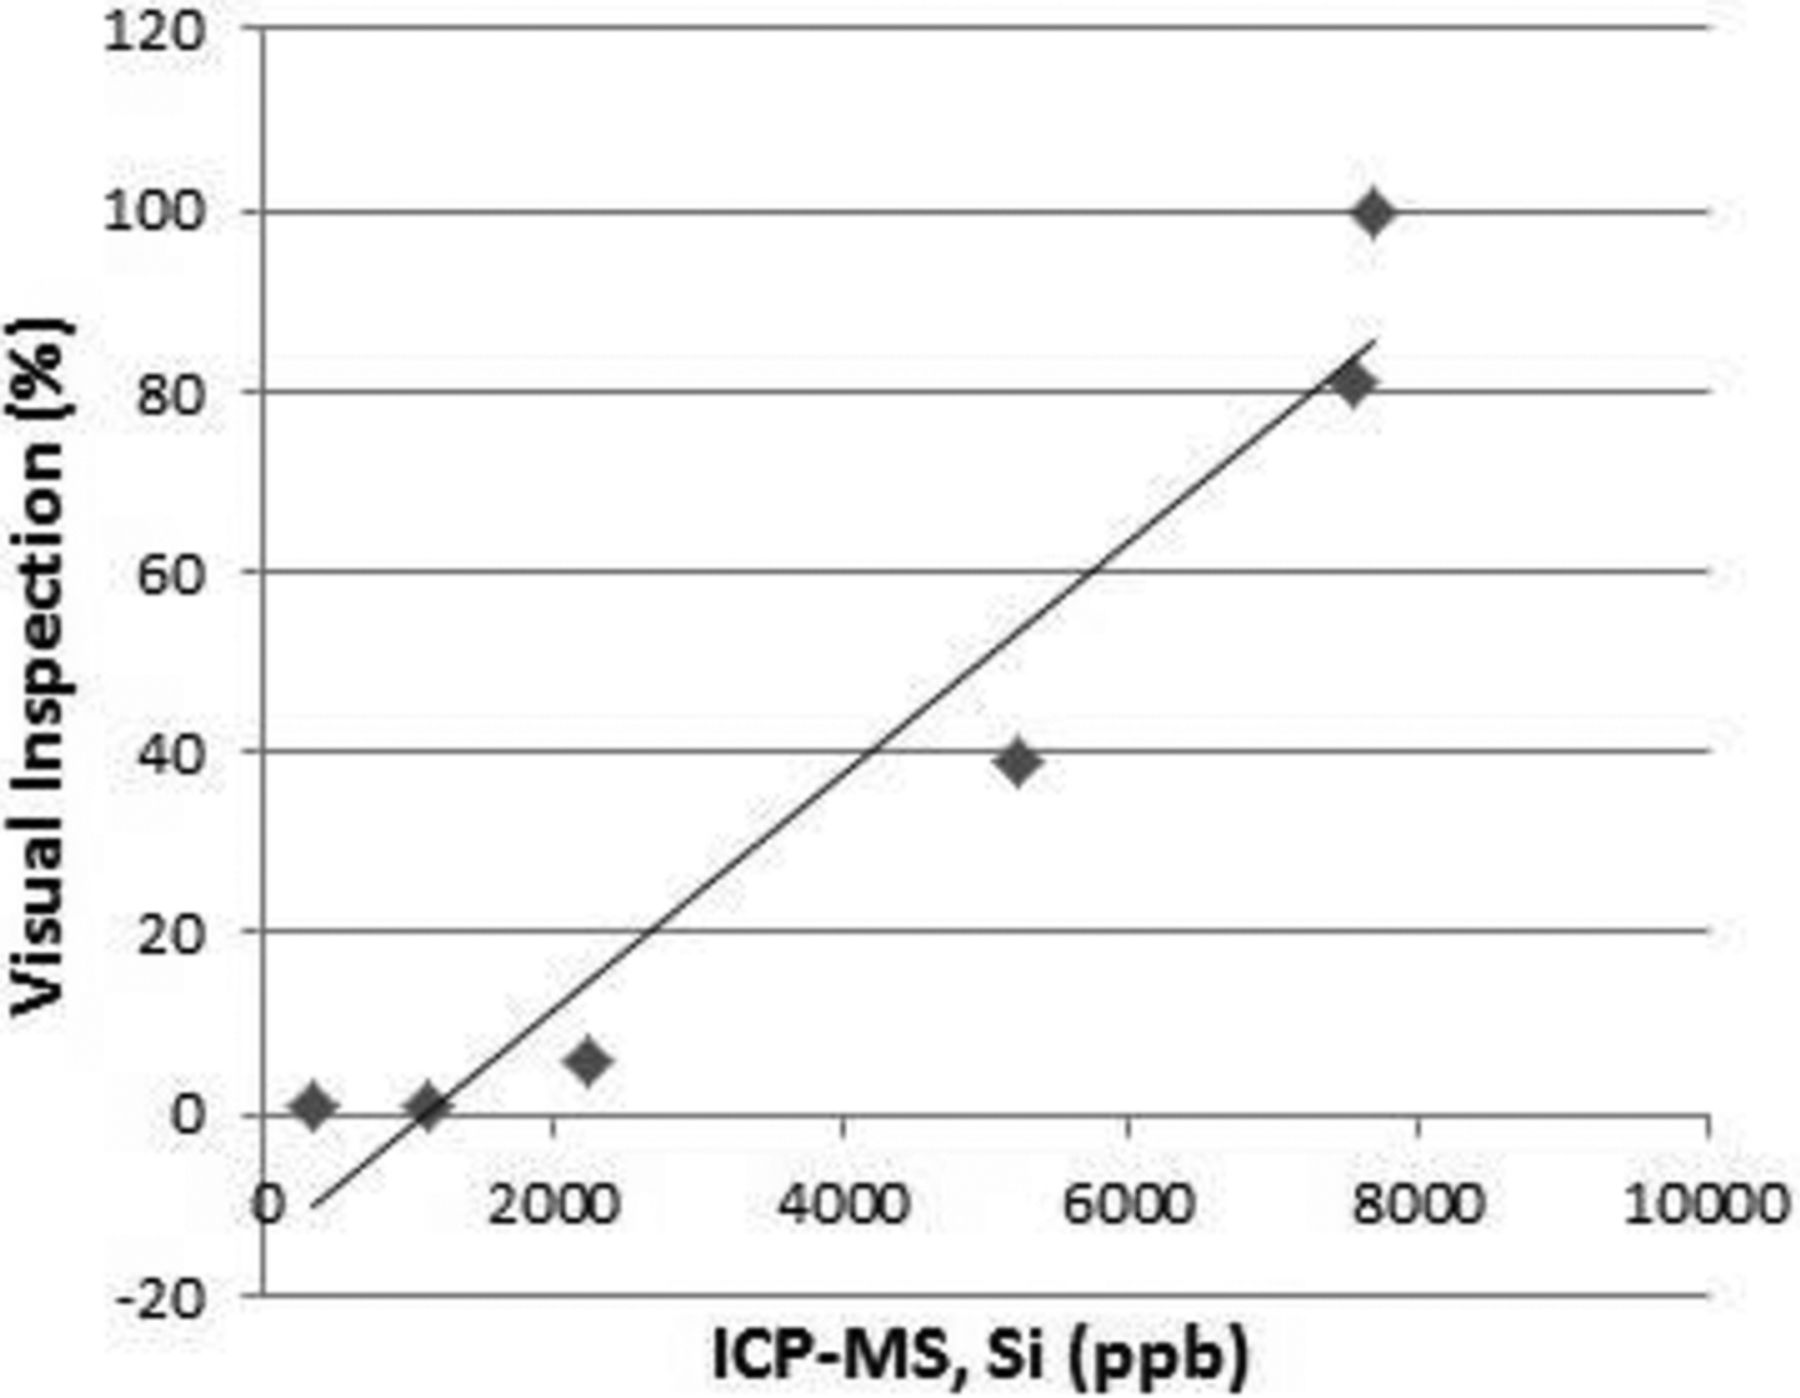
The measurements of extracted soluble ions/elements of conductivity, flame photometry, and ICP-MS correlated exponentially with the visual inspections of ALF treated vials. Vial lots with relatively high amount of solvent accessible ions are likely to have higher level of surface defects which increases delamination propensity as observed visually. Extraction solvent, heating temperature, storage time, and storage conditions may contribute to the non-linear correlation between the other four techniques with visual inspection after ALF. Only silicon ICP-MS measurements had a good linear correlation (R2=0.9350) with visual inspection excluding Lot C (Figure 5).

Correlation between silicon ICP-MS measurement and visual inspection of ALF-treated vials of seven lots excluding Lot C (n = 140 per lot). Regression line: y = 0.013x − 14.694, R2 = 0.9350.
Of the seven lots tested for this study, three lots were from supplier A and four lots from supplier B. The observed overall good correlation between the various techniques suggests that for the 3 cc Type 1A glass vials, the type of alkaline salts containing borosilicate glass tubes used and the manufacturing processes at both suppliers are similar.
Advantages and Disadvantages of Conductivity, Flame Photometry, ICP-MS, and Visual Inspection after ALF
In this study, measurements of conductivity, flame photometry, and ICP-MS were done on the same pooled samples as that of alkalinity. The actual sample size required for the three are within the individual vial volume of ≤2.5 mL. Visual inspection after ALF is also performed on individual vials. The vial-to-vial results has better discrimination of glass quality versus the lot-to-lot results of pooled samples and provide more in depth understanding of quality throughout a lot.
Regarding the ease of each measurement, conductivity is the simplest technique that still gives good results. Easy and fast training and actual measurements of conductivity technique allows for higher work efficiency. Other techniques require more time and skill to obtain enough proficiency for accurate and precise measurement, with ICP-MS with the highest requirements. In addition, conductivity is also easy on the budget, with low start-up and maintenance costs, while ICP-MS is again the highest in instrument cost.
Visual inspection of vials treated with ALF is a binary type testing of pass/fail that is qualitative and not quantitative. This will allow for simple determination of allowable or not allowable glass quality. However, this technique does not allow for precise quantification of the actual number of lamellae to assist in understanding the various factors of manufacturing that affects total lamellae or soluble ions. This technique is not suited for quantitative assessment of glass quality.
Effect of Vial Processing: Lot C
In comparison of various techniques to assess glass quality, results of Lot C did not exhibit a strong correlation for alkalinity versus silicon ICP-MS measurements and versus visual inspections after ALF with other six lots (Figures 3a and 4a). The cause of the outlier results was traced to an extra rinse step for this particular lot by the manufacturer. This difference did not have an impact in correlation except for these two comparisons. For example, Lots C and D have equivalent values in most measurements except in silicon ICP-MS (4.0 ppm for Lot C versus 2.2 ppm for Lot D) and visual inspection (93.3% for Lot C versus 6.1% for Lot D) (Table I). The correlation in alkalinity and the extracted salts like sodium and boron suggested the extra rinse did not significantly affect the solvent-accessible alkaline salts from the surface of the vials. The data suggests that the wash only affected extractable elemental silicon and delamination propensity.
Another possible effect of the extra wash is to the alkali borate–rich regions of the vial surface. Glass additives such as sodium borate are added to reduce the working melting temperature of glass, but they will also affect the glass structure itself. Alkali borates migrate to the surface of glass during the conversion of glass tubing to vials at high temperature, and they disrupt the silicon oxide tetrahedral network to form alkali-rich residues attached to the surface. These residues may become dissolved or dislodged during processing or washing and then leave behind pits on the vial inner surface, which becomes solvent-accessible. The extra wash of Lot C may have reduced the observed alkaline residues, while maintaining the disrupted surfaces to allow high levels of silicon extraction and high propensity of the vials to delaminate. This hypothesis is consistent with the observed results.
Most Informative Technique in Accessing Glass Quality
Based on the observed data for all seven lots of vials and reexamination of outlier Lot C of different processing, the ratio of Si:Na measured by ICP-MS was the most informative technique in assessing overall glass quality. The level of Na correlates to alkalinity for the overall degree of defects on the glass surface. The level of Si correlates to the visual inspection after ALF for the degree of impact on the silica tetrahedral network, which corresponds to the propensity of the vial to form lamellae. The combination of the two measurements as a ratio of Si:Na will prevent passage of vials that are processed differently that may seem to have high glass quality, but will still form high percentage of lamellae like Lot C did. Based on the Si:Na ratio, lower ratios (<1.00) like with Lots A and B seems to have lower alkalinity and lower percentage of lamellae, while higher ratios (>1.00) like Lots C to F will have higher alkalinity and higher propensity for lamellar formation (Table I).
Alkalinity testing by itself can serve as a suitable indicator of glass vial quality, when vials are manufactured and processed under well controlled and reproducible conditions. However, typical glass and vial manufacturing carries some degree of variability, which can affect a small percentage of vials that become hidden under the pooling procedure for acid titration. The individual vial testing of the ICP-MS will allow for detection of these within-lot variability situations. Also, establishing a baseline of extracted elements within and between lots would lead to improved understanding and quality control of glass vials. The baseline could be verified against product-specific use of the vials, as each product could have different interaction with the vials surface due to different formulations, that is, excipients, pH, salt concentration, storage time and temperature, and so forth (12).
Conclusions
Conductivity, flame spectrometry (Na), and ICP-MS (Na, B, Si, and total) measurements on pooled extracts from glass vials by the Ph. Eur. method showed good correlation with Ph. Eur. original acid titration (alkalinity). Visual inspection of ALF-treated glass vials also showed correlation with alkalinity. However, results of one lot that was processed differently than the others showed that the ratio of Si:Na measurements of ICP-MS was the best technique in assessing the overall quality of the glass vials. This was due to Na correlation with alkalinity and Si correlation with lamellae formation. Establishing a specification baseline for the ratio of Si:Na within glass vial extractions may serve as a screening marker for overall glass quality and delamination propensity.
Conflict of Interest Declaration
The authors declare that they have no competing interests.
Acknowledgements
Authors would like to thank the glass delamination investigation team, Lourdes Perez, Gianni Torraca, and Shawn Cao, for our useful discussions.
- © PDA, Inc. 2016


Jump to section
Related Articles
Cited By...
- Measurement of Solution Composition as an Alternative to Titration for Evaluating the Hydrolytic Resistance of Glass
- Characterization of a Novel Particle in a Pharmaceutical Drug Product
- Materials in Manufacturing and Packaging Systems as Sources of Elemental Impurities in Packaged Drug Products: An Updated Literature Review
- An Evaluation of the Glass Vial Hydrolytic Resistance Method