
Abstract
Reduction of reference standard endotoxin activity was kinetically analyzed under low endotoxin recovery conditions and was considered as an apparent first-order reaction. Temperature, pH, and salt concentrations affected the rates of reduction of reference standard endotoxin activity. Temperature appeared to be the most important factor affecting low endotoxin recovery. Components of low endotoxin recovery matrices, such as citrate and polysorbate 20, showed similar low endotoxin recovery effect at concentrations commonly used. Phosphate concentrations showed negative correlation against the half-life of reference standard endotoxin activity in solutions containing phosphate buffer and polysorbate 20. Activation energy for low endotoxin recovery with naturally occurring endotoxin was higher than that with reference standard endotoxin, and this explained one of the reasons for naturally occurring endotoxin resistance to low endotoxin recovery. Lower temperature, lower pH, and a higher salt concentration are preferable to avoid low endotoxin recovery in a hold-time study. This study provides useful data for anticipation of the severity of the low endotoxin recovery effect and future hold-time studies in the biopharmaceutical field.
LAY ABSTRACT: Endotoxin derived from Gram-negative bacteria is potentially harmful when it is parenterally administrated. Therefore, injectables and medical devices are tested by the bacterial endotoxins test to detect contamination by endotoxin of those products. Low endotoxin recovery is a phenomenon of reduction of detectable standard endotoxin activity by certain matrices of biopharmaceutical products containing a chelating agent and a detergent, and it is a controversial topic because its mechanism and clinical risks are unknown. The author analyzed the kinetics of low endotoxin recovery to elucidate the mechanism of low endotoxin recovery and to propose conditions to avoid low endotoxin recovery.
- Lipopolysaccharide
- Reference standard endotoxin
- Low endotoxin recovery
- Limulus amebocyte lysate
- Bacterial endotoxins test
- Naturally occurring endotoxin
Introduction
The bacterial endotoxins test (BET) is required for parenteral drugs and certain medical devices (1), and the pharmaceutical industry has been increasing efforts to prevent the contamination of their products by endotoxin. An alternative method to the rabbit pyrogen test, the BET detects activity of endotoxin by using Limulus amebocyte lysate (LAL). The BET was adopted by pharmacopoeias throughout the world and was internationally harmonized (2). Endotoxin is lipopolysaccharide (LPS), which is an amphipathic substance (3). Standard endotoxins are prepared from purified LPS that is usually derived from Escherichia coli (4). LPS shows a range of biological activity (5, 6), and its aggregation status affects the biological activity (7). Endotoxin aggregates are more potent than monomers in pyrogenicity in rabbits (8), stimulation of immune cells (9), and the LAL test (9).
Low endotoxin recovery (LER) is a recent controversial topic in the biopharmaceutical field (10, 11). LER is defined as a gradual loss of detectable endotoxin activity of purified LPS, such as reference standard endotoxin (RSE) and control standard endotoxin (CSE), spiked into certain undiluted pharmaceutical products. It was detected during the hold-time studies of the biopharmaceutical products (12). The hold-time study was recommended by the United States Food and Drug Administration (FDA) in the guidance for industry in 2012 (13). Although the hold-time study is not required in the compendial BET, FDA considers that LER is a potential safety issue (14). Therefore, an appropriate hold-time study is necessary to submit a biopharmaceutical product for approval. Understanding the kinetics of LER will be helpful to handle products showing LER.
In the BET, low recovery of endotoxin in a sample is usually considered as inhibition of the sample on the LAL test. However, there are at least two possible causes on the low recovery of endotoxin: inhibition of the sample on the LAL activation and decrease of endotoxin activity caused by the sample. They have been observed for many years, and have been often confused. For example, RSE or CSE activity was decreased by trace amounts of a certain metal cations, such as aluminum (15), iron (15, 16), and gallium (15, 17), and some antibiotics (17). Tsuchiya (15) developed a modified spiking method to observe the effect of a sample on endotoxin detection, and Fujita et al. (17) applied the method to their products. They demonstrated that addition of endotoxin after mixing the sample and LAL avoided the effects of those substances on spiked endotoxin. The modification of spiking methods (15, 17) suggested that those substances altered the potency of spiked endotoxin, but that there was no inhibition by the components to LAL activation. In LER caused by a chelating agent and a detergent, the activity of the spiked LPS in undiluted products was not recovered by common treatments, such as simple dilution, even though the diluted sample did not show inhibition of the BET (18). This suggests that LER is change in endotoxin activity caused by the products, and is not inhibition of LAL activation by the products. Mechanisms of LER caused by a matrix containing a chelating agent and a detergent have been proposed (19, 20). The mechanism of the LER is probably different from that caused by metal cations, although both decrease spiked endotoxin activity. Some factors affecting LER have been reported (20, 21), but no study has described a kinetic analysis on LER under various conditions.
In this study, real-time activity changes of RSE were measured under LER conditions. Even though the LER mechanism is considered to involve at least two steps, the chelating reaction and the effect of a detergent (19, 20), the kinetics of RSE activity change can be analyzed by an apparent first-order reaction. The half-life of RSE was calculated from the reaction rate constant k for each LER condition. The data on the half-life of RSE provide us with information concerning the effects of factors affecting LER, and is useful for the design of hold-time study conditions. Naturally occurring endotoxin (NOE) was reported to resist LER conditions (22, 23). The activation energy of a NOE derived from Enterobacter cloacae was compared with that of RSE, and the difference in LER between RSE and NOE is discussed.
Materials and Methods
Sample Preparation
Stock solutions were prepared from reagent-grade chemicals and were filtered with positively charged 0.2 μm filters (Acrodisc Syringe Filter 0.2 mm Posidyne Membrane, Pall Life Science, Ann Arbor, MI). Endotoxin was not detected in the stock solutions by the LAL test. Water used was LAL Reagent Water (LRW, Charles River, Charleston, SC), and 5% sodium chloride was purchased from B/Braun (5% Sodium Chloride Injection USP, Irvine, CA). A solution containing 111% of target concentrations of components was prepared from stock solutions and used as a base LER solution. In this paper, LER solution was defined as a solution containing a detergent, such as polysorbate 20, and a chemical removing divalent cations, such as citrate and phosphate. The concentrations of the components were adjusted to 100% by addition of one-tenth volume of an RSE solution for the initiation of LER reaction. The USP reference standard endotoxin—RSE, 10,000 USP endotoxin units (EU) per vial—was reconstituted with 5 mL LRW and diluted with LRW to preferable concentrations. NOE derived from E. cloacae ATCC 7256 was a gift from John Dubczak (Charles River).
Measurement of Endotoxin
Endotoxin activity was measured by the kinetic chromogenic assay (KCA). LAL used was Endochrome-KTM (Charles River), and it was reconstituted with the endotoxin-specific buffer (Charles River) to eliminate possible glucan interference. A 0.01 mL of sample was added to a reaction tube containing 0.1 mL LAL and 0.1 mL LRW (direct assay), and the reaction mixture was set on a tube reader (ToxinometerTM, Wako Pure Chemical Industries, Ltd., Osaka, Japan) to perform KCA. Endotoxin standard curves were established by logarithmic plotting of endotoxin concentrations and onset times (reaction time to obtain a 5% decrease of transmittance of a reaction mixture). Quadratic regression was used to calculate endotoxin concentrations in samples.
Measurement of Reduction Rates of RSE Activity in LER Solutions
A base LER solution in a polystyrene test tube (Falcon 352054, BD Biosciences, Bedford, MA) was put on an aluminum block heater (Techne, Dri-Block CB-2D, Staffordshire, UK) set at a target temperature, and it was held for 15 min to 1 h before starting the reaction. One-tenth of an RSE dilution was added to the base LER solution to start the reaction. The LER solution was vortexed for approximately 15 s, and a sample at time 0 was taken for the initial assay. Endotoxin activity was measured by the direct assay with preferable timing. The direct assay was technically able to perform as frequently as once per minute, but the timing was adjusted to the RSE activity reduction rate. In most of the cases, assays were performed every 10 min. Reduction rates of RSE activity were obtained from slopes derived from plotting incubation time versus the natural logarithm of reciprocals of endotoxin recovery.
Analytical Theory and Assumption
Even though the LER phenomenon is considered a two-step reaction (20), the RSE activity change was simply assumed to be a first-order reaction from active-state LPS (LPSa) to inactive-state LPS (LPSi).

The rate of this reaction is expressed as:
 where v is reaction velocity, k is reaction rate constant.
The above equation can be written equivalently as:
 where c is the initial concentration of LPSa, and x is the concentration of reacted LPSa at time t.
Since when t = 0, x = 0, the integrated equation is:
 modify this equation:
 Where LPS activity is expressed as recovery ratio, c = 1 and c − x = Endotoxin Recovery at time t. Therefore, k can be obtained from the slope of plotting t versus the natural logarithm of 1/Endotoxin Recovery. If this assumption is not correct, this plot should not be linear. The reaction rate constant k was used as the reduction rate of RSE activity under the analyzed LER condition.
Calculation of Half-Life of RSE Activity in LER Solutions
Half-life (HL) of spiked endotoxin in an LER solution was defined as time required at a given condition to reduce to 50% the spiked endotoxin activity. Time required to obtain 50% activity was calculated from a reaction rate constant k, and used as an HL value.
Modify eq 1:
 HL is a time when c = 1 and x = 0.5:

Arrhenius Plot and Activation Energy
Taking the natural logarithm of Arrhenius' equation (k = Ae−Ea/(RT)) yields:
 where
where
k is the reaction rate constant,
T is the absolute temperature,
A is a constant,
R is the gas constant, and
Ea is the activation energy.
Rearranging yields:

Since this is a linear equation, plotting ln(k) and (1/T) will provide a slope (–Ea/R). The activation energy (Ea) is calculated by multiplying the negative slope by the gas constant R.
Results
Suitability of Analysis as a First-Order Reaction
Tables I and II show the results of calculation of the reduction rate k. Correlation coefficients r were higher than 0.9 except three cases that showed less than 0.1 for k. As most of the correlation coefficients were higher than 0.9, good linearity was indicated, and therefore the RSE reduction was considered as an apparent first-order reaction.
Kinetic Parameters for RSE Activity Change in LER Solutions Containing Citrate
Kinetic Parameters for RSE Activity Change in LER Solutions Containing Phosphate
Effects of Temperature, pH, and Salt Concentration on LER
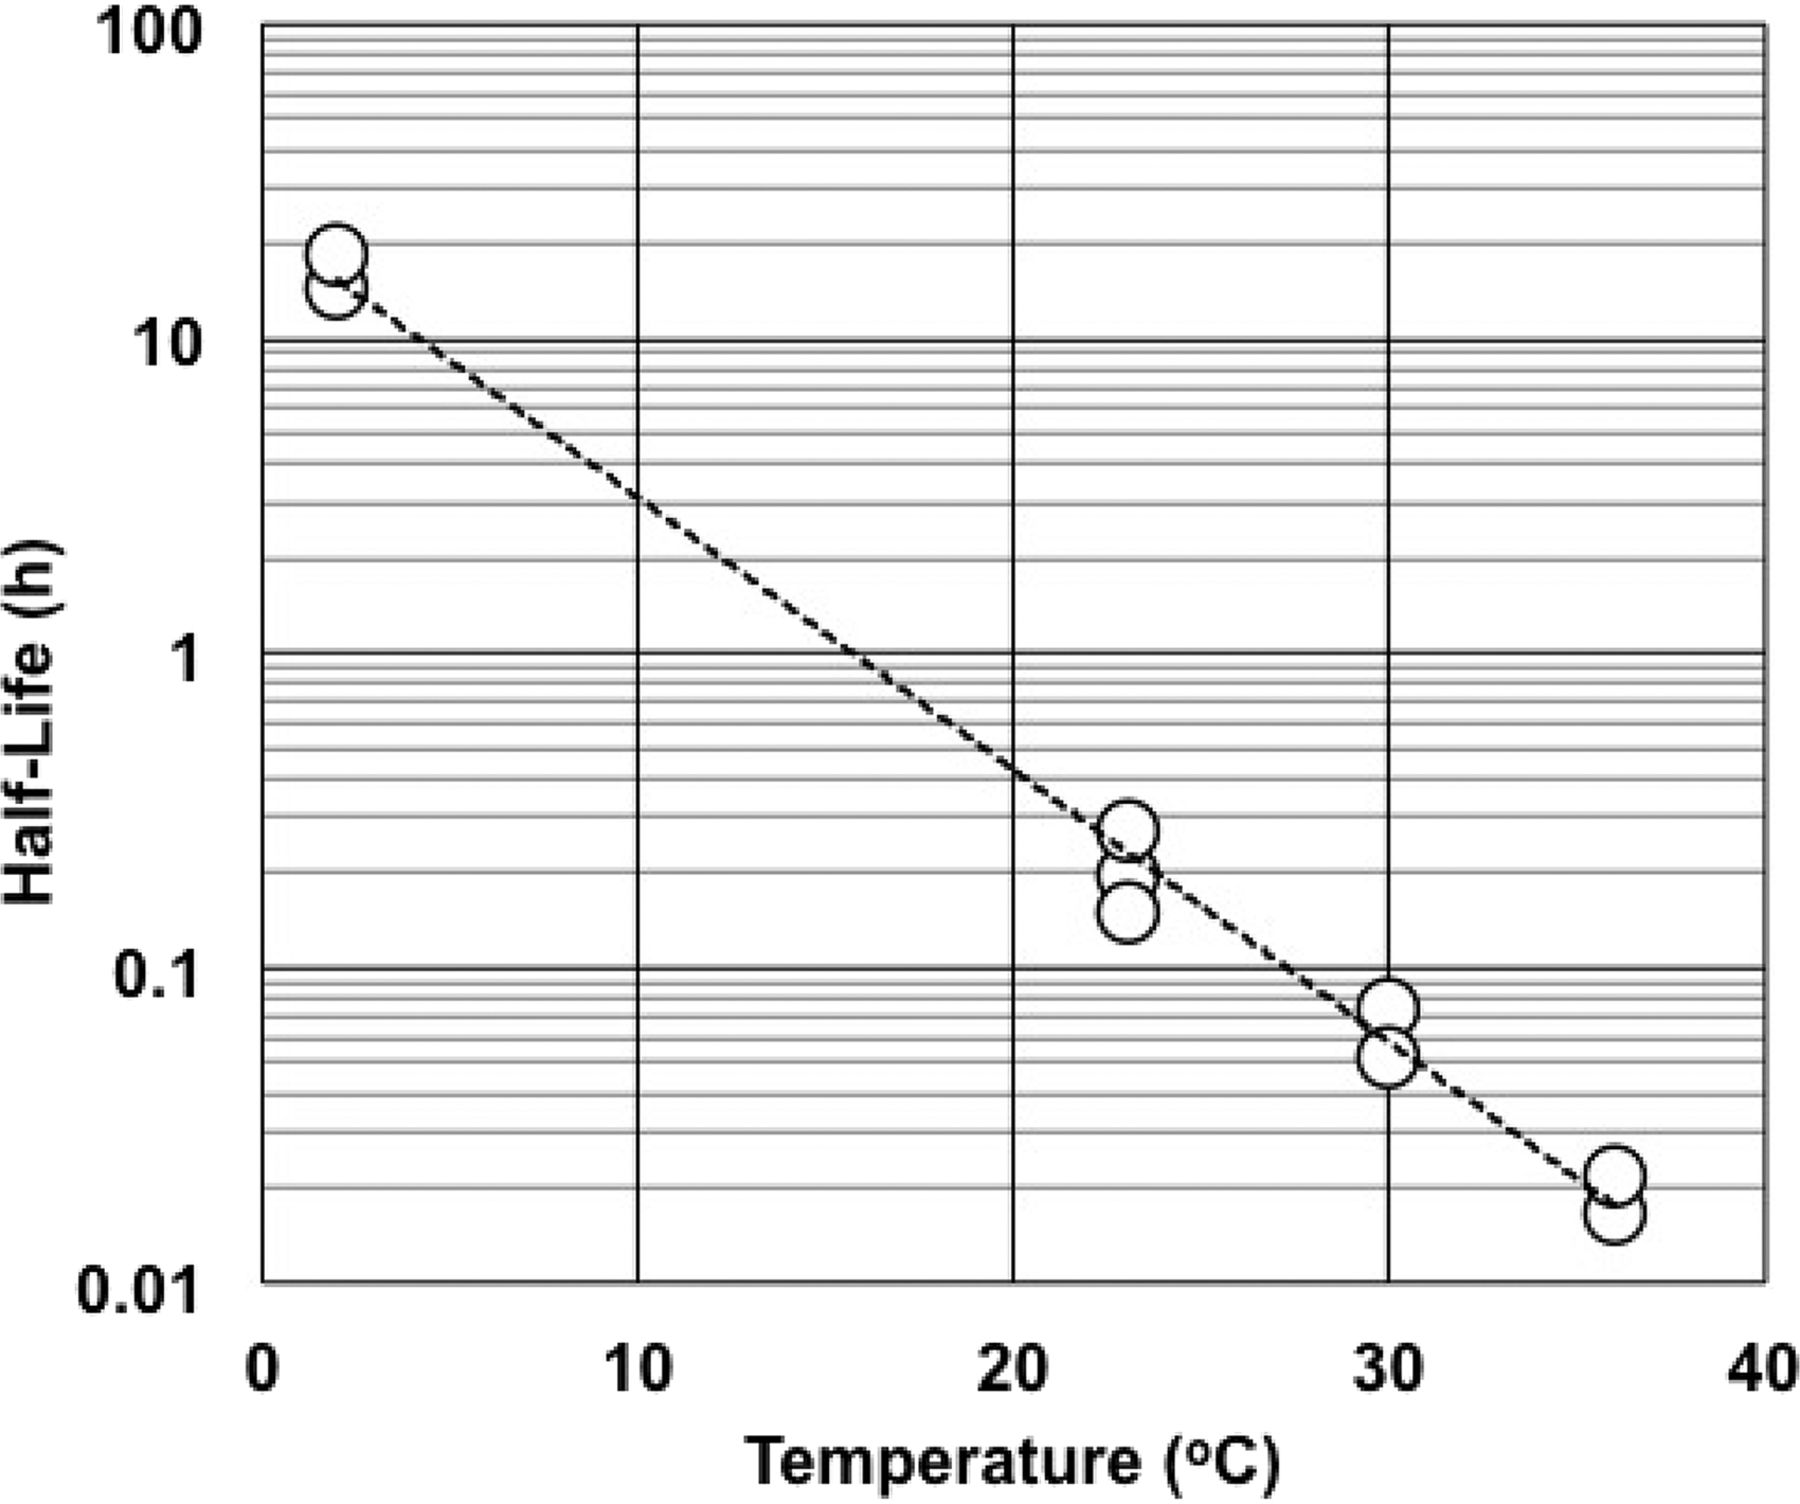
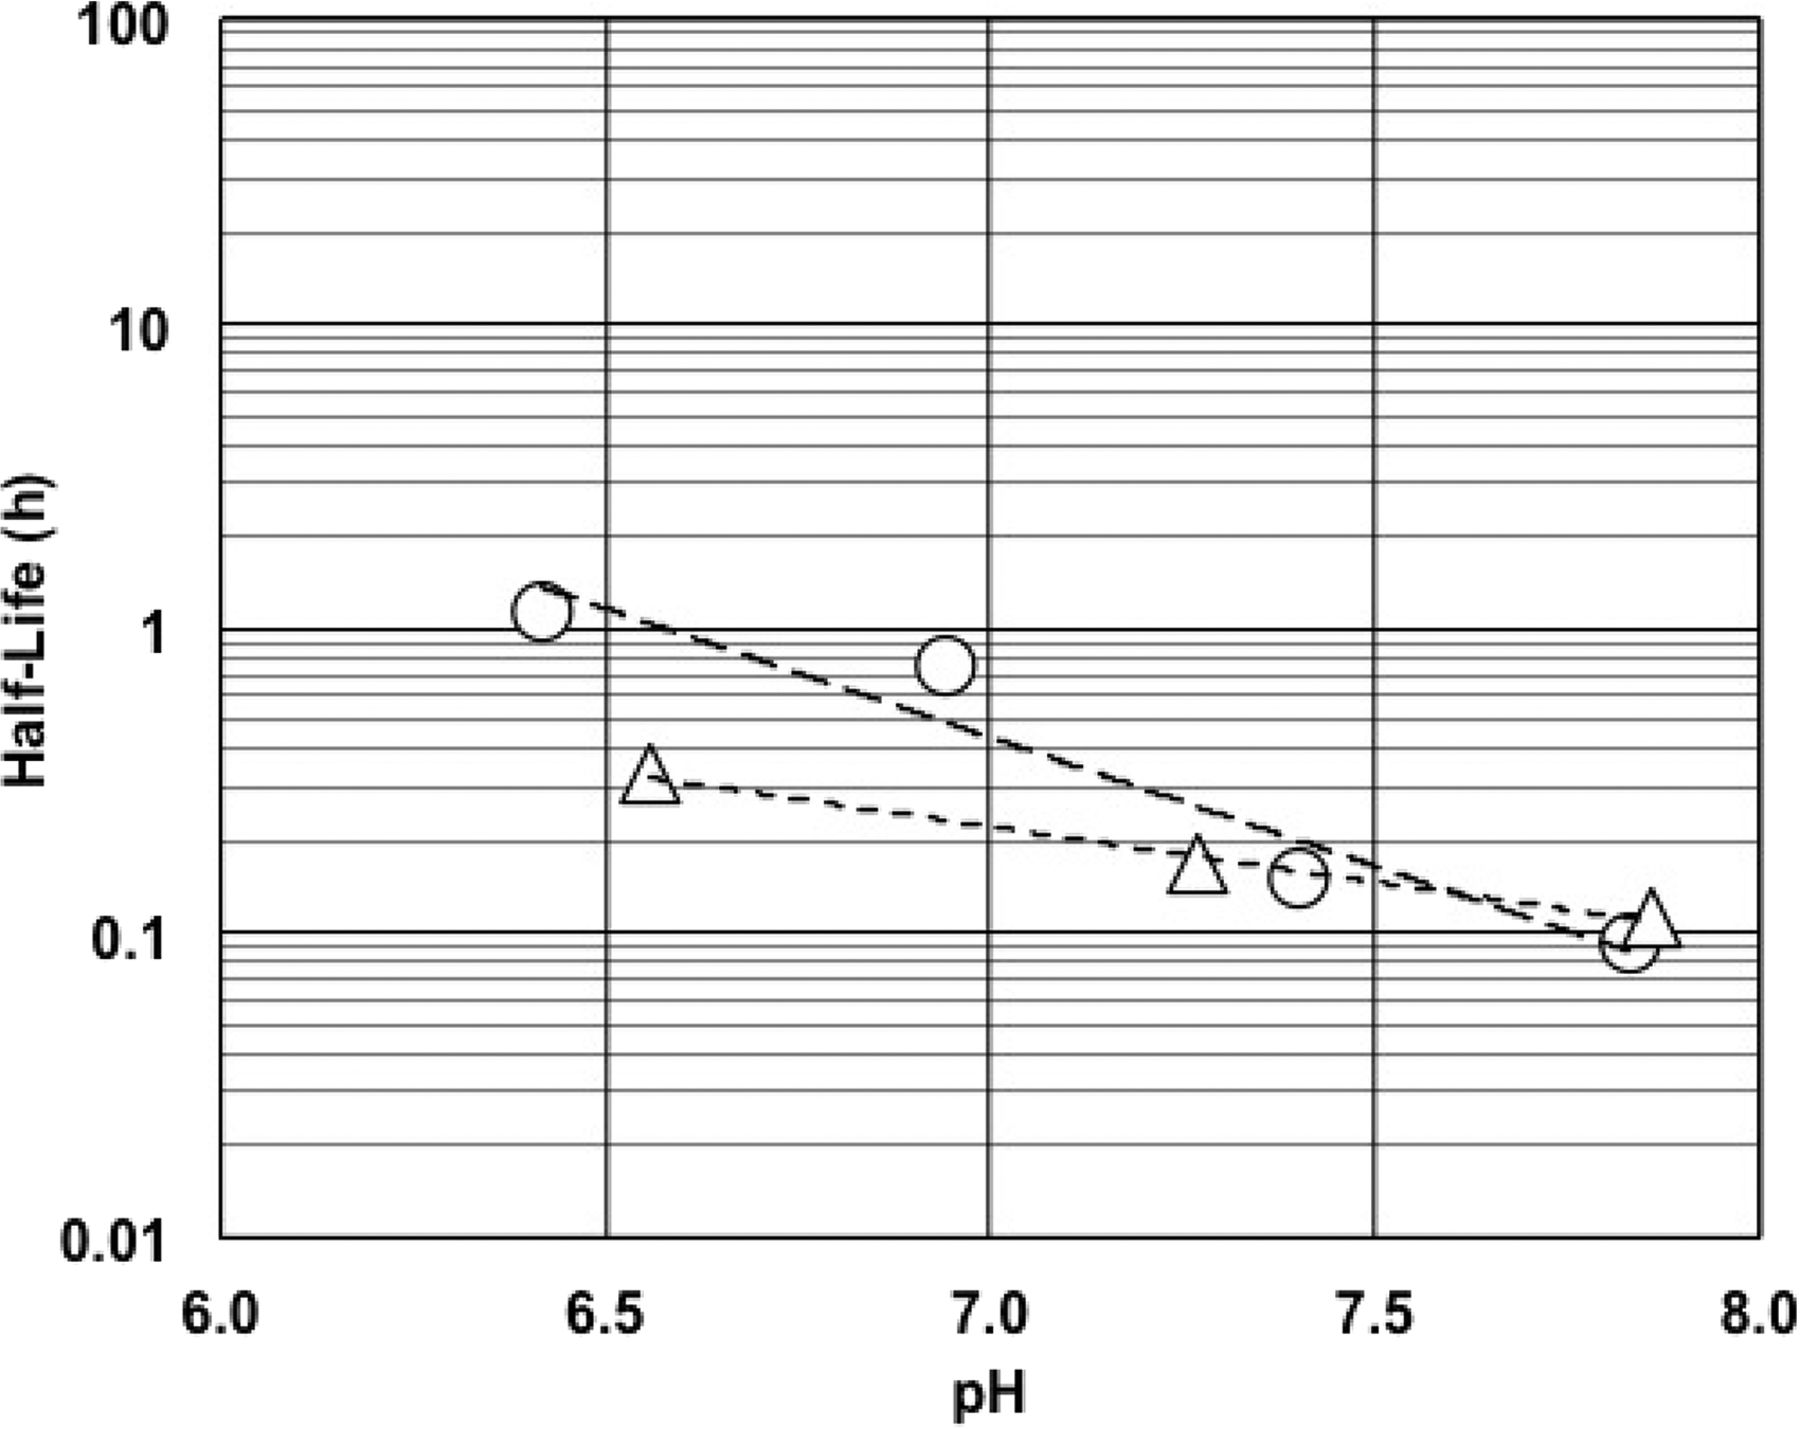
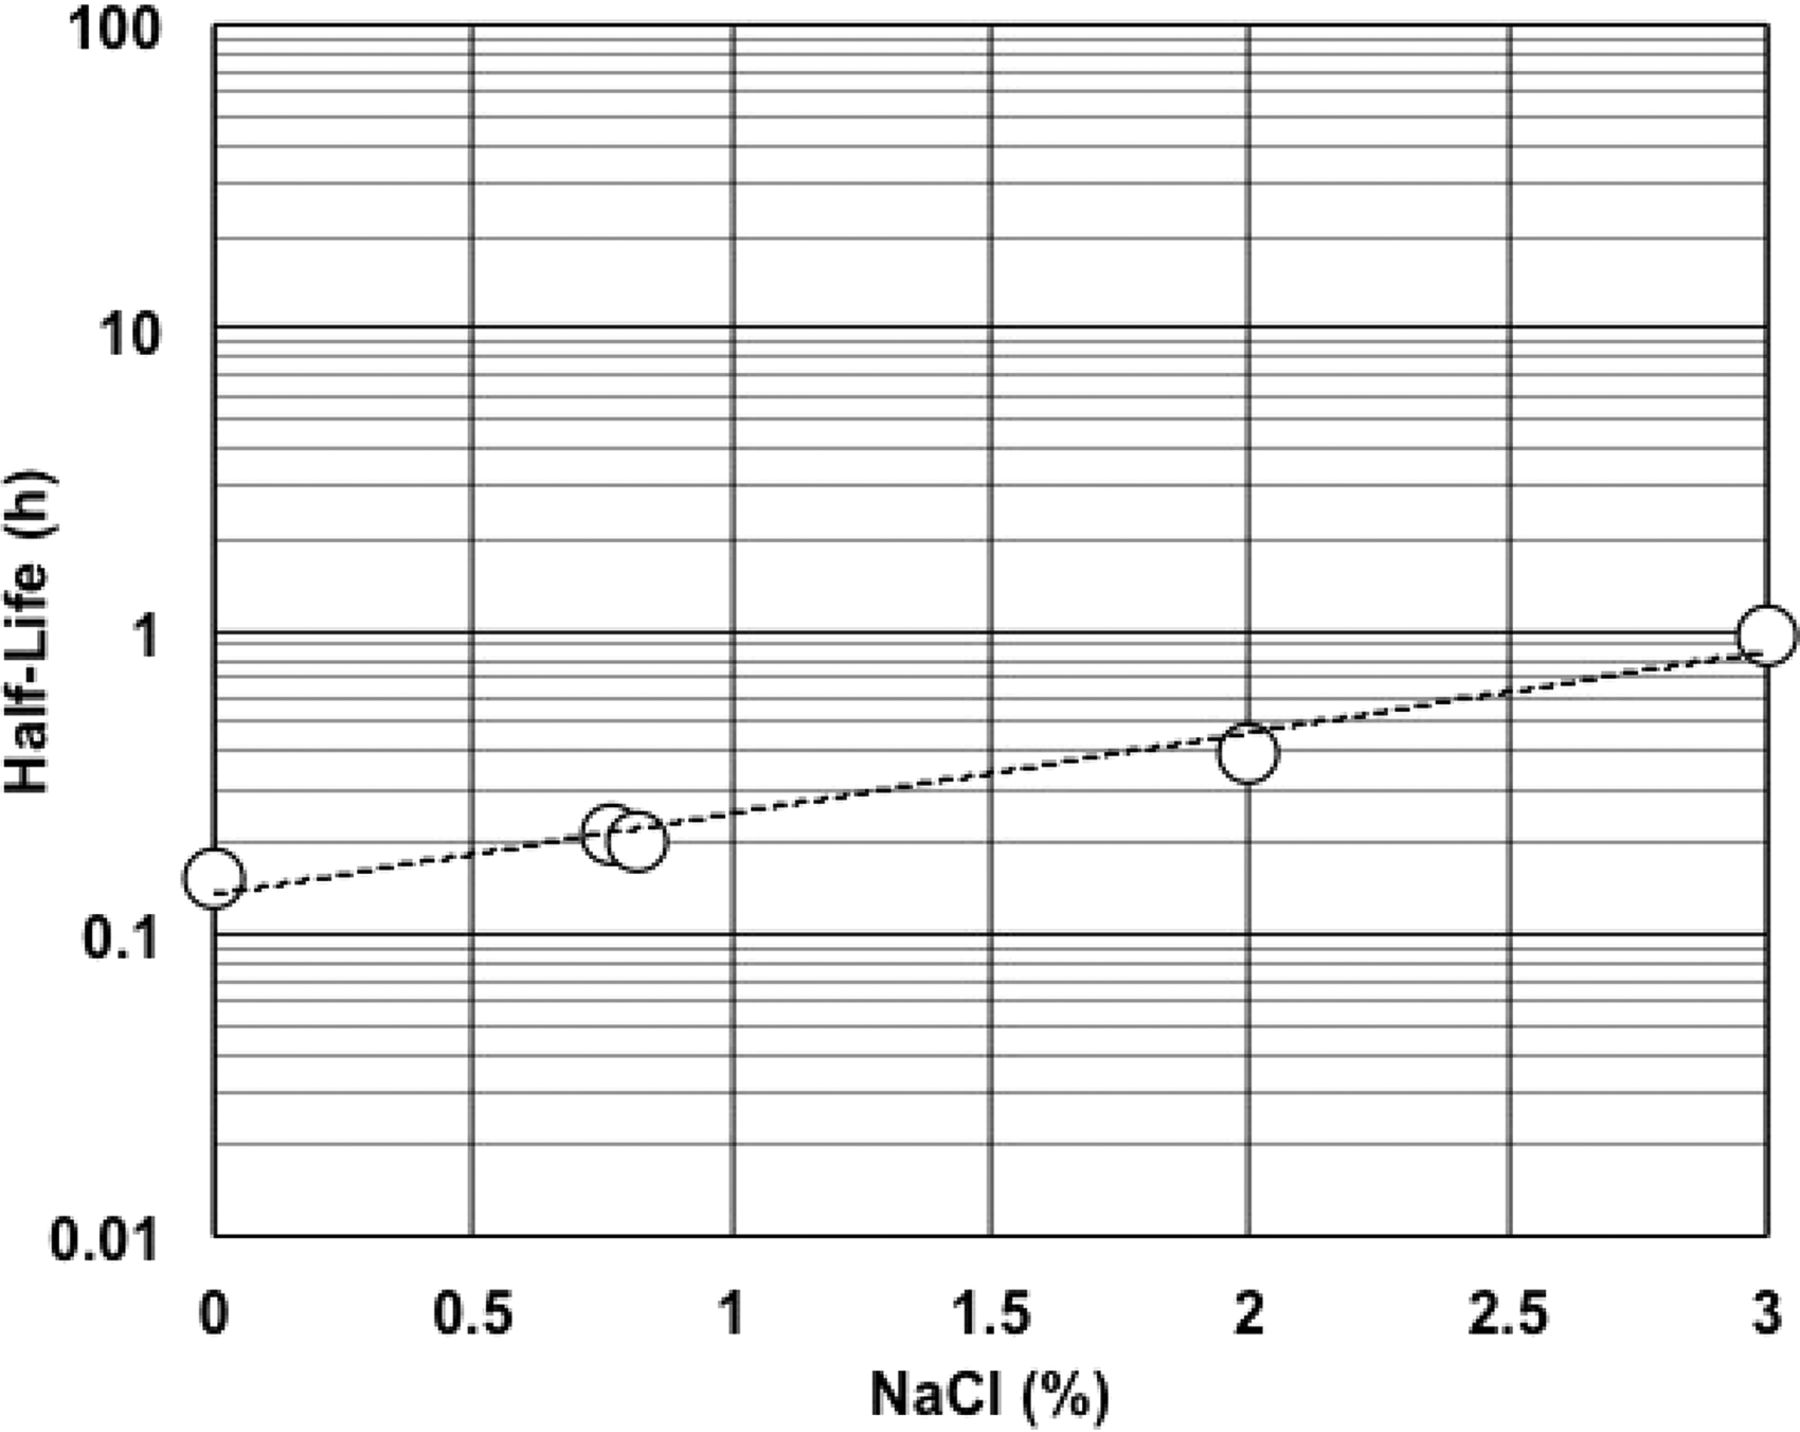
Figure 1 shows the effect of temperature on the half-life of RSE activity under an LER condition. Higher temperature resulted in a shorter half-life of RSE activity. A negative linear correlation was observed between temperature and the logarithm of the half-life of RSE activity. Different concentrations (0.2, 2.0, or 5.0 EU/mL) of RSE did not significantly affect the half-life of RSE activity. The effect of pH on the half-life of RSE activity in LER solutions was observed in the range commonly used for the biopharmaceuticals. As shown in Figure 2, higher pH produced a shorter half-life of RSE activity. The slope with citrate buffer was slightly steeper than that with phosphate buffer, and both buffer components showed a negative linear correlation between pH and the logarithm of the half-life of RSE activity. Lower sodium chloride concentrations produced a shorter half-life of RSE activity (Figure 3). A positive linear correlation was observed between salt concentration and the logarithm of half-life RSE activity.

Effect of temperature on half-life of RSE activity in LER solutions. The LER solutions contained 10 mM sodium citrate, 0.05% polysorbate 20, and 0.2, 2.0, or 5.0 EU/mL RSE. The pH of the solutions was between 7.3 and 7.4. The regression curve obtained was log(HL) = −0.0865 × (Temperature) + 1.36, and the correlation coefficient was −0.996.

Effect of pH on half-life of RSE activity in LER solutions. The LER solutions with citrate (open circles) contained 10 mM sodium citrate, 0.05% polysorbate 20, and 5.0 EU/mL RSE. The pH of the solutions was between 6.4 and 7.8. The regression curve obtained (long dashed line) was log(HL) = −0.846 x (pH) + 5.57, and the correlation coefficient was −0.967. The LER solutions with phosphate (open triangles) contained 25 mM phosphate buffer, 0.05% polysorbate 20, and 5.0 EU/mL RSE. The pH of the solutions was between 6.6 and 7.9. The regression curve obtained (short dashed line) was log(HL) = −0.363 × (pH) + 1.89, and the correlation coefficient was −0.994.

Effect of salt concentrations on half-life of RSE activity in LER solutions. The LER solutions contained 10 mM sodium citrate, 0.05% polysorbate 20, 5.0 EU/mL RSE, and 0–3.0% sodium chloride. The pH of the solutions was 7.4. The regression curve obtained was log(HL) = 0.268 × (NaCl) – 0.873, and the correlation coefficient was 0.986.
Effects of Matrix Components on LER at Relevant Concentrations
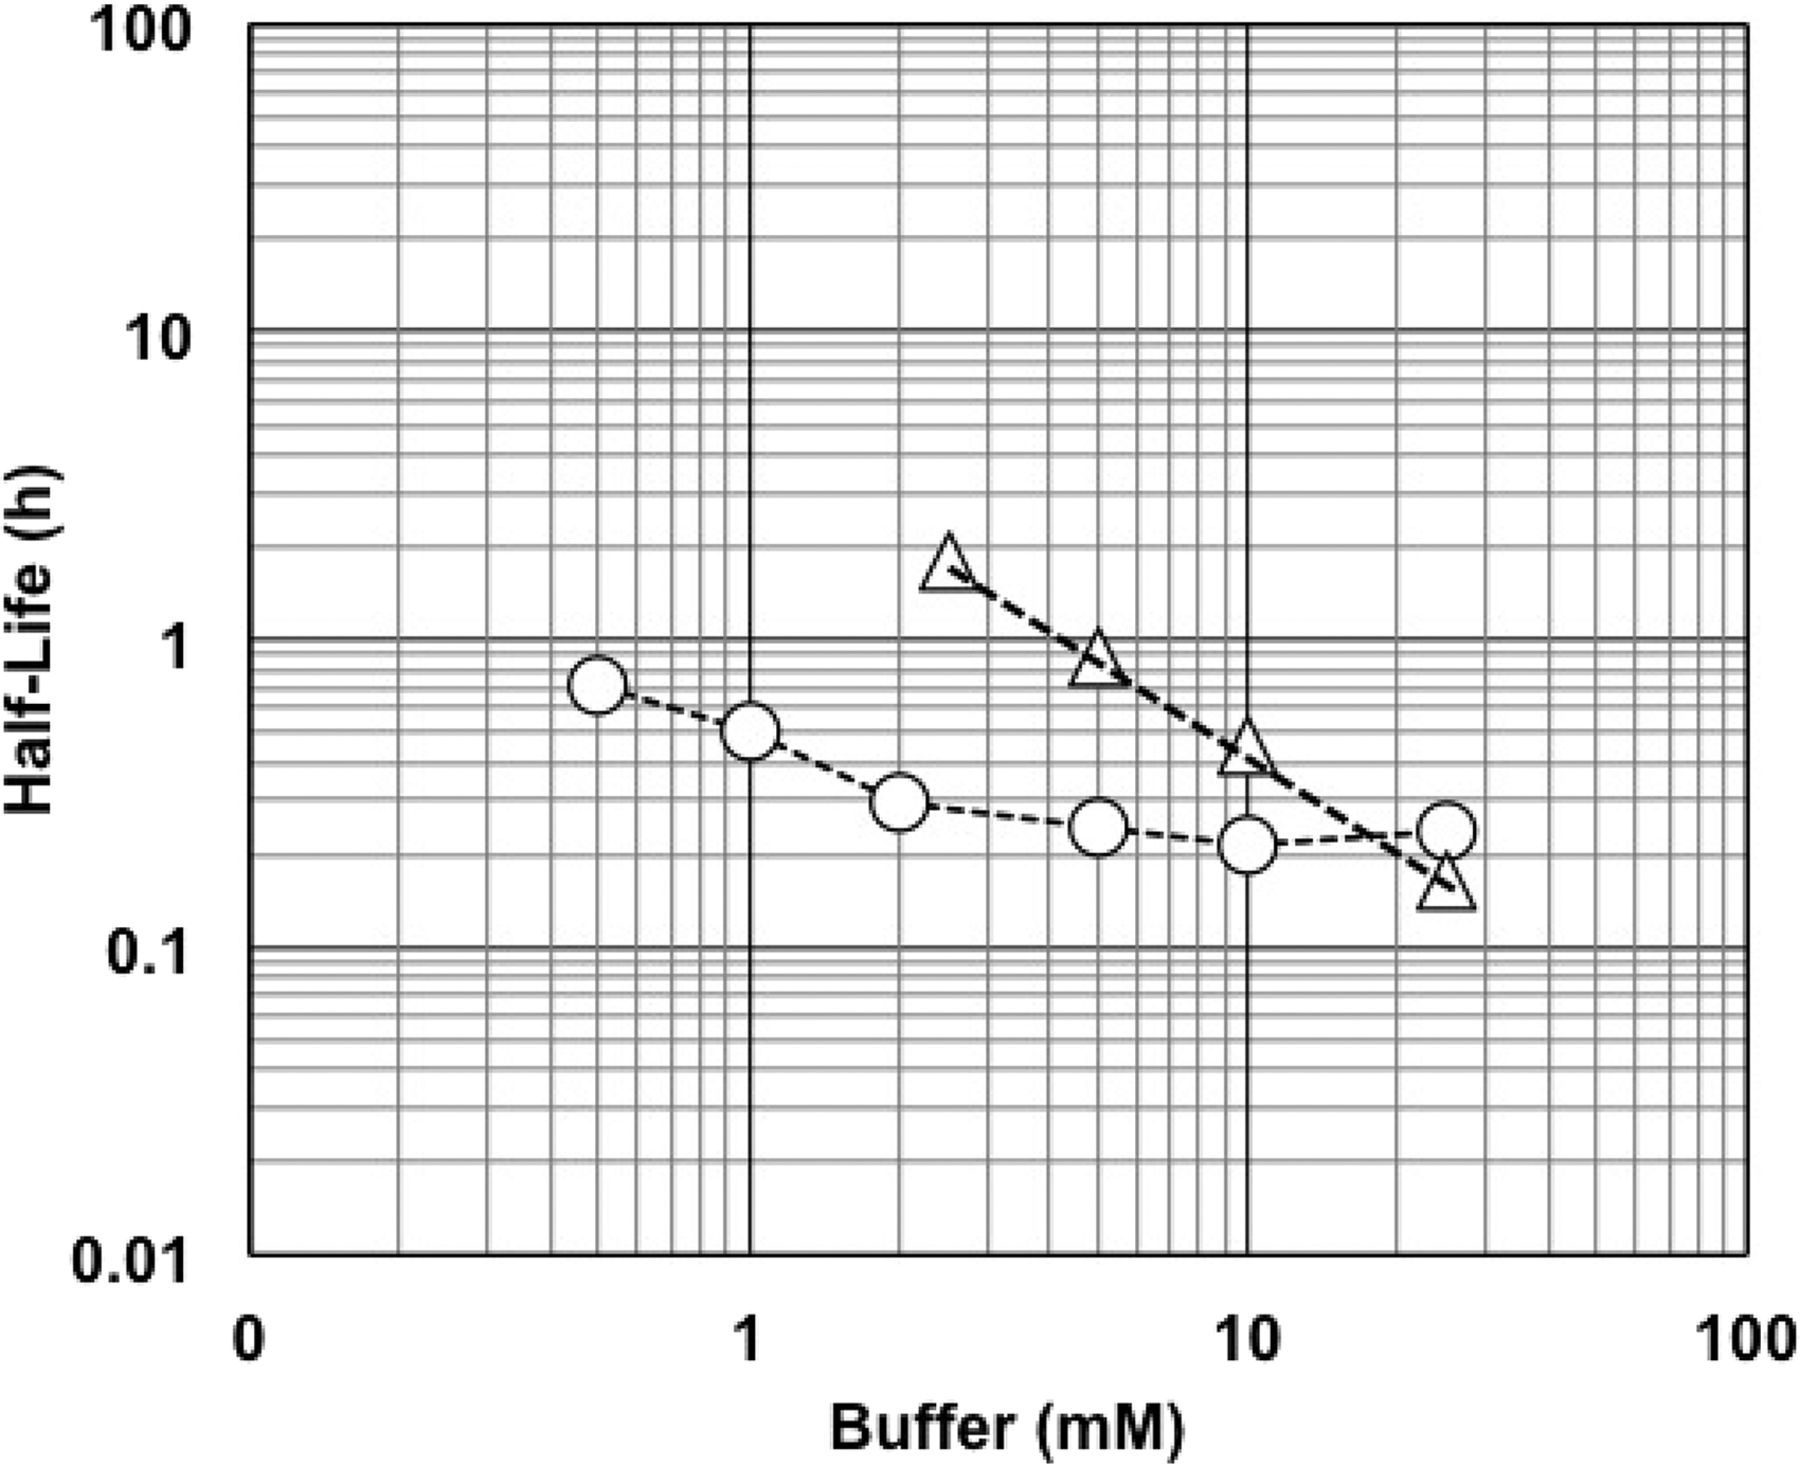
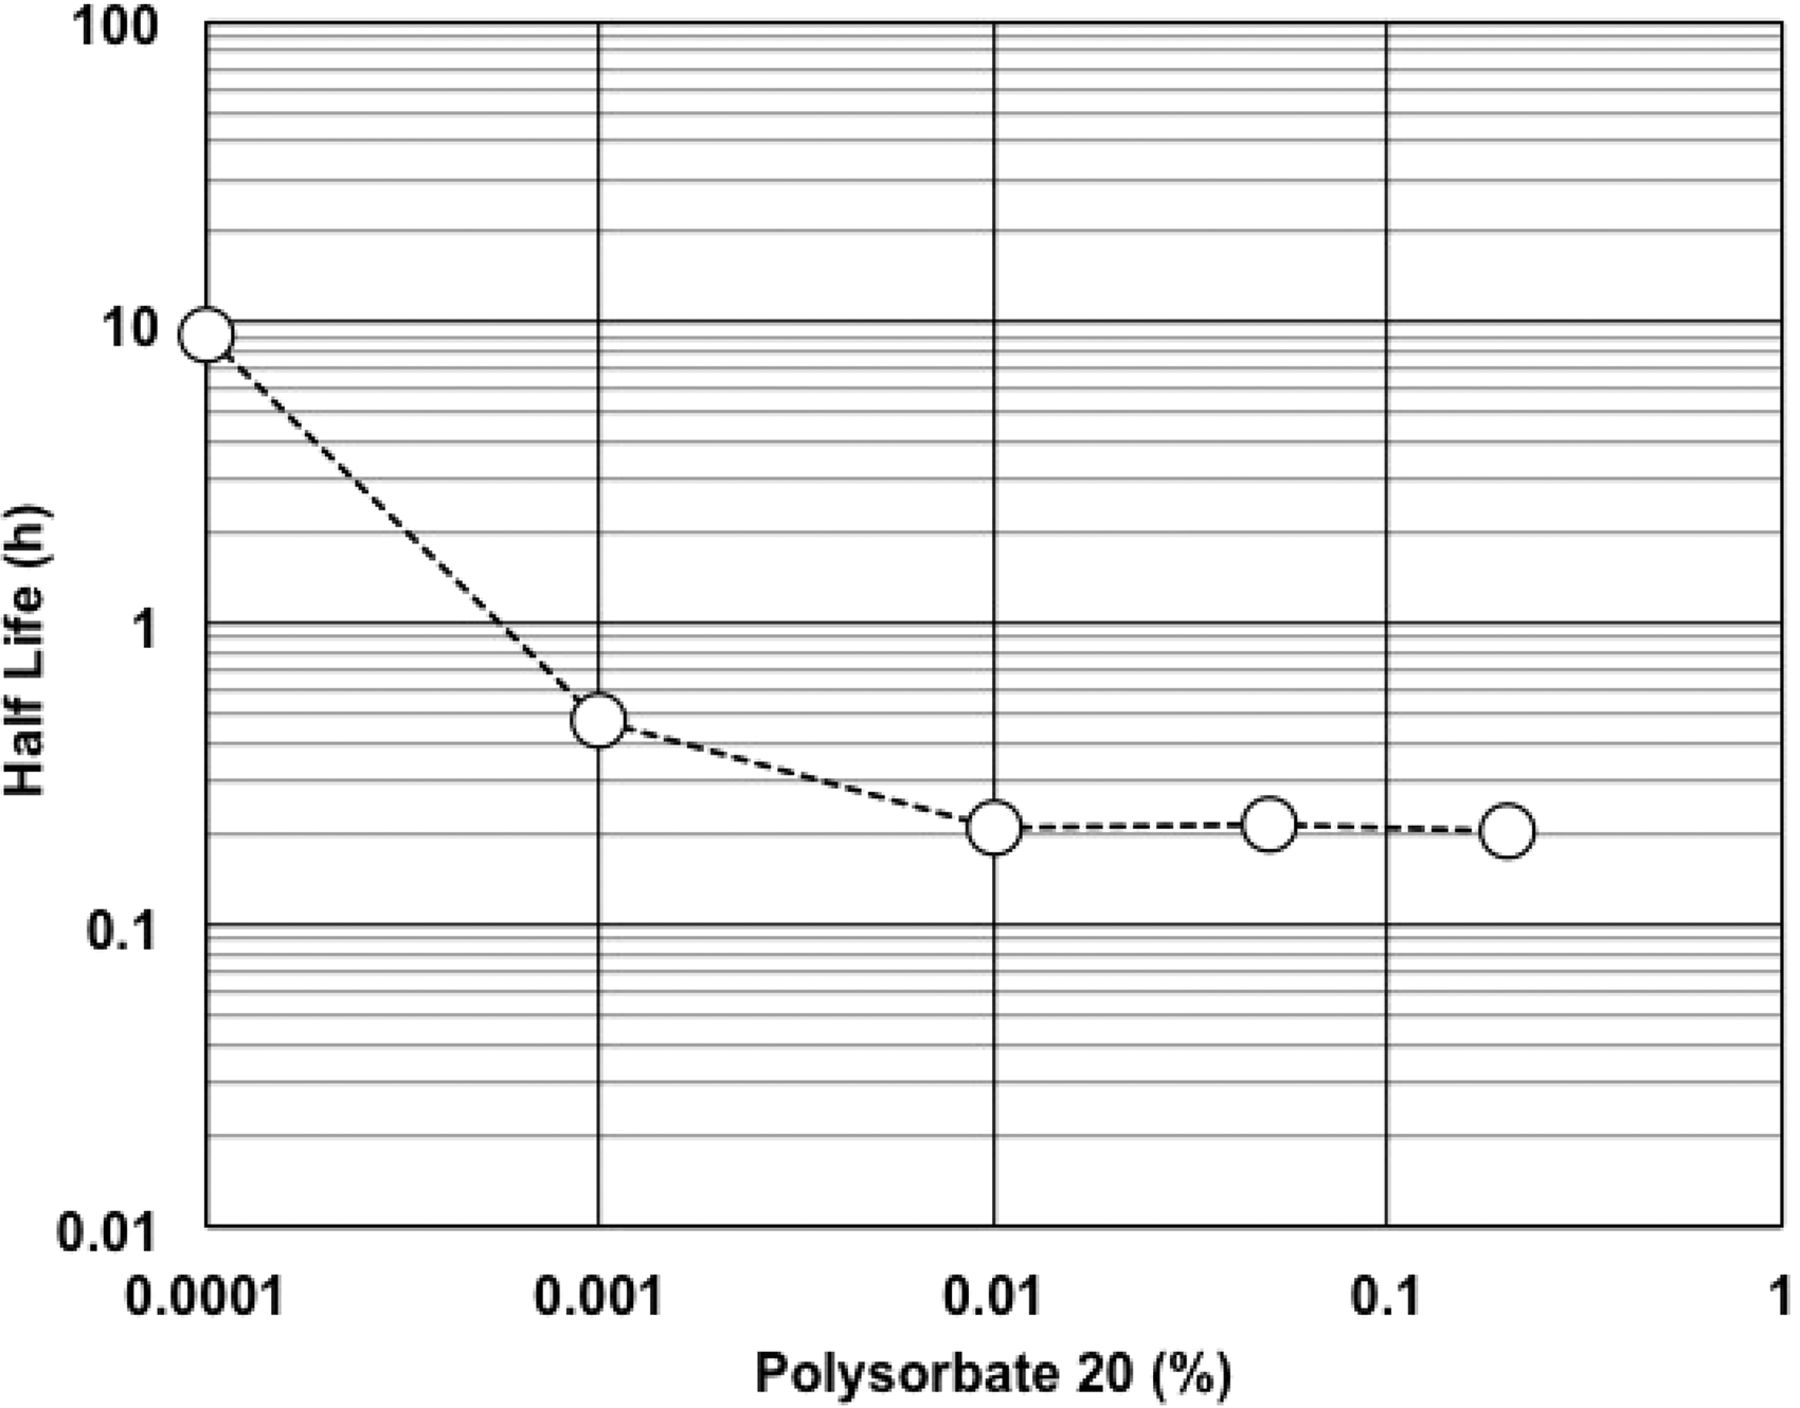
Effects of matrix components on RSE activity in LER solutions were observed at concentrations commonly used in biopharmaceutical products. Sodium citrate (Figure 4), sodium phosphate (Figure 4), and polysorbate 20 (Figure 5) were chosen as the matrix components. The concentrations commonly used for sodium citrate, phosphate buffer, and polysorbate 20 were assumed as 5–25 mM, 10–25 mM, and 0.01–0.2%, respectively. Sodium citrate and polysorbate 20 showed similar half-life of RSE at the concentrations commonly used. The half-life of RSE activity was prolonged by further reduction of the concentrations of these components. A linear correlation was observed in the logarithmic plotting of phosphate buffer concentration versus half-life of RSE activity.

Effect of buffer concentrations on half-life of RSE activity in LER solutions. The LER solutions contained 0.5–25 mM sodium citrate, 0.05% polysorbate 20, 0.8% sodium chloride, and 5.0 EU/mL RSE (open circles). The pH of the solutions was 7.4. The LER solutions contained 2.5–25 mM phosphate buffer (PB), 0.05% polysorbate 20, and 5.0 EU/mL RSE (open triangles). The pH of the solutions was 7.1–7.4. A linear relationship was observed, using a logarithmic plot for the phosphate concentrations and the half-life of RSE activity. The regression curve obtained (linear dashed line) was log(HL) = −1.03 × log(PB) − 0.674, and the correlation coefficient was −1.00.

Effect of polysorbate 20 concentrations on half-life of RSE activity in LER solutions. The LER solutions contained 10 mM sodium citrate, 0.0001–0.2% polysorbate 20, 0.8% sodium chloride, and 5.0 EU/mL RSE. The pH of the solutions was 7.4.
Arrhenius Plot and Activation Energy with RSE and NOE
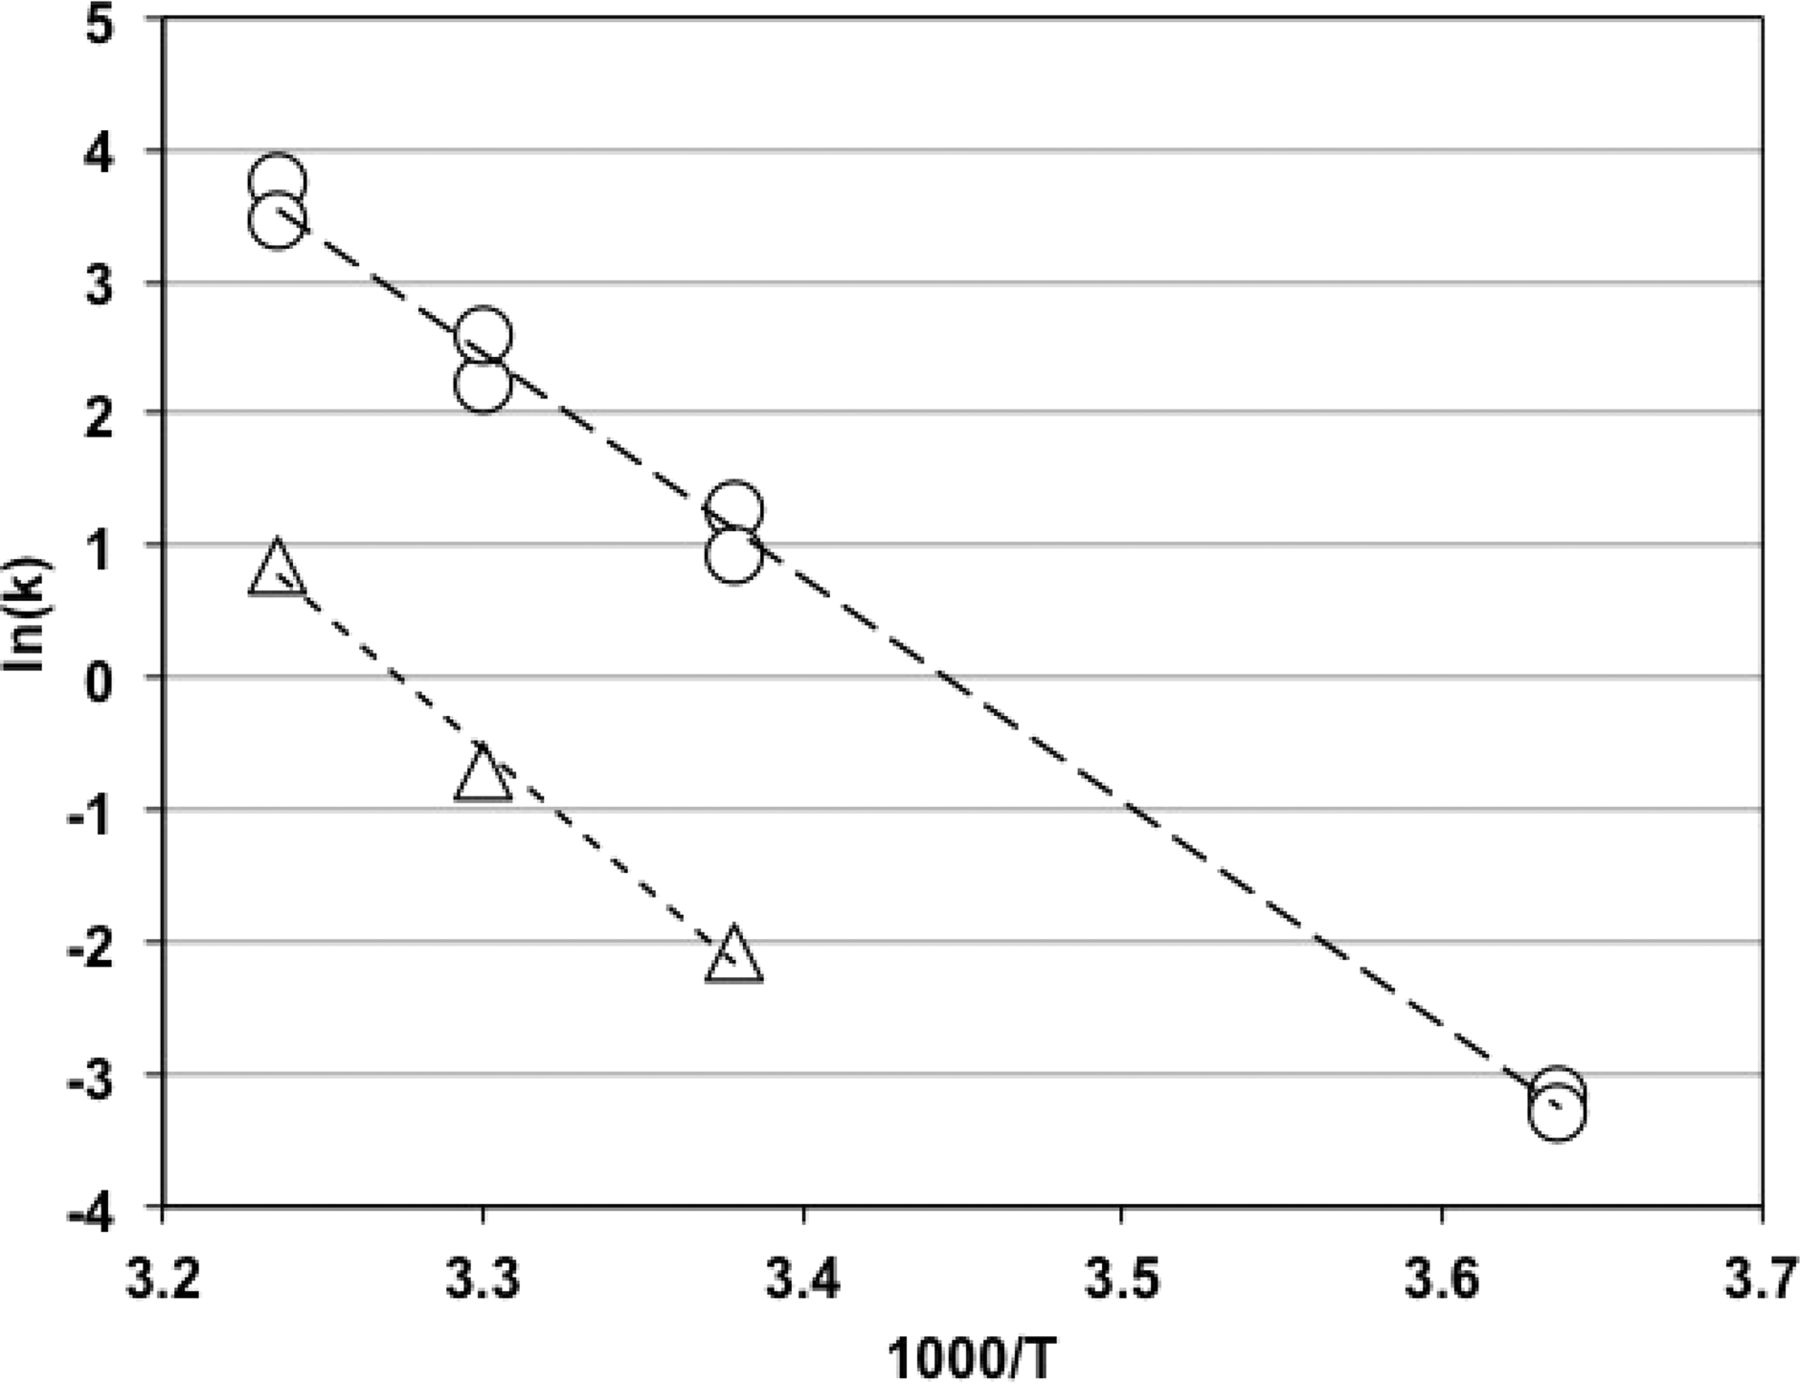
To draw the Arrhenius plot, reaction rate constants k were measured with RSE and NOE at four (2 °C, 23 °C, 30 °C, and 36 °C) and three (23 °C, 30 °C, and 36 °C) different temperatures, respectively. LER matrix was 10 mM sodium citrate, 0.05% polysorbate 20, pH at 7.4. Figure 6 shows the Arrhenius plots with RSE and NOE. The slopes were −16.96 with RSE and −20.58 with NOE. Activation energy was calculated by dividing negative slopes by the gas constant R (1.98 cal mol−1 deg−1), and 33.6 (kcal mol−1) and 40.8 (kcal mol−1) were obtained for RSE and NOE, respectively.

Arrhenius plots of RSE and NOE activity decrease in LER solutions. The LER solutions with RSE (open circles) contained 10 mM sodium citrate, 0.05% polysorbate 20, and 0.2, 2.0, or 5.0 EU/mL RSE. The pH of the solutions was between 7.3 and 7.4. The regression curve obtained (long dashed line) was log(k) = −17.0 × (1000/T) + 58.4, and the correlation coefficient was −0.998. The LER solutions with NOE (open triangles) contained 10 mM sodium citrate, 0.05% polysorbate 20, and 5.0 EU/mL NOE derived from E. cloacae. The pH of the solutions was between 7.2 and 7.3. The regression curve obtained (short dashed line) was log(k) = −20.6 × (1000/T) + 67.4, and the correlation coefficient was −0.995.
Discussion
Reduction of RSE activity under LER condition was considered to be an apparent first-order reaction because of the linearity of the relationship between t and the natural logarithm of 1/Endotoxin Recovery. There were three examples that showed low correlation coefficients, but these were considered to be caused by gradual slopes of the regression curves. Two of them were experiments at low temperature (2 °C). The reduction rates at low temperature were expected to be low. Even though the data were taken for 5–6 h, it was not enough to obtain enough reduction of RSE activity in the samples. When the data were taken with LER solution containing 10 mM sodium citrate and 0.05% polysorbate 20, pH 7.1 for 4 days at 2–5 °C, the correlation coefficient of the plotting t versus the natural logarithm of 1/Endotoxin Recovery was 0.990 and k was 0.048 (data not shown). This data also supported the assumption of the apparent first-order reaction at low temperature. The one showing the lowest correlation coefficient was LER solution containing 0.0001% polysorbate 20. The concentration of polysorbate 20 was probably too low to cause LER. Considering that a citrate solution does not show LER without a detergent (20), it is reasonable not to see high LER at this condition. This indicates that there should not be significant correlation between storage time and RSE activity, and that the correlation coefficient should be low. Suitability of the assumption allowed calculation of the reaction rate constants k and the half-life of RSE activity. The magnitude of the effects on the half-life of RSE activity in LER solutions was compared to the factors affecting LER. Temperature, pH, salt concentrations, and components in LER matrices, that is, citrate, phosphate, and polysorbate 20, were selected to be evaluated for their effects on LER.
Reich et al. pointed out that the LER reaction was temperature-dependent (20). In this study, the temperature effect was kinetically analyzed. Temperature showed a strong effect on the half-life of RSE activity in LER solutions, and a linear relationship was observed between temperature and the logarithm of the half-life of RSE activity in LER solutions (Figure 1). This provided an estimation of the difference of the half-life of RSE activity caused by different storage temperatures. For example, the half-life of RSE activity at 2 °C was about 100 times longer than that at 25 °C. This indicates that temperature should be strictly controlled for hold-time studies. Bolden et al. (21) reported that the mixing time of samples containing citrate and polysorbate 80 spiked with CSE affected endotoxin recovery, and a shorter mixing time (1 min) showed better endotoxin recovery than a longer mixing time (15 min). Their samples were stored at 2–8 °C, but the temperature was elevated during the mixing. It was pointed out that the temperature effect could explain lower endotoxin recovery in the experiments (21). Because the temperature of the samples cannot be ignored in hold-time studies, previous data should be re-analyzed considering the operating temperature. The conditions of LER studies should be designed carefully, especially for temperature control, because temperature strongly affects the half-life of RSE activity under LER conditions.
It was reported that the pH of the sample affected LER (20). The pH effect obtained in this study confirmed that higher pH provided a faster decrease of RSE activity. This suggested that the chelating reaction is very important for the LER process because pH affects the chelating reaction. As shown in Figure 2, citrate buffer and phosphate buffer showed linear relationships with different slopes. Citrate produces a chelating effect and removes divalent cations from LPS. Phosphate is not a chelating agent but competitively removes divalent cations from LPS. Therefore, citrate is more effective in removing divalent cations from LPS. The difference between the slopes may be caused by the difference in the strength of the agents in divalent cation removal from LPS.
The salt concentrations also showed a linear relationship with the logarithm of the half-life of RSE activity in LER solutions (Figure 3). Higher salt concentrations increased the half-life of RSE activity. Biopharmaceutical products usually contain saline, which can provide them less LER effect than water-based products.
For citrate and polysorbate 20, the half-life of RSE activity in LER solutions was similar at the concentrations commonly used (Figures 4 and 5). Even though longer half-life was observed at the concentrations lower than that commonly used, these concentrations may not be relevant for the biopharmaceutical formulations. The difference in the effects of the concentrations was observed between citrate and phosphate (Figure 4). The phosphate effect on LER was concentration-dependent in the range commonly used, and it was weaker than that of citrate. The difference may be caused by the difference in the strength of the agents in divalent cation removal from LPS, as mentioned above.
Because the Arrhenius plots for RSE and NOE (Figure 6) showed linearity, both were considered to be temperature-dependent chemical reactions. Activation energy can be calculated from a slope of the Arrhenius plot, and it is the minimum amount of energy required for a reaction. Activation energy obtained with RSE was lower than that with NOE. Bolden et al. reported that NOE in samples containing citrate and polysorbate maintained activity in the BET, the rabbit pyrogen test, and the monocyte activation test after 24 h at 2–8 °C, although RSE activity was lost under the same condition (18, 22). Dubczak (23) reported that NOE, in which activity was stable at 2–8 °C, lost activity in both the BET and the rabbit pyrogen test after incubation at 37 °C for 48 h. This indicates that NOE is not completely resistant to LER and that its activity can be decreased if enough energy was provided. The difference in stability at 2–8 °C between RSE and NOE can be explained by the difference in the activation energy.
The BET and the rabbit pyrogen test are bioactivity assays, and the physical concentrations of LPS, are not determined by these methods. Therefore, we cannot determine the physical weight of LPS in the samples using the BET, based on the LAL test. We know the potency of RSE or CSE expressed in endotoxin units per nanogram (EU/ng), but do not know the potency of contaminated endotoxin in samples. We can only know the endotoxin activity in the sample. We determined that there is an LPS aggregation state in which potency is very low under the LER conditions. Because the biological activity and clinical risks of the undetectable LPS under LER conditions are unknown, further studies are necessary. This subject is different from the target in the BET that measures only endotoxin activity in products. Therefore, LER issue is not the BET issue, and it is a new matter to be investigated. Considering that LER is a change in potency of RSE or CSE and does not reflect the stability of contaminated endotoxin in products, the current design for hold-time studies using purified LPS may not be suitable. Use of LER-resistant NOE may be a rational way to avoid the LER issue. Understanding the LER mechanisms is important for future investigations. Therefore, information on the kinetically analyzed factors affecting LER will be helpful.
In conclusion, LER is considered to be a temperature-dependent chemical reaction affected by pH, salt concentrations, and components of LER matrices. Because the half-life of RSE activity in LER solutions showed linear relationships with temperature, pH, and salt concentration, information on the half-life is useful to anticipate the LER effect in pharmaceutical products. Lower temperature, lower pH, and higher salt concentrations are recommended to avoid LER.
Conflict of Interest Declaration
Dr. Masakazu Tsuchiya is a senior research scientist at Charles River Laboratories, which manufactures LAL. No other competing financial interests exist.
Acknowledgments
The author is grateful to Dr. Jack Levin, Dr. James F. Cooper, and Dr. Norman R. Wainwright for helpful suggestions and for editing the manuscript, and thanks John Dubczak for providing his NOE preparation.
- © PDA, Inc. 2017


