
Abstract
USP <1207.1> Section 3.5 states that “A deterministic leak test method having the ability to detect leaks at the product's maximum allowable leakage limit is preferred when establishing the inherent integrity of a container-closure system.” Ideally, container closure integrity of parenteral packaging would be evaluated by measuring a physical property that is sensitive to the presence of any package defect that breaches package integrity by increasing its leakage above its maximum allowable leakage limit. The primary goals of the work presented herein were to demonstrate the viability of the nondestructive, deterministic method known as laser-based gas headspace analysis for evaluating container closure integrity and to provide a physical model for predicting leak rates for a variety of container volumes, headspace conditions, and defect sizes. The results demonstrate that laser-based headspace analysis provides sensitive, accurate, and reproducible measurements of the gas ingress into glass vial-stopper package assemblies that are under either diffusive or effusive leak conditions. Two different types of positive controls were examined. First, laser-drilled micro-holes in thin metal disks that were crimped on top of 15R glass vials served as positive controls with a well-characterized defect geometry. For these, a strong correlation was observed between the measured ingress parameter and the size of the defect for both diffusive and effusive conditions. Second, laser-drilled holes in the wall of glass vials served as controls that more closely simulate real-world defects. Due to their complex defect geometries, their diffusive and effusive ingress parameters did not necessarily correlate; this is an important observation that has significant implications for standardizing the characterization of container defects. Regardless, laser-based headspace analysis could readily differentiate positive and negative controls for all leak conditions, and the results provide a guide for method development of container closure integrity tests.
LAY ABSTRACT: The new USP 39 <1207>, “Package Integrity Evaluation—Sterile Products”, states in section 3.4.1: “tracer gas tests performed using … laser-based gas headspace analysis [have] been shown to be sensitive enough to quantitatively analyze leakage through the smallest leak paths found to pose the smallest chance of liquid leakage or microbial ingress in rigid packaging.” In addition, USP <1207> also states that “for such methods, the limit of detection can be mathematically predicted on the basis of gas flow kinetics.” Using the above statements as a foundation, this paper presents a theoretical basis for predicting the gas ingress through well-defined defects in product vials sealed under a variety of headspace conditions. These calculated predictions were experimentally validated by comparing them to measurements of changes in the headspace oxygen content or total pressure for several different positive controls using laser-based headspace analysis. The results demonstrated that laser-based headspace analysis can, by readily differentiating between negative controls and positive controls with a range of defect sizes on the micron scale, be used to assess container closure integrity. The work also demontrated that caution must be used when attempting to correlate a leak rate to an idealized defect-size parameter.
- Container closure integrity
- USP 39 Chapter <1207>
- USP 1207
- Sterility
- Gas leak rate
- Gas ingress
- Headspace analysis
- Frequency modulation spectroscopy
Introduction
One of the primary purposes of parenteral packaging is to maintain the sterility of the pharmaceutical product. However, package integrity is not defined as the absence of microbial or liquid ingress or product sterility. Instead, it is a more stringent definition. Package integrity is the absence of package defects that could risk product quality by allowing contaminant ingress and/or product loss, recognizing that microbial ingress is inherently a probabilistic event.
The recent updates to USP <1207> include descriptions of several deterministic analytical methods that provide for more quantitative analysis of package integrity (1). USP <1207.1> Section 3.5 states that “A deterministic leak test method having the ability to detect leaks at the product's maximum allowable leakage limit [MALL] is preferred when establishing the inherent integrity of a container-closure system.” Another key aspect of the updated USP chapter is that validation of deterministic leak test methods to detect a critical leak does not require a correlation to microbial ingress, an inherently probablistic test method.
By definition, a deterministic leak test method measures a physicochemical property that is sensitive to the presence of any defect (or leak path) that breaches package integrity—also known as container closure integrity (CCI)—and, thereby, generates the potential for leakage. Leakage, in turn, is defined as a measure of the rate of flow (mass or volume units) that passes through a leak path under specified temperature and pressure conditions. Generally speaking, the smallest leaks allow only gas flow, while larger leaks also allow liquid flow and even larger leaks may also allow microbial ingress.
Gas flow that occurs in the absence of a total pressure gradient is defined as diffusive; flow that occurs in the presence of a total pressure gradient is defined as effusive. Because these two flow types are driven by different physical forces, the flow rates associated with them are very different for a given leak path. Diffusive flow can be visualized as a mixing of two gas reservoirs of equal pressure but different concentrations separated by an open channel; leaks occurring in a container that is packaged with a 1 atm headspace represents an example. Effusive flow can be visualized as forced movement of gas from a high-pressure region to a low-pressure region; atmospheric air passing through a defect into a lyophilized product stoppered under vacuum represents an example. Permeation, in contrast, represents the flow of gas through the material itself and is a function of both the physical properties of the gas molecule and the material it passes through.
All packages have inherent leak rates, even if well-assembled with no defects. For sterile product packages these leaks occur via physical paths between the mechanically fitted components or the physicochemically bonded glass or plastic materials. For the purposes of this discussion and to be consistent with USP <1207> we will not define permeation through the polymeric components and glass as a leak. Leakages greater than the inherent ingress rate can occur if the package is poorly assembled and/or there are component defects.
The critical leak rate is the MALL, above which either the microbiological or physicochemical quality of the product is put at risk (2). The MALL for a particular product-package system is established by evaluating the risk profile of the product with respect to contaminant (e.g., microbial, oxygen) ingress. If a package leaks at a rate above the MALL, then the product is at risk for loss of sterility and/or required physicochemical quality specifications (e.g., potency).
Over the past three decades, a number of investigators have developed different methodologies with the goal of determining the critical leak rate, or MALL, above which the probability of microbial ingress poses an unacceptable risk. These works are associated with specific packaging, defect types, and microbial loads (3). These initial efforts correlated microbial ingress with both liquid and gas flow through a wide variety of defect models, from compression seals (4, 5), to micropipettes inserted through a vial glass wall (6⇓–8), to microtubes inserted through stoppers (9, 10), to metal discs with a micro-hole and a thin wire inserted between the stopper and vial (11). This large body of work by these different investigators demonstrated that microbial ingress requires liquid flow and that liquid flow can only occur if gas ingress can occur through the defect. Further, the probability of microbial ingress is proportional to both the defect geometry and the microbial loading. Under extremely high microbial loads (6⇓–8), the risk of microbial ingress was determined to be <0.10 at an effusive helium leak rate between 10−5.0 and 10−5.8 std cm3/s, corresponding to a defect diameter of 0.2 to 0.3 μm. However, under an aerosolized bacterial challenge—a microbial load more likely to be found during shelf-life storage of sterile products—the microbial ingress limit was established as being 2 μm (10), corresponding to an effusive helium leak rate of roughly 10−3.1 std cm3/s (6). These results suggested, therefore, that instead of trying to quantify the probabilistic microbial ingress event, the research should focus on evaluating the ability of a leak test to detect defects that could allow microbial contamination through the use of physical and deterministic methods that can detect specific defect sizes and gas flow rates.
With this in mind, Guazzo and coworkers followed up on previous work using a vacuum decay method (12) to develop and validate a CCI test for glass syringes (13) and lyophilized products in vial/stopper packaging (14). For each package assembly, the technique is optimized for a targeted limit of detection (LOD) that is dependent upon many factors, including the volatility of the package materials, package flexibility, the instrument used, test time allotted, and the package size. Typically, a LOD of 2–5 μm defect diameter can be achieved using a lab-scale instrument.
Along a similar vein, Li and coworkers developed a mass extraction system to evaluate CCI for a variety of container closure systems (15). Employing micropipettes, laser-drilled holes, and thin wires to generate defects with various morphologies, they demonstrated that their mass extraction system was able to reliably and robustly differentiate between negative controls and postive controls with 2 μm defects.
At this point, it is important to note that the gas leak rate correlations done by both the Kirsch and Morrical teams have the fundamental restriction that their helium leak rates were measured at a constant 1 atm pressure differential. Similarly, both the vacuum decay leak test used by the Guazzo team and the mass extraction system used by the Li team also involved applying a 1 atm pressure differential across the vial package at the time of measurement. Though vacuum decay leak tests can be designed to use pressure differentials of less than 1 atm, both of these methodologies require a total pressure differential and, therefore, create effusive flow conditions. Yet this applied constant total pressure differential does not represent the conditions that pharmaceutical products typically endure. Instead, many are packaged with headspace pressures such that diffusive flow will represent the primary ingress mode for gas leaks caused by defects. Regardless, because the physical forces behind effusive and diffusive flow are very different, the gas ingress rates associated with effusive flow conditions can be used to determine that a defect exists but cannot be used to predict the gas ingress rate associated with the typical storage condition of the package assembly.
In other words, caution must be used when characterizing a package defect by a particular leak rate or idealized defect geometry because that leak rate is very dependent upon both (1) the differential pressure between the interior and exterior of the package and (2) the complexity of the defect geometry itself. Furthermore, a distinction should be made between measuring the natural leak rate of a package under typical storage conditions versus the detection of a leak defect by the artificial application of a pressure differential to increase the gas flow through the defect. The choice of measurement approach depends on the objective of the measurement: (1) determining the fundamental barrier characteristics of the package, or (2) identifying the defective containers from integral ones. These two objectives could require different test methods.
Regardless of the objective or method conditions, the accumulated gas flow into or out of the headspace for a parenteral package can be readily determined via the nondestructive deterministic method known as laser-based gas headspace analysis. Headspace gas analyzers employ tunable diode laser absorption spectroscopy (TDLAS) to provide rapid and noninvasive gas analysis of the headspace within sealed containers (3, 16⇓⇓–19). This optical technique can measure a number of physical parameters within the headspace of a container, including specific gas number density and total headspace pressure. By observing over time the change in the physical properties of the headspace, the gas ingress rate can be quantified; by increasing the time between the initial and final measurements, there is no lower limit to the ingress rate that can be measured.
The laser-based headspace analysis methodology provides the unique advantage of measuring the gas ingress rate for a pharmaceutical container under its nominal storage conditions, regardless of whether it is packaged at full vacuum (some lyophilized blood products), partial vacuum (most other lyophilized products), or no vacuum (some lyophilized and most liquid products). Furthermore, by simply measuring the change in the headspace content caused by gas ingress, this avoids attempting to correlate ingress rates obtained under specific pressure gradients with complex defect geometries.
The goal of the work presented herein was fourfold. First, demonstrate that the deterministic method known as laser-based gas headspace analysis provides sensitive, accurate, and reproducible measurements of the gas ingress into glass vial-stopper package assemblies. Second, demonstrate that the measured gas ingress, under both diffusive and effusive conditions, is correlated with the cross-sectional area of the defect. Third, demonstrate that the correlation between the diffusive and effusive ingress for a particular defect depends upon geometric details beyond just its cross-sectional area. Fourth, validate that mathematical models, based upon gas and fluid flow dynamics, can accurately predict the time-dependent rate of gas ingress under either diffusive or effusive conditions. These mathematical models are particularly useful for predicting leak rates for a wide range of package types, packaging conditions, and defect types as part of developing leak detection strategies. As part of this effort, two different vial assemblies were used to simulate package defects. Glass vials that were sealed with crimped metal discs that had laser-drilled micro-holes were used as defect standards with a well-defined geometry. Glass vials that were sealed with a traditional crimped stopper, but that had laser-drilled defects in their glass wall, represented packages with defects that have complex geometries that more closely mimic those that occur during production and processing. Taken together, these results provide a foundation for guiding method development and validation for CCI test methods using laser-based headspace analysis.
Materials and Methods
Glass Vials Capped with Metal Disc That Has a Micro-Hole
Materials:
All of the glass vials used during this part of the study were ISO 15R Schott clear Type 1 tubing glass vials (Adelphi; Part# VCDIN15R) with a total headspace volume of 18.8 mL. Multipurpose Buna-N O-rings with a 14 mm ID and a 3.5 mm diameter thickness (McMaster-Carr; Part# 9262K786) were used to provide the seal between the metal disc (described below) and the glass vial. The aluminum crimping caps used were West 20 mm “TruEdge” flip-off seals (Adelphi; Part#FOT20W).
The metal discs, purchased from Potomac Photonics (Baltimore, MD), were nominally 19 mm in diameter, with a tolerance of ±50 μm, 50.0 μm (0.002 in) in thickness, and were fabricated from tantalum. Ten discs were obtained for each of three micro-hole sizes (5, 10, and 15 μm in diameter). As stated in the accompanying Certificate of Conformance, the tolerance for each of the micro-holes was ±2 μm. An additional 10 discs were obtained with no holes to serve as the negative controls.
Potomac Photonics optically measured the actual micro-hole diameter in each of the metal discs by combining a 50× objective and a 10× eye piece on a Nikon microscope to achieve a 500× total magnification. The measurements were made through the microscope using the calibrated stages on a Quadra-Chek 200 system that is attached to the microscope. With this configuration, the measurements of the micro-hole diameter have a 0.1 μm resolution. The microscope and stages are calibrated yearly using a Max Levy NIST-traceable standard as part of their ISO 9001 procedures. Images for each disc with a micro-hole were acquired from a camera attached to the microscope, examples of which are displayed in Figure 1. The measured diameters for the micro-holes are listed in Table IV.

(A) A schematic of the assembly of the model standards fabricated with a metal disc. Images at 500× magnification of tantalum metal discs that were laser-drilled by Potomac Photonics to create a (B) 5 μm, (C) 10 μm, or (D) 15 μm hole.
Sample Preparation—Diffusion Experiments:
Ten sample vials were assembled for each defect size. The positive control samples were all purged with nitrogen to 0% oxygen and diffusion of oxygen through the defects was measured as a function of time. Each laser-drilled metal disc, uniquely identified, was placed on the inside of an upturned aluminum crimping cap. A light coating of vacuum grease was applied to a Buna-N O-ring and inserted into the crimping cap, pinning the metal disc. These crimp cap assemblies and their corresponding glass vials were placed inside a glove box (CleaTech; Model# 2200-2-A) that was then sealed and purged with dry nitrogen gas to remove all oxygen. After placing a crimp cap assembly on its corresponding sample vial, the plastic flip-off cap was removed before sealing the vial with a hand-held crimper (Kebby Industries; Part# 20002-00-C04A). The flip-off cap was removed so that the micro-hole in the metal disc was directly exposed to the ambient air when the samples were removed from the glove box. Furthermore, because it was observed that the crimping can generate a slight circular indentation at the center of the metal disc by compressing the underside of the flip cap base onto it, the crimping was done after removing the flip cap. As schematically illustrated in Figure 1.A, the compression of the crimping created the seal between the metal disc and the glass vial via the Buna-N O-ring.
To provide the zero time point, headspace oxygen measurements were made immediately upon removing the sample vials from the glove box. Between measurements, the vial samples were stored in ambient air at room temperature. Using a variable schedule that was dependent upon the ingress rate, each sample was then repeatedly measured until its headspace content contained greater than 75% of ambient atmospheric oxygen.
For the replicate measurement sets for each of the three micro-hole groups, the 10 sample vials for a particular group were placed inside a custom pressure bucket. After a vacuum was applied to induce effusive egress of the vial headspace gas through the micro-hole and create a vacuum inside the vial, dry nitrogen at 1 atm absolute was then slowly introduced into the pressure bucket so that the sample vials were refilled with 1 atm of pure nitrogen for additional diffusive measurements.
Sample Preparation—Effusion Experiments:
For the effusion measurements, the same vial assemblies as fabricated for the diffusive measurements were again used to facilitate comparisons to the diffusive results. Each individual vial was placed in the sample chamber of a Lighthouse FMS-1400 headspace pressure analyzer and reiterative measurements were acquired at a one/min rate. A vacuum pump (CPS Products; Model# VPC2SU) assembly, terminating in a silicon vacuum cup (McMaster-Carr; Cat# 3766A77), was used to evacuate the air inside the vial through the micro-hole on the metal disc. Once the total pressure inside the sample vial reached about 10 torr, the pump assembly was removed and the increase in the total pressure of the vial headspace was recorded until it reached ambient atmospheric pressure.
Stoppered Glass Vials with Laser-Drilled Holes
Materials:
All of the glass vials used during this part of the study were ISO 15R Schott clear Type 1 tubing glass vials (Adelphi; Part# VCDIN15R) with a total headspace volume of 18.8 mL. The stoppers used for the controls, Potomac and Oxford sample sets (see below) were 20 mm West “igloo” lyo stoppers fabricated from 4023.50 gray bromobutyl rubber (Adelphi; Part# FDW20RtS). The stoppers used for the Lenox sample set were 20 mm two-leg stoppers fabricated from gray bromobutyl rubber from internal lab stock. The aluminum crimping caps used were West 20 mm TruEdge flip-off seals (Adelphi; Part#FOT20W).
The glass vials were shipped to three different companies (Lenox Laser, Potomac Photonics and Oxford Lasers) to create laser-drilled holes that would serve as positive controls (see Table I). The Lenox Laser (Glen Arm, MD; www.lenoxlaser.com) sample set consisted of 18 laser-drilled vials with nominal defect diameters of 2 μm (five vials), 5 μm (four vials), 10 μm (four vials), and 15 μm (five vials), each with a tolerance of ±1 μm. A Certificate of Calibration that is issued with each laser-drilled vial reports both a flow effective diameter and an effusive calibrated flow rate. These two parameters are obtained by using a standardized flow calibration apparatus that measures, as a function of time, the volume of air that passes through the defect when a 1 atm pressure gradient is applied across it.
Summary of Laser-Drilled Vials
The Potomac Photonics (Baltimore, MD; www.potomac-laser.com) sample set consisted of 30 laser-drilled glass vials with nominal defect diameters of 5 μm (10 vials), 10 μm (10 vials), and 15 μm (10 vials), each with a tolerance of ±2 μm. Rather than perform a flow rate test on each vial, Potomac associates a defect size with the specific parameters of the laser-drilling protocol (e.g., laser power). This association is determined by laser-drilling into test vials that are then cut in half so that the defect on the inside glass surface can be optically measured.
The Oxford Lasers (Didcot, Oxfordshire, UK; www.oxfordlasers.com) sample set consisted of 11 laser-drilled glass vials with nominal defect diameters of 5 μm with a tolerance of ±2 μm. Oxford employs an optical measurement technique similar to the Potomac method to determine laser settings that will generate defects of a particular size.
Sample Preparation:
Positive and negative controls were prepared by first purging the vials with dry nitrogen gas to remove all oxygen and then stoppering and crimp-sealing them. Laser-drilled defects were covered with a rubber septum to minimize any diffusion prior to measurements being made. The septum mask was then removed from each sample shortly before its first measurement, acquired as described in the FMS Headspace Analysis section below. Between measurements, the vial samples were stored in ambient air at room temperature. Using a variable schedule that was dependent upon the ingress rate, each sample was then repeatedly measured until its headspace content contained greater than 75% of ambient atmospheric oxygen.
FMS Headspace Analysis
Headspace Oxygen Measurements:
Headspace oxygen measurements were performed using a validated Lighthouse Instruments FMS-760 Headspace Oxygen Analyzer (Lighthouse Instruments; Charlottesville, VA, USA). The measurements presented in this study were acquired following standard operating procedures developed by Lighthouse Instruments. Briefly, the instrument was turned on and allowed to warm up for at least 30 min with a nitrogen purge rate of 4 standard L/min prior to the measurement session. Calibration was then performed using flame-sealed 20% and 0% oxygen standards that were fabricated with National Institute of Standards and Technology (NIST) traceable gas mixtures by Lighthouse Instruments.
Prior to each measurement session, six oxygen standards with known oxygen concentrations were each measured to verify the instrument calibration and performance (see Table II and Figure 2.A). These oxygen standards were also fabricated with NIST-traceable gas mixtures at Lighthouse Instruments from the same 15R vial format as was used for all the samples presented herein. Based upon the absolute value of the measurement error (the difference between the known and measured values, or measurement accuracy) and the measurement precision (the standard deviation of multiple measurements for each standard), the headspace oxygen concentration measurement uncertainty is established; for the 15R vial format, the oxygen concentration measurement uncertainty was typically about ±0.2% and ±0.3% atm after acquiring, respectively, ten and five replicate measurements.

(A) Plot of measured oxygen concentration versus actual oxygen concentration for the Lighthouse oxygen standards listed in Table II. A linear fit of the data confirms the linearity of the system response over oxygen concentrations ranging from 0% to 20% atm (linear fit coefficient R2 > 0.999). (B) Plot of measured total pressure versus actual total pressure for the Lighthouse pressure standards listed in Table III. Linear fits of the pressure and moisture data confirm the linearity of the system response over total pressures ranging from 0 to 700 torr (linear fit coefficient R2 > 0.999).
Representative Calibration Results Based upon 10 Measurements of Each Standard
For the measurements presented herein, the oxygen concentration was measured 10 consecutive times for each sample at each time point for the metal disc standards and five consecutive times for the laser-drilled controls, with the mean being taken as the representative measurement value for that sample at that time point.
Headspace Pressure Measurements:
Headspace pressure measurements were performed using a validated Lighthouse Instruments FMS-1400 Headspace Moisture/Pressure Analyzer. The measurements presented in this study were acquired following standard operating procedures as detailed by Lighthouse Instruments. Briefly, the instrument was turned on and allowed to warm up, with a nitrogen purge of at least 1 standard L/min, for at least 30 min prior to the measurement session. Calibration was then performed with known pressure standards manufactured by Lighthouse Instruments.
Prior to sample analysis, eight pressure standards at known total pressures were each measured 10 consecutive times to verify performance of the instrument (see Table III and Figure 2.B). These pressure standards were also fabricated with NIST-traceable gas mixtures at Lighthouse Instruments from the same 15R vial format as was used for all the samples presented herein. Based upon the absolute value of the measurement error (the difference between the known and measured value, or measurement accuracy) and the measurement precision (the standard deviation of multiple measurements for each standard), the headspace total pressure measurement uncertainty is established; for the 15R vial formats used in this study, the total pressure measurement uncertainty was typically determined as the larger of either ±5 torr absolute or ±5% of the measured value.
Representative Calibration Results Based upon 10 Measurements of Each Standard
For the effusion measurements, the FMS-1400 instrument acquired data in the reiterative mode that was set to take a measurement once every 1 or 2 min, depending upon the time scale of the experiment defined by the nominal defect diameter.
Theoretical Background
Diffusion
Molecular gas ingress into a container via diffusion occurs when the total pressure difference between the outside and inside of the container is zero, but the partial pressure (i.e., concentration) of the diffusing molecule is different. Furthermore, it is assumed that (1) the length of the defect is greater than the effective diameter of the defect and (2) the diameter of the defect is greater than the mean free path of the gas molecules at the defect.
Fick's first law relates the diffusive flux J→ [molecules/m2/s] to the concentration under the assumption of steady-state conditions. It postulates that the flux goes from regions of high concentration to regions of low concentration, with a magnitude that is proportional to the concentration gradient (spatial derivative):
 where D (cm2/s) represents the diffusion coefficient and n represents the molar concentration (mol/m3). Consider the situation of diffusion into a container of volume V along one direction through a defect hole with a cross-sectional area of A0 in the container wall. Oriented such that the wall thickness is along the z axis and using eq 1, the number of molecules N of species i that pass through the hole can be expressed as:
 Using the ideal gas law, eq 2 can be expressed in terms of pressure as follows:
 where Pi_in(t) represents the partial pressure of species i inside the container and Pi(z, t) represents the partial pressure of species i along the z axis. If the partial pressure of species i changes linearly from the ambient outside partial pressure Pi_out to the partial pressure of species i inside the container Pi_in(t), then:
 where L represents the length of the defect. Note that the length of the defect may be signicantly different from the thickness of the container wall; defects typically will have uneven geometries, with the narrowest region representing the rate-limiting section. Inserting eq 4 into eq 3 and then integrating gives the following:
 where Pi_ini represents the initial partial pressure of species i (Pi_ini = Pi_in(0)).
For experimental conditions such that the initial container headspace has no oxygen (Pi_ini = 0) and the outside environment is nominal air (i.e., oxygen content of Pi_out = 20.9%), this expression can be rewritten in terms of the percent of oxygen as:
 with
with
 where Poxygen(t) represents the partial pressure of oxygen inside the container at time t, Ptotal_out represents the total pressure of the ambient atmosphere, and αDiff represents the diffusion parameter.
For an ideal gas, the diffusion coefficient D can be calculated from the mean free path and average velocity associated with the Maxwell-Boltzmann distribution and obeys the following pressure and temperature dependency:
 where T and P represent, respectively, the absolute temperature and total pressure of the system (20, 21). For oxygen diffusing through air at standard temperature and pressure conditions (T = 295 K and P = 1 atm), D = 0.21 cm2/s (20, 21).
Effusion
Effusive flow occurs when there is a total pressure difference as well as a partial pressure difference between the outside and inside of a container. The mathematical description of effusive flow is complex and highly dependent upon the total pressure of the effusant. Using kinetic theory and treating the effusant as hard spheres, the pressure of a molecule can be related to a mean free path λ (or distance a molecule travels before it collides with another molecule):
 where d represents the diameter of the molecule, n again represents its concentration (mol/m3), and kB is the Boltzmann constant. For gaseous air at room temperature, the mean free path can be expressed simply as:
 where an effective cross-section diameter of d = 3.57 × 10⁻¹⁰m is used for air.
For conditions in which the mean free path of the effusant is greater than the effective diameter of the defect (e.g., products packaged under deep vacuum), molecular kinetics can be used to model the flow rate; this regime is typically referred to as molecular flow, or Knudsen flow. Using kinetic theory to calculate the normalized collision rate of a molecule against a defect with a cross-sectional area A0, the total headspace pressure change can be expressed as follows:
 with
with
 where αMF represents the gas effusion parameter due to molecular flow, V represents the container volume, R represents the ideal gas constant, and M represents the molar mass (g/mol) of the effusing molecule (19). By setting the mean free path equal to a defect diameter of 1 μm, eq 10 reveals that the maximum pressure for the molecular flow regime corresponds to a total pressure of about 50 torr (0.06 atm) for air at room temperature. This suggests that at room temperature, effusive flow can be modeled with a simple exponential only when the total pressure is below 50 torr.
When the mean free path of the effusant is much less than the characteristic dimension of the defect, as it is for pharmaceutical packages stoppered at pressures above ∼100 torr with micron-sized or larger defects, fluid dynamics must be applied to model the flow rate. Traditionally, laminar flow of a compressible fluid through a capillary of length L and radius r has been used to model this regime, with the Hagen-Poiseuille equation providing the solution for the volumetric flow rate Φ (22, 23):
 where η represents the dynamic viscosity [Pa · s] of the fluid (or gas), P1 represents the upstream (inlet) pressure, and P2 represents the downstream (outlet) pressure. To determine the behavior of the pressure as a function of time for the conditions in which gas is ingressing into a container of volume V, eq 12 can be expressed as follows:
 where P0 represents the constant ambient atmospheric pressure and P(t) represents the changing pressure on the inside of the container. Assuming a constant volume for the container and that the initial pressure inside the container at t = 0 is 0, eq 13 can be expressed as:
 Treating the dynamic viscosity, η, of the ingressing gas as a constant under these conditions (24), then a closed solution to eq 14 can be found:

 where αEff represents the effusion parameter of the gas ingressing into the container.
Results and Discussion
The primary goal of this work was to demonstrate the viability of laser-based gas headspace analysis as a means of evaluating CCI and to provide a physical model for predicting leak rates for a variety of container volumes, headspace conditions, and defect sizes. To do this, two different types of positive controls were examined under both diffusive and effusive conditions. The first set of positive controls was fabricated by sealing intact glass vials with metal discs that contained micro-holes (see the Materials and Methods section). The defect geometry associated with the micro-holes drilled into a thin metal disc is relatively uniform (i.e., circular) with small tolerances and, thus, more easily modeled. The representative images displayed in Figure 1 support this supposition. Establishing that these positive controls have relatively idealized defects is of paramount importance in both (1) subsequently evaluating the fundamental sensitivity, accuracy, and reproducibility of the analysis technique itself and (2) verifying the validity of the mathematical models used to predict the time-dependent leak rates.
Diffusive Flow-Through Defects
Figure 3 displays representative examples of three positive controls and a negative control for sample vials sealed with a 50 μm thick metal disc. Each metal disc for the three sets of positive controls contains a laser-drilled micro-hole of either 5, 10, or 15 μm. As described in full in the Materials and Methods section, each vial was flushed with dry nitrogen and stoppered with 0% oxygen at 1 atm of total pressure. The graph shows the change of the measured concentration of oxygen found in the vial headspace as a function of time (days), with the initial vial headspace pressure matching the ambient atmosphere. The data show clearly that the diffusive rate of oxygen ingress into the vial headspace is dependent upon the size of the defect (i.e., the micro-hole diameter). To describe the ingress behavior for a particular vial with a single parameter, the physical model of the ingress process can be used to define the diffusion parameter, αDiff. Applying the diffusion model as presented in eq 6, the resulting least-squares fits are overlaid on top of the data in Figure 3 as solid lines and clearly demonstrate that the change of oxygen in the vial headspace is a natural exponential function of time. These ingress parameters and their associated coefficient of determination (RSQ) are listed in Table IV.

The change in the headspace oxygen content for representative examples of three positive controls and a negative control for sample vials sealed with a 50 μm thick metal disc. The results were obtained under diffusive pressure conditions and the metal discs for the positive controls contain a laser-drilled micro-hole of 5, 10, or 15 μm. The graph displays the change of the partial pressure of oxygen found in the vial headspace as a function of time. The least-squares curvefit of the data, based upon eq 6, is illustrated by the corresponding solid line; the exponential coefficient of the fit represents the gas ingress paratmeter, αDiff.
Summary of Parameters Associated with the Model Sample Vials Sealed with a Metal Disc Containing a Laser-Drilled Micro-Hole
Figure 4 contains a summary of the calculated diffusion parameter αDiff as determined from measuring the headspace oxygen partial pressure of the sample vials capped with the metal disc. Each data point represents the measured diffusion parameter for a different metal disc. The diffusion parameters, αDiff, are plotted as a function of the idealized (i.e., assumes defect is a perfect circle) defect area that is calculated from the diameter measured by the manufacturer via an independent optical technique (see the Materials and Methods section). The data for the first set of measurements of the positive controls are contained in Table IV.

Each data point represents the measured diffusion parameter for a different metal disc. The metal discs were obtained with three nominal diameters, 5, 10, and 15 μm. The diffusion parameter, αDiff, as determined by measuring the headspace oxygen partial pressure, is plotted as a function of the idealized defect area A0, as calculated from the diameter measured by the manufacturer via an independent optical technique. The dotted lines represent the theoretical diffusion parameter, αDiff, for the labeled defect lengths, L, as calculated from eq 7.
There are three main items to note from these results for the model vials capped with a metal disc. First, there is a strong correlation between the diffusion parameter αDiff and the idealized defect area associated with the micro-hole in the metal disc. Second, as illustrated by the linearity of the fits (see Table IV), the FMS oxygen measurements are very precise and robust. Recall that the data points in each ingress curve (see Figure 3) represent measurements that were each acquired (1) with a different instrument calibration and (2) were spread over multiple days.
Third, as seen by the replicate measurements that are displayed in Figure 4, the observed diffusion parameters are very reproducible. To assess the reproducibility of the measurement, the diffusion parameter determined from the first measurement set was treated as the internal reference point for each vial; a diffusion parameter error can then be assigned to each subsequent set of replicant measurements acquired for a given vial. Treating all the positive controls capped with a metal disc as a single group, the calculated diffusive parameter error for the replicate measurements had a mean of 6.0 × 10⁻⁸ ± 1.2 × 10⁻⁶ (cm3/s). With the mean being close to zero, it suggests that the experimental protocol of subjecting the metal discs to a ∼1 atm pressure differential to refill the vials with 1 atm of pure nitrogen for the subsequent replicate diffusion measurements did not significantly alter the structure of the laser-drilled micro-hole. The standard deviation of 1.2 × 10⁻⁶ cm3/s indicates that the diffusion parameters calculated from the replicate measurements varied less than 6.5% for the 5 μm positive controls and less than 2% for the 10 and 15 μm positive controls.
Figure 4 also displays diagonals representing the dependency of the theoretical ingress parameter on the defect length as a function of defect area (see eq 7). The fact that the experimentally observed diffusion parameters αDiff do not lie along the straight line corresponding to the idealized 50 μm hole length (recall that the metal discs had a thickness of approximately 50 μm) suggests that effects generated by the defect edges have a significant impact on the observed diffusion parameter. These effects most likely reflect, in part, the tapered (or conical) cross-sectional profile of the defect generated by the laser-drilling process and the jagged, irregular edges (see Figure 1). Not surprisingly, note that as the defect size becomes smaller, these edge effects become more prominent.
A micro-hole in a metal disc is an idealized defect and useful, as demostrated here, for assessing the ability of laser headspace analysis to detect defects and the sensitivity and reproducibility of the measurement technique. The next part of the investigation examined the diffusion parameter, αDiff, for the second set of positive controls, stoppered vials with a laser-drilled hole in their glass wall. Note that, in contrast to the micro-holes drilled into a thin metal disc, the defect geometry associated with laser-drilled holes in glass is quite complex and, thereby, more closely simulates real-world defects found in pharmaceutical packages.
As detailed in the Materials and Methods section, 15R Schott clear Type 1 tubing glass vials were shipped to three different companies (Lenox Laser, Potomac Photonics, and Oxford Lasers) to create laser-drilled holes that would serve as positive controls (see Table I). The measurements and analysis were conducted in a manner similar to that described previously for the positive controls sealed with the metal discs with a laser-drilled micro-hole. Displayed in Figure 5 and Tables V⇓–VII, the results illustrate four important observations. First, noting the ordinate scale differences between the plots, the oxygen diffusion through the laser-drilled defects, as depicted by the diffusion parameter, differs by almost 10-fold between the three different manufacturers. Using the 5 μm nominal diameter as an example, the mean diffusion parameter, αDiff, varied from 7.6 × 10⁻⁵ cm3/s for Lenox, 2.0 × 10⁻⁵ cm3/s for Oxford, and 3.0 × 10⁻⁶ cm3/s for Potomac.

A summary for the stoppered sample vials of their diffusion parameter, αDiff, as a function of the idealized defect area, A0. Positive controls with a laser-drilled hole in their glass wall are displayed from (A) Lenox, (B) Oxford, and (C) Potomac. The defect diameter for the holes drilled by Lenox are determined via a calibrated effusive flow rate. Because the defect diameters for the holes drilled by Oxford and Potomac are not measured, the idealized area is based upon the nominal defect diameter. The results displayed in (D) are for negative controls that did not have a laser-drilled hole, but were stoppered in the same manner.
Summary of Parameters Associated with the Model Sample Vials Sealed with a Crimped Stopper-Cap Assembly and Containing a Lenox Laser-Drilled Micro-Hole in the Glass Wall
Summary of Parameters Associated with the Model Sample Vials Sealed with a Crimped Stopper-Cap Assembly and Containing a Potomac Laser-Drilled Micro-Hole in the Glass Wall
Summary of Parameters Associated with the Model Sample Vials Sealed with a Crimped Stopper-Cap Assembly and Containing an Oxford Laser-Drilled Micro-Hole in the Glass Wall
Second, there are significant reproducibility issues even for vials obtained from the same manufacturer. This can be observed in both the spread of the measured diffusion parameters and the presence of vials that did not exhibit significant oxygen ingress, suggesting that the defect had become obstructed.
Third, as listed in Tables V⇑–VII, the quality of the data is quite good, with RSQs usually better than 0.999. There were two Potomac vials (P10-09 and P15-09) and one Oxford vial (O05-07) that essentially failed as positive controls because they did not exhibit any significant change in their headspace oxygen content. It is worth noting that both of these manufacturers only check the nominal defect size on representative samples, not on the actual samples that are provided to the customer. Thus the failures observed for the Potomac and Oxford vials may represent a problem with either the laser-drilling process itself or an example of the defect becoming obstructed by foreign debris post-fabrication.
Fourth, the much greater variability observed in the diffusion parameter for the glass laser-drilled defects, as compared to results for the metal disc laser-drilled defects displayed in Figure 4, is real and due to the much greater geometric variability of the glass laser-drilled defects across samples and manufacturers. The observed leak rate variability is not due to measurement variability.
These reproducibility issues, both between manufacturers and within a set of vials that have a particular nominal defect diameter from a single manufacturer, are a reflection of the variable defect geometry inherent to laser-drilled holes in glass (13). Indeed, using a combination of X-ray microcomputer tomography and scanning electron microscopy, images of a 5 μm nominal defect generated by Lenox Laser with laser drilling demonstrated that there was no through-hole present with a 5 μm diameter (15). Instead, cross-sectional images revealed a star-pattern of cracks in the glass wall with widths of about 1 μm at the widest and significant variations in defect length. This also implies potential physical instabilities of the defect geometry that could be readily altered by temperature changes or pressure gradients applied across it.
The complex defect geometry associated with laser drilling into a glass wall is obviously difficult to physically model. Furthermore, because the diffusion flow model (see eqs 6 and 7) depends upon both the defect area and depth, correlating the calibrated defect size determined under effusive conditions with results obtained under diffusive conditions becomes problematic. This likely explains why the oxygen diffusion parameters in Figure 5.A for the Lenox vials, obtained under diffusive conditions, have such variability; Lenox Laser employs a calibrated flow rate acquired under effusive conditions (flow occurring when a 1 atm pressure difference exits across the defect) to determine an effective defect diameter. Both Oxford and Potomac, in contrast, employ an optical technique to measure the defect size, perhaps explaining why the observed oxygen diffusion parameters for the Potomac vials displayed a stronger correlation with the idealized area associated with the defect, as displayed in Figure 5.C.
It is important to emphasize that the oxygen ingress over time was exponential, as expected in diffusive flow, and that the data thus provides a reproducible diffusion parameter, αDiff, as a single parameter that can be used to readily compare laser-drilled defects from the different vendors and different defect geometries. The issues related to the complexity of laser-drilled defects in glass walls are a problem only if an attempt is made to correlate the glass defect geometry (effective diameter and length) with the observed diffusion parameter αDiff or microbial ingress. Recall again from Figure 5 that the observed gas ingress parameters, measured under diffusive conditions, differ significantly between the three suppliers of the laser-drilled defects. Because of their inherently complex geometry that depends upon many processing variables, laser-drilled glass defects should not be used as universal standards to calibrate the diffusive ingress or egress of gas from a package assembly. However, they are a good option as positive controls because they do provide a reasonable mimic of a type of defect that could be potentially observed in a pharmaceutical vial during package sealing or in-process testing (3).
Effusive Flow-Through Defects
The results presented thus far examined diffusive ingress of oxygen through two types of defects into glass vials stoppered at 1 atm of nitrogen. The second half of this work examined the gas ingress for the same glass vials under effusive conditions. As described above in the Theoretical Background, effusive flow occurs when there is a total pressure difference across the defect, as typically occurs with lyophilized product. Using one of the sample vials sealed with a metal disc with a laser-drilled micro-hole of 10 μm, Figure 6 displays the change in total headspace pressure as the headspace air effuses out of the vial (effusion to the outside) and as the ambient air effuses back into the sample vial (effusion to the inside). These results illustrate two important features. First, the effusive flow into a vial with a headspace vacuum (effusion to the inside) is different from the corresponding effusive flow out of the vial headspace generated by placing the vial package in a vacuum (effusion to the outside).

A representative example of effusive flow for one of the sample vials sealed with a 50 μm thick metal disc with a laser-drilled micro-hole of 10 μm. The graph displays the change in total pressure as the headspace air is removed by a vacuum pump attached to the 10 μm micro-hole (effusion to the outside) and as the ambient air effuses back into the sample vial through the micro-hole after the vacuum pump is removed (effusion to the inside). The solid lines represent exponential curve fits to illustrate that the change of total pressure during both of the effusive conditions is not exponential with respect to time; the effusion to the outside data is fit to out(exp[−Bout(t − tout)]) and the effusion to the inside data is fit to Ain1 − exp[−Bin(t − tin)]), where A, B and t represent the three fit parameters.
To understand this behavioral difference, first consider the effusion to the outside condition during which the vacuum outside of the container is fixed while the headspace pressure drops as the headspace gas effuses out of the vial container. As the pressure drops, the probability of a gas molecule randomly hitting the defect hole becomes smaller and, hence, the rate of the gas egressing from the vial decreases. This can be observed by inspection in Figure 6. In contrast, the effusion to the inside models a sample vial that has been sealed with a headspace at full or partial vacuum. Because the pressure of the ambient air that ingresses into the headspace through a defect path does not change, the density of air flow pushing through the defect hole does not change. Instead, as the headspace pressure in the vial approaches that of the surrounding environment outside the vial, the rate at which a gas molecule inside the vial exits out of the vial slowly increases, counteracting the gas flow into the vial. Again displayed in Figure 6, this results in a decrease of the overall rate as the headspace pressure approaches the atmospheric conditions.
The second important feature illustrated by Figure 6 is that neither the effusion to the outside nor the effusion to the inside conditions exhibit simple exponential changes (see eq 11) in headspace total pressure with respect to time. This is in contrast to the diffusive behaviors discussed previously and is a direct reflection of the fact that both effusive behaviors take place within a pressure regime that includes fluid dynamic effects (with the exception of the regime of headspace pressures less than ∼100 torr for the effusion to the outside condition) (see Theoretical Background section).
Figure 7.A presents representative effusive data for the three different nominal defect diameters of positive controls that were sealed with a metal disc. The data were acquired as described in the Sample Preparation—Effusion Experiments section of Materials and Methods. Using the mathematical model presented in eq 15, least-square fits have been overlaid on top of the data as solid lines. The effusion parameter, αEff, that is calculated from this type of fit is presented in Figure 7.B as a function of the idealized defect area, and included in Table IV for each of the metal discs in all three different defect diameters (5, 10, and 15 μm) that were originially fabricated for the above diffusion study. Figure 7.C, Figure 7.D, and Table V present the parallel data for the samples with Lenox laser-drilled holes in their glass walls.

(A) Representative examples of the effusive flow for one of the sample vials sealed with a 50 μm thick metal disc with a laser-drilled micro-hole with either a 5, 10, or 15 μm nominal diameter. The solid lines represent the least-squares fit to the data using the model presented in eq 15. (B) Each data point represents the calculated effusion parameter, αEff, for a different metal disc, as determined by least-squares fit as shown in (A). These results are plotted as a function of the defect area that is calculated from the diameter measured by the manufacturer via an independent optical technique. The solid red line is a least-squares linear fit to all of the data acquired for the metal disc samples. The solid black line represents the theoretical correlation between the orifice leak size and air leakage rate that is reported in Table I of USP 39 <1207.1> Section 3.9. (C) Representative examples of the effusive flow for one of the stoppered vials with a Lenox laser-drilled hole in their glass wall with a 2, 5, 10, or 15 μm nominal diameter. The solid lines represent the least-squares fit to the data using the model presented in eq 15. (D) Each data point represents the calculated effusion parameter, αEff, for a different sample vial with a Lenox laser-drilled hole in their glass wall, with the results presented in an identical manner as described for the data in (B).
Similar to Figure 4, the results presented in Figure 7.B and Figure 7.D clearly demonstrate that the effusion parameter, αEff, is linearly dependent upon the defect cross-sectional area; the least-squares fit is displayed as a solid red line. In addition, the theoretical relationship between the orifice leak size and air leakage rate that is reported in Table 1 of USP 39 <1207.1> Section 3.9 is displayed as a solid black line; this correlation was provided by Lenox Laser. The similarity of this theoretical correlation presented in USP 39 <1207.1> with the linear correlation observed in Figure 7.D for the experimental data with the Lenox laser-drilled samples (solid red line) is not simply a fortuitous coincidence. Note that the P0·αEff product represents the volumetric flow rate Φ under the conditions in which there is a P0 = 1 atm pressure difference across the container. This represents the conditions at which Lenox Laser, using a standardized flow calibration apparatus, determines the flow effective diameter of their laser-drilled defects. In other words, these results demonstrate that the effusion parameter, αEff, provides a single parameter that fully characterizes the time-dependent effusive flow (see Figure 7.C) and can be directly related to the relationship presented in USP 39 <1207.1>.
It should be emphasized that this relationship between the orifice leak size and air leakage rate that is reported in Table 1 of USP 39 <1207.1> Section 3.9 is theoretical and based upon mathematical models and predictions done by Lenox Laser. The inclusion of this relationship in USP 39 <1207.1> was intended to serve as a means of categorizing leak rates and, thereby, group leak test technologies according to their leak detection capability (25). The fact that the data points lie along the USP 39 <1207.1> line in Figure 7.D simply reflects that the effusive leak rates, as determined by Lenox Laser and by laser-based headspace analysis, can be directly correlated (in this case, by an effective orifice leak size).
It should also be emphasized that the orifice leak size is a theoretical measure of the effective cross-sectional size along the entire length of all of the leak path(s) permitting the effusive gas flow. As indicated above, this effective orifice leak size may be significantly different from the actual defect geometry as measured optically (13, 15).
It is also important to recognize that, according to the Hagen-Poiseuille derived model presented in eq 15, the effusion parameter αEff should be dependent upon the square of the cross-sectional area of the defect. However, the experimental results for both the metal disc and Lenox laser-drilled vial samples clearly display a strongly linear dependency. This relationship was also observed with the Potomac laser-drilled vial samples, though an exact correlation could not be done because the exact defect size was not provided by the manufacturer. (Because only one defect size was considered for the Oxford laser-drilled vial samples, there is not enough information to evaluate this dependency.) This discrepancy between the theory and the experimental results is further discussed in the Discussion section.
Finally, the ingress parameters, measured under both diffusive and effusive conditions, for each of the four model sample vial sets (one set sealed with the metal disc and the three sets with laser-drilled holes in their glass walls) are presented in Figure 8 and Tables IV⇑⇑–VII. By inspection, there is a strong correlation between the diffusion and effusion parameters measured for the micro-holes in the metal discs (Figure 8.A). Recalling again that the Potomac defects were directly measured using an optical technique, this is also true for the Potomac samples with laser-drilled holes in the vial walls (Figure 8.B). However, the Lenox version of these model samples does not show such a correlation (Figure 8.C). Instead, the results indicate that though the effusion parameter for each of the four nominal defect sizes of the Lenox samples are distinguishable (Figure 7.D and along ordinate axis of Figure 8.C), their corresponding diffusion parameters are not (Figure 5.A and along abscissa axis of Figure 8.C). Again, as mentioned before, this is most likely simply a result of the fact that Lenox Laser employs a calibrated flow rate acquired under effusive (a 1 atm pressure differential) conditions to determine an effective defect size. There is not enough data for the Oxford version of the model samples to make any strong conclusions other than to note that a lot of variation was observed for the ingress parameter under both diffusive and effusive conditions for defects that all had the same 5 μm designation.

The relationship between the measured ingress parameters observed under both diffusive and effusive conditions as determined for each individual vial for the sample models (A) sealed with a metal disc with a laser-drilled micro-hole of 5, 10, or 15 μm. Sample models sealed with a crimped stopper and with a laser-drilled hole in the glass wall as produced by the (B) Potomac, (C) Lenox, and (D) Oxford manufacturers.
Discussion
The physics and boundary conditions that govern gas leakage through defects are complex. A condition during which packages are actively leaking can be either temporary or permanent. The defect geometries can vary dramatically, from complex glass fractures to vial stopper breaches generated by extraneous fibers, stopper pop-up, or elasticity failures caused by large thermal changes. The headspace gas exchange through a leak path can be driven by either effusive or diffusive forces, or some combination of both. The effusive flow starting from a full vacuum is initially kinetic, then laminar, and then finally turbulent.
The proposal of using headspace analysis to detect a leak in a pharmaceutical container presented herein is based upon the viewpoint previously presented that states that a breach to CCI is accompanied by a gas exchange between the container headspace and the surrounding environment. Therefore, if the surrounding gas environment is different from that of the headspace, characterizing the headspace total pressure and/or the partial pressures associated with the gas constituents provides a rapid, deterministic, and nondestructive means of evaluating CCI. This represents the first of two primary goals of this work.
The second primary goal of this work was to validate mathematical models that can accurately predict the time-dependent headspace gas-exchange generated by either diffusive or effusive conditions. Note that this headspace gas exchange will be a function of (1) both the total and partial pressure difference across the defect for the gas species of interest and (2) the geometry of the defect. Furthermore, because the pressure difference across the defect is changing in real-world storage conditions, this headspace gas exchange rate will also be a function of time.
The results displayed in Figure 3, Figure 7.A, and Figure 7.C demonstrate that the mathematical models, presented by eq 6 for diffusion and eq 15 for effusion, accurately predict the time-dependent headspace gas exchange rate for their respective pressure conditions. The linear dependence of the diffusion parameter, αDiff, on the idealized defect area, A0, that is observed in Figure 4 corroborates the diffusive physical model in eq 7, based on Fick's law, that is outlined in the Theoretical Background section.
On the other hand, the linear dependence of the effusion parameter, αEff, on the idealized defect area, A0, that is observed in Figure 7.B and Figure 7.D is contrary to the predicted quadratic dependency in eq 16 that is derived from the Hagen-Poiseuille solution. It is important to recognize that the Hagen-Poiseuille solution assumes laminar flow. Laminar flow in a pipe (e.g., a capillary) exists when its length is significantly greater than its diameter; this is certainly not the case for the defects in the metal discs and difficult to know for the defects in the glass walls. Regardless, the experimental results conclusively demonstrate that the effusive ingress of gas does not represent Hagen-Poiseuille flow.
However, the functional form of the model presented in eq 15 fits the observed effusive ingress quite well, with a RSQ that is typically better than 0.999 for the Lenox vials (Table V) and about 0.99 for the metal disc vials (Table IV). (It is worth noting that, because the length of the defects in the glass walls are likely longer than those drilled into the metal discs, the defect geometry more closely resembles a capillary [i.e., length much greater than the diameter of the path] for the glass defects and, thus, more closely matches the assumption inherent in the Hagen-Poiseuille solution.) This suggests that that the volumetric flow of the effusive ingress (referring to eq 13) is, to a first-order approximation, proportional to the square of the pressure:
 Though additional experimental work is being conducted to further characterize the physical model and the resulting proportionality, it is important to note that the functional form of eq 15 facilitates accurate predictions about the time-dependent gas ingress associated with an idealized defect geometry under effusive pressure conditions.
There are a number of other important conclusions that can be made based upon considering these results together. First, caution must be used when characterizing package defects by ingress/egress rates obtained under effusive test conditions. Effusive flow is strongly dependent upon the direction of the gas flow, the absolute external pressure, and the pressure difference across the defect. In other words, the effusive rates measured under specific testing conditions will be valid for those conditions but will likely not be the same as the effusive rates measured under other conditions.
Furthermore, these results demonstrate that correlating a diffusion rate with a corresponding effusion rate is problematic. This result is not unexpected after recognizing that effusion leak rates depend primarily upon the cross-sectional area of the defect and are relatively insensitive to the defect length while diffusion leak rates depend upon the area-to-length ratio of the defect. For defects that are well constructed and easily modeled (i.e., drilled holes in metal discs), a straightfoward relationship can exist between diffusion and effusion parameters measured for the same defect (see Figure 8.A). For defects with more complex (real-world) geometries that develop during nominal production efforts, such a monotonic relationship will not necessarily exist (see Figure 8.C). However, the use of well-defined defect standards, such as the laser-drilled metal discs used in the current study, allowed for an objective characterization of the ability of the headspace method to measure gas flow through micron-sized defects. Studies using such metal disc defect standards as positive controls can also serve as the basis for CCI test method development and validation. This assumes that the test package materials and geometry can accommodate such a standard and, if product formulation is present, that any product-defect interaction is representative of real-world conditions.
Quite generally, characterizing CCI and/or sterility with some generalized geometric aspect of the defect is problematic. A likely breach in package integrity for a glass vial container is a defect caused by an improper seal between the vial and stopper. The primary seal of a vial-stopper combination is the land seal that exists at the horizontal, flat surface at the top of the glass vial (23). Though the plug of the stopper also plays a role in sealing the vial, it is not intended to be the primary sealing surface. Regardless, breaches at this sealing surface will most likely be generated by defects with relatively complex geometries that are difficult to accurately model mathematically (26) and that may well consist of multiple leak paths. Furthermore, the change in the gas content of the package headspace can be a combination of effusive and diffusive flow as well as the omnipresent permeation through polymeric components of the package; the complexity of this process makes extracting a defect size parameter, even for defects that are well constructed, rather difficult. Finally, even under conditions at which diffusion is dominant, the measured diffusion rate depends upon the ratio of the cross-sectional area of the defect to its length; A0/L and real-world defects are rarely represented by a cylindrical hole with well-known dimensions.
Therefore, instead of attempting to characterize the closure integrity of a container by a geometric aspect associated with the defect(s), the container closure system should be considered holistically by determining the MALL associated with the specific product. The holistic approach recognizes that the MALL represents a parameter that is insensitive to the means via which gas ingress can occur and yet still provides a metric that enables the integrity of the pharmaceutical product to be quantified.
For single-dose packages, USP <1207> Section 5 breaks down product-package quality requirements into two major categories that are differentiated by whether or not gas headspace content must be preserved (1). For the first category in which only sterility and product formulation content must be preserved (i.e., not gas headspace content), the MALL is defined as the ingress rate associated with a 0.1 to 0.3 μm nominally sized defect. As USP <1207> Section 5.1 notes, this defect size is linked to ”a MALL of less than 6 × 10⁻⁶ mbar·L/s (as measured by helium mass spectrometry in the vacuum mode)” (1). In other words, if the container closure system has a helium leak rate that is less than 6 × 10⁻⁶ mbar·L/s, the risk of microbial ingress can confidently be stated as being so minimal that it is inconsequential.
The second category for single-dose packages represents situations in which the gas headspace content, as well as the sterility and product formulation content, must be preserved in order to maintain product stability and/or access. The MALL associated with such products will likely be more stringent than the 6 × 10⁻⁶ mbar·L/s helium leak rate defined for the first category and may be defined in terms of a maximum allowable headspace content (e.g., oxygen) or pressure as a function of time (1).
With this concept of the MALL parameter kept in mind, what the results herein demonstrate is that (1) the oxygen content of the headspace of a package can be quickly and precisely measured; (2) the ingress rates associated with effusion and/or diffusion through a micron-sized defect can be readily differentiated from ingress rates associated with permeation through the vial stopper (see Figure 5); and (3) the mathematical models can be employed to predict the gas ingress as a function of either an ingress rate parameter (αDiff or αEff) or an idealized defect area. With respect to the second point, it is worth noting that the minimal gas exchange associated with the inherent leak rate for a given package assembly (e.g, permeation through the vial stopper) should be such that it is less than the MALL associated with the product-package assembly.
As a concrete example, consider a product with a packaging system that creates a 1 mL headspace volume with pure nitrogen at 0.8 atm. If the product-package assembly was required to only maintain sterility, the MALL is represented by a 6 × 10⁻⁶ mbar·L/s helium leak rate. Using the effusive model presented in eq 15 and assuming an equivalent leak rate for air, this would suggest that in roughly 25 h the headspace oxygen content would increase to 2% atm, a level readily detectable in most containers via laser-based headspace analysis. Note that if the product was packaged under full vacuum, the headspace oxygen content would increase to 2% atm in only 5 h.
Taken together, these results provide a framework for the development of test methods designed to evaluate CCI using laser headspace analysis. For every package system, whether a vial/stopper, plunger/syringe, or flame-sealed ampoule, a range of leakage rates will be exhibited that reflect the package system's inherent integrity. Such leakage occurs between the mechanically fitted and physicochemically bonded components and via permeation through glass and polymeric components. Negative controls, fabricated from the same packaging components and with careful assembly, will enable this inherent leak rate to be determined (see Figure 5.D). If need be, flame-sealed containers can be fabricated to distinguish this rate from a true zero. Leakages greater than the inherent ingress rate that exceeds the MALL can occur if the package is poorly assembled and/or there are component defects. If the measured oxygen content is greater than what the MALL permits, then such a defect exists and CCI has been compromised.
It is important to note from an application perspective that the measurement of the oxygen ingress does not have to involve the many measurements that were acquired for the data displayed in Figure 3; this is only necessary if a well-defined rate is required. In practice, after the packaging process has been well characterized and nominal packaging conditions have been established, a measurement at one or two time points can be used to determine whether CCI has been maintained. If the measured headspace oxygen content exceeds the limit defined by the MALL at that time point, then that sample vial failed. This failure could be due to either (1) a packaging defect that breached the package integrity by increasing its leakage above its inherent leak rate (i.e., a CCI failure) or (2) a package assembly/processing (e.g., vial headspace purging) error. Differentiating between these two failure modes could be done by obtaining an initial oxygen measurement immediately after the vial was sealed.
In other words, method development for a particular pharmaceutical and packaging system would involve measuring the headspace oxygen content, as a function of time, for positive controls with known defects and negative controls that are nominally sealed. These data would establish the time interval required to observe the oxygen content at which the product fails the CCI test as defined by its MALL. Method validation would then involve including sample vials that are both filled with product and have known defects to establish that the developed CCI test method can identify 100% of both the true positives and true negatives measured after the specified time interval.
Note that this method does not rely on measuring a defect size or correlating a measured effusive leak rate with CCI. This is in recognition that real-world container defects will have highly variable, complex geometries and that the transfer of gas/liquid from the container will be a convoluted mixture of effusive, diffusive, and permeation processes. Instead, this methodology is founded on the established concepts that microbial ingress requires liquid flow and that liquid flow can only occur if gas can also ingress through the defect. Therefore, by quantifying the change in oxygen headspace content, irrespective of its manner of ingress, the presence of a defect that could allow microbial contamination can be determined with confidence.
Finally, it is prudent to recognize the potential of the product interfering with the selected leak test method, both initially after package assembly and over time. Proteinaceous ingredients and even salts have the potential to clog defect leak pathways, thereby inhibiting leak detection by gas-flow methods. Additional complications include the potential of the defect existing below the liquid product level and product oxidation masking the ingress of oxygen into the vial. These scenarios are currently being examined with additional studies.
Conclusions
In summary, the experimental results presented for two different types of positive controls validated that laser-based headspace analysis can robustly measure leaks under both effusive and diffusive conditions. It was demonstrated that the measured gas ingress, under both diffusive and effusive conditions, is linearly correlated with the idealized area of a defect; however, the correlation between the diffusive and effusive ingress for a particular defect depends upon geometric details beyond just its cross-sectional area. In other words, the measured leak rate for a package system does not reveal anything about the defect geometry other than it exists.
Finally, mathematical models, derived from gas and fluid flow dynamics, were developed and validated. These models facilitate making quick, accurate predictions about the time-dependent effusive and diffusive ingress rates associated with any combination of the cross-sectional area and length of an idealized defect.
Taken together, these results demonstrate that the deterministic method known as laser-based headspace analysis can robustly evaluate CCI by providing sensitive, accurate, and reproducible measurements of the gas content within glass vial/stopper package assemblies.
Conflict of Interest Declaration
The authors declare that they have no competing interests.
Acknowledgments
The authors would like to thank Mike Lally, David McMahon, and Derek Duncan for their input on the design of the study. The authors would like to thank Dana Guazzo for her invaluable feedback given while reviewing this manuscript.
- © PDA, Inc. 2017
References


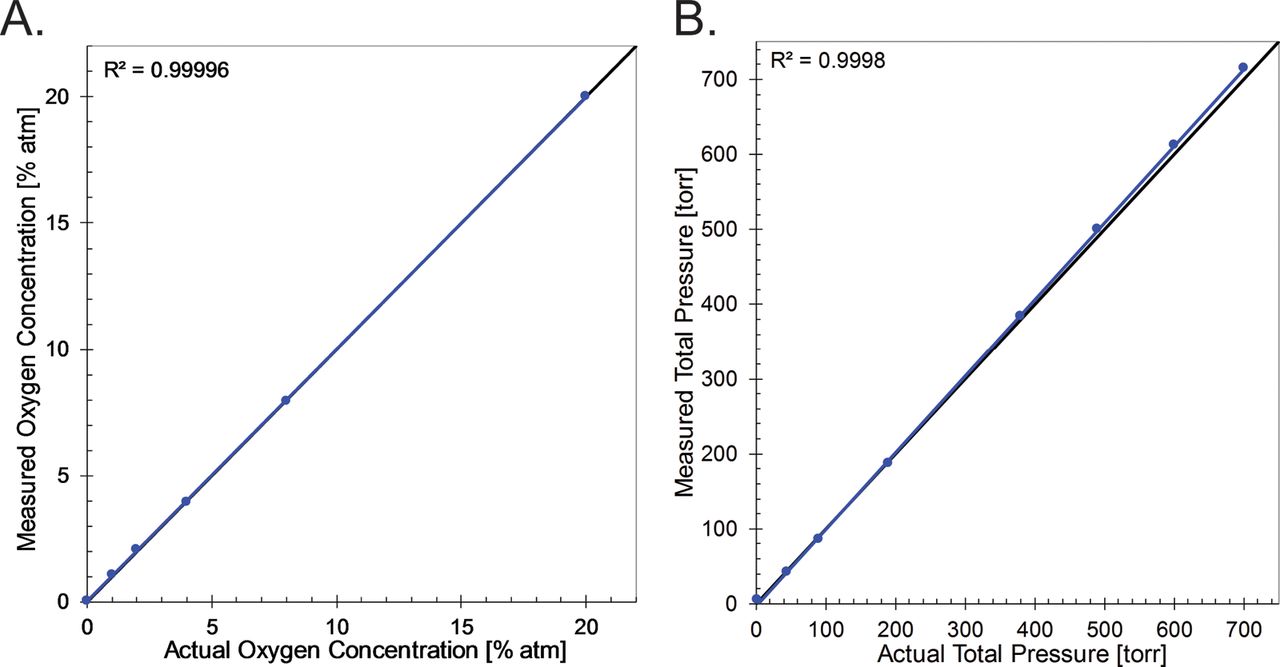
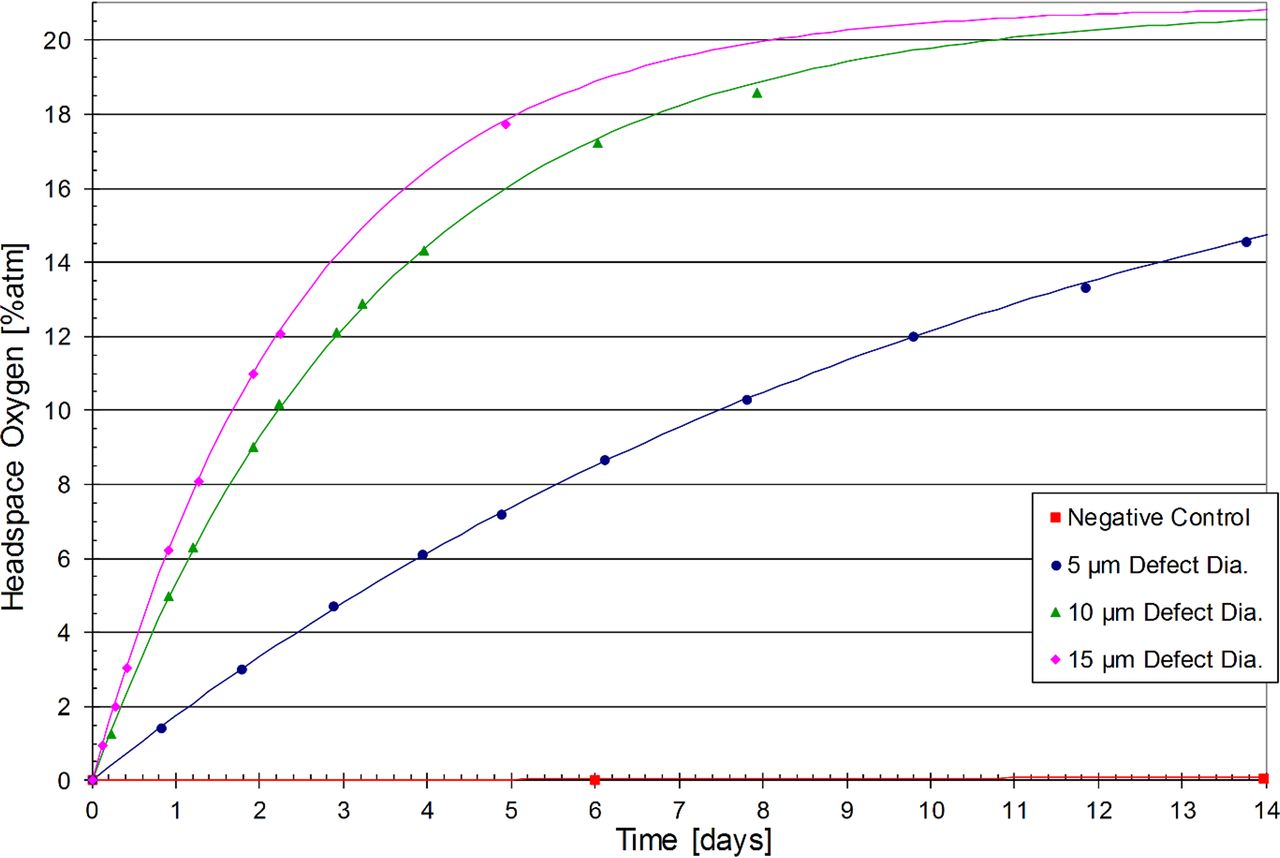
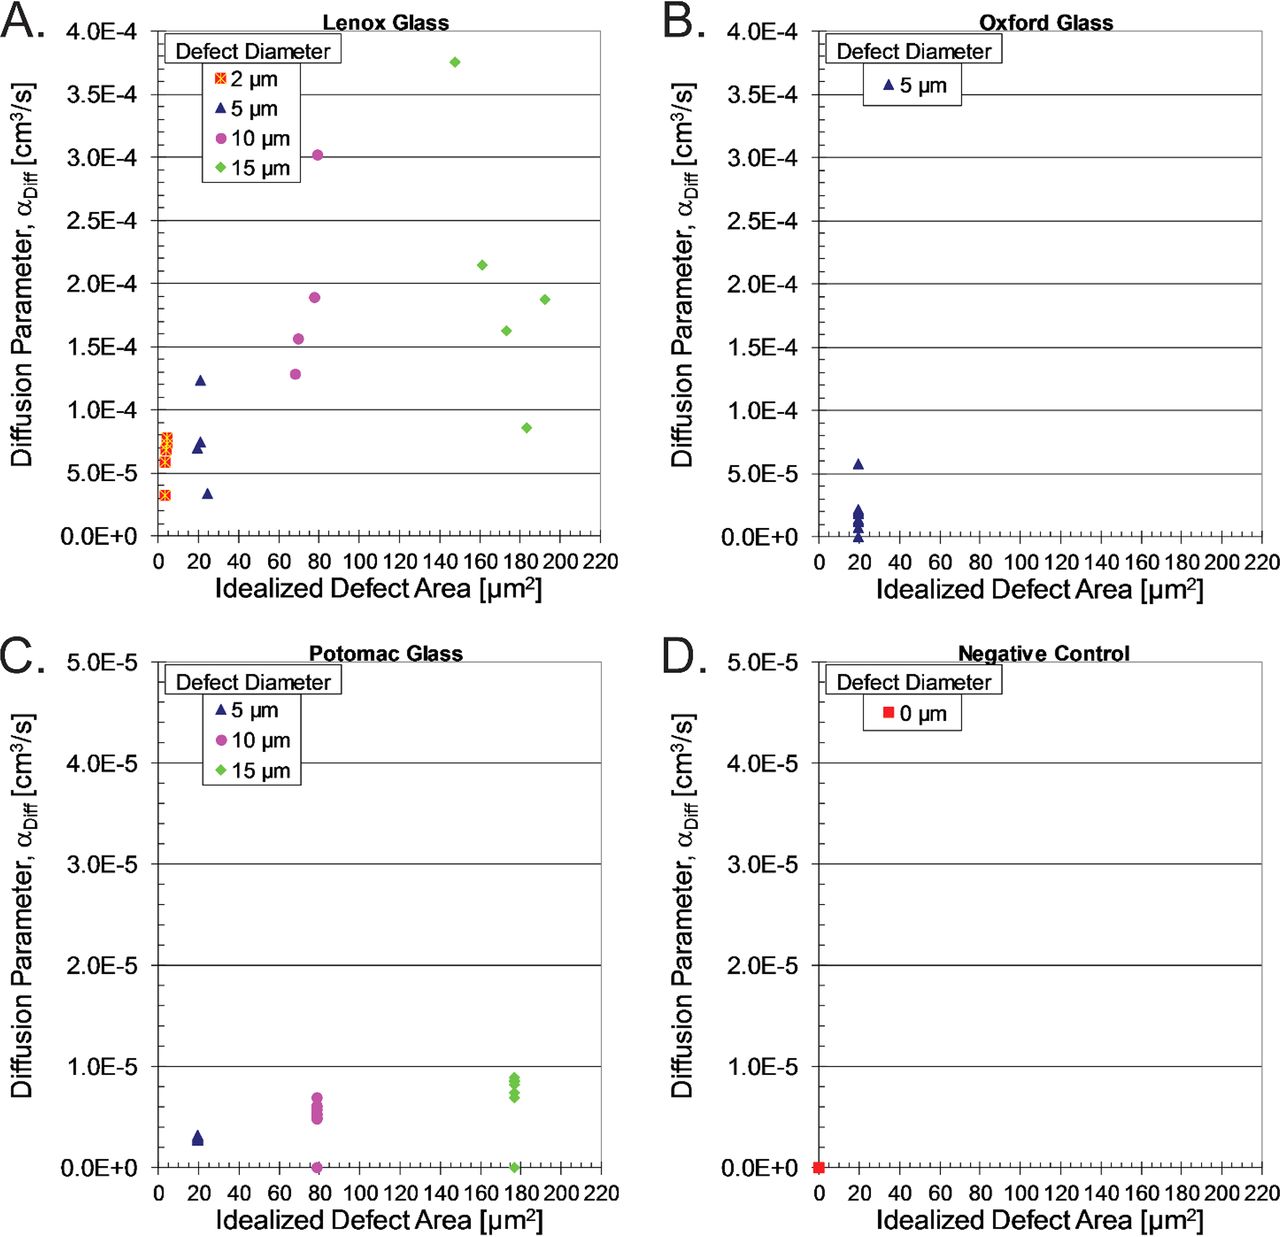
Jump to section
Related Articles
Cited By...
- Comparing Container Closure Integrity Test Methods--Performance of Headspace Carbon Dioxide Analysis versus Helium Leakage Using Positive Controls
- A Container Closure Integrity Test Method for Vials Stored at Cryogenic Conditions Using Headspace Oxygen Analysis
- Assessment of Functional and Physical Performances of Pre-filled Syringes in Deep Cold Storage Conditions
- Container Closure Integrity Test Method Development on Vials Stored at -80{degrees}C Using Headspace Carbon Dioxide Analysis
- A Multicompany Survey Study for Helium Leak Container Closure Integrity Test
- A New Integrated Modeling Approach with Case Studies for Gas Transmission of Container Closure Headspace
- Container Closure Integrity Test Using Frequency Modulation Spectroscopy Headspace Analysis with Carbon Dioxide as a Tracer Gas
- Comparing Physical Container Closure Integrity Test Methods and Artificial Leak Methodologies
- Container Closure Integrity Testing--Method Development for Freeze-Dried Products Using Laser-Based Headspace Oxygen Analysis