
Abstract
There has been a growing interest in recent years in the assessment of suitable vial/stopper combinations for storage and shipment of frozen drug products. Considering that the glass transition temperature (Tg) of butyl rubber stoppers used in container closure systems (CCSs) is between −55 °C to −65 °C, a storage or shipment temperature of a frozen product below the Tg of the rubber stopper may require special attention because below the Tg the rubber becomes more plastic like and loses its elastic (sealing) characteristics. Thus, they risk not maintaining container closure integrity (CCI). Given that the rubber regains its elastic properties and reseals after rewarming to ambient temperature, leaks during frozen temperature storage and transportation are transient and the CCI methods used at room temperature conditions are unable to confirm CCI in the frozen state. Hence, several experimental methods have been developed in recent years in order to evaluate CCI at low temperatures. Finite element (FE) simulations were applied in order to investigate the sealing behaviour of rubber stoppers for the drug product CCS under frozen storage conditions. FE analysis can help in reducing the experimental design space and thus the number of measurements needed, as they can be used as an add-on to experimental testing. Several scenarios have been simulated including the effect of thermal history, rubber type, storage time, worst-case CCS geometric tolerances, and capping pressure. The results of these calculations have been validated with experimental data derived from laboratory experiments (CCI at low temperatures), and a concept for tightness has been developed. It has been concluded that FE simulations have the potential to become a powerful predictive tool toward a better understanding of the influence of cold storage on the rubber sealing properties (and hence on CCI) when dealing with frozen drug products.
LAY ABSTRACT: The growing interest in the assessment of suitable vial/stopper combinations for storage and shipment of frozen drug products has led to the development of a number of experimental methods to evaluate container closure integrity at low temperatures. The application of finite element simulations could aid in the investigation of the sealing behaviour of rubber stoppers for drug product container closure systems under frozen storage conditions by simplifying the experimental design space and the number of experimental measurements needed. In this work several scenarios have been simulated including the effect of thermal history, rubber type, storage time, worst-case container closure system geometric tolerances, and capping pressure. The results have been further validated with experimental data derived from laboratory experiments and a concept for tightness was developed. In conclusion, finite element simulations have shown the potential to become a powerful predictive tool toward a better understanding of the influence of cold storage on the rubber sealing properties (and hence on container closure integrity) when dealing with frozen drug products.
- Container closure integrity
- Finite element analysis
- Frozen drug product
- Container closure system
- Vial
- Parenteral primary packaging
1. Introduction
Biological products are commonly stored at 2–8 °C. However, especially in early stages, drug products for parenteral administration can also be developed to be stored in the frozen state (e.g., −20 °C or −80 °C) in order to achieve a sufficient shelf-life. The frozen drug products are commonly shipped in vials capped with rubber stoppers in frozen state (1). Considering that the glass transition temperature (Tg) of commonly used butyl rubber stoppers in container closure systems (CCSs) is between −55 °C and −65 °C (2), a storage or shipment temperature of a frozen product below the glass transition temperature for rubber may require special attention, because below the Tg the rubber becomes more plastic like hence losing its elastic characteristics. Thus, they risk not maintaining container closure integrity (CCI). Given that the rubber regains its elastic properties and reseals after rewarming to ambient temperature, leaks during frozen temperature storage and transportation are transient and the CCI methods used at room temperature conditions are unable to confirm CCI in the frozen state. It should nevertheless be pointed out that the risk of microbial contamination in the frozen state is by far lower compared to storage or shipping in the liquid state (e.g., 2–8 °C), as microbial growth hardly happens at such temperatures and the product is frozen so that a liquid fluid path supporting intrusion of microbes is not given in the frozen state. On the other hand, any under-pressure in the vial or gaps at the frozen level could mean an ingress of contaminants and/or microbes even in the frozen state by passive transport due to pressure differences. In all cases, evaluating the sealing behaviour of CCS under frozen conditions is currently of utmost importance within the pharmaceutical industry.
In recent years, there has been a growing interest in the assessment of suitable vial/stopper combinations for storage and shipment of frozen drug products. Hence, several experimental methods have been developed in recent years to evaluate CCI at low temperatures (3⇓–5).
The new version of USP <1207> provides detailed guidance for CCI assessment for sterile products (6). It includes guidance regarding methods for container closure integrity testing (CCIT), introduction of artificial leaks, considerations of microbial CCI (mCCI) to establish acceptance criteria for physical CCI (pCCI), as well as considerations about the applicability of CCIT in the product lifecycle (7). However, the extent of applicability is nowadays meant merely at room temperature, meaning there are no specific regulatory requirements for CCI at low temperatures. The change in landscape in the pharmaceutical industry, with frozen drug products being increasingly explored, brings new ways to deal with CCI at low temperatures. Hence it would be of interest to implement a regulatory guidance as well as new methods for such low-temperature testing.
Recent studies with such novel methods have highlighted the importance of having an appropriate vial, stopper, and cap combination that is capped under suitable parameters (8, 9). In particular, the ThermCCI method based on the He-leakage test has been used to evaluate the CCI behaviour of several vial-stopper combinations under static conditions (5). Additionally, the influence of stress conditions, such as variable capping force or shipment on the CCI at low temperatures, has been assessed (10). The output of these studies represents a tool to make informed decisions on the most appropriate CCS whenever a new product requiring frozen storage is to be considered. However, testing all possible influencing parameters that may affect the CCI behaviour of a CCS (such as dimensional tolerances, capping forces, freeze-thaw cycles, etc.) with actual samples requires an increasingly large sample set. Therefore, both simulations and calculations are being more and more used in the field of low temperatures (11).
To obtain in-depth knowledge about sealing behaviour of drug product CCSs under frozen storage conditions, finite element (FE) simulations have been performed (11, 12). As a prerequisite for such simulations, viscoelastic material properties for the rubber stoppers have been obtained through experimental dynamic mechanical thermal analysis (DMTA). Thereafter, transient sealing behaviour has been simulated by FE calculations for numerous scenarios including the effect of thermal history, rubber type, storage time, worst-case CCS geometric tolerances, and capping pressure, etc., on the rubber stopper sealing behaviour under frozen conditions.
FE analysis can be considered as an add-on to actual testing as well as a tool to design or compare new primary packaging combinations, for example when aiming at the development of frozen drug products. FE analysis can assist in narrowing down the experimental design space (13⇓–15). In FE analysis, the computer codes are based upon experimental data and hence upon fundamental material properties, and the resulting output is also in the form of data. There are several advantages of FE analysis: It can gather information where measurements are not possible, it can help overcome the design iterations in the laboratory, it enables the separation of material properties and design, and information can be used either to enrich existing data or to serve as the primary mode of analysis.
In this study, FE calculations were used to investigate the sealing behaviour of rubber stoppers under frozen conditions. The results of these calculations were validated with experimental data derived from laboratory experiments (CCI at low temperatures) and vice versa. Hence, the authors conclude these simulations have the potential to become a powerful predictive tool toward a better understanding of the influence of cold storage on the rubber sealing properties (and hence on CCI) when dealing with frozen drug products.
2. Materials and Methods
2.1. Material Properties
As a prerequisite for the intended FE simulations, viscoelastic material properties of the selected rubber stopper formulations were measured by DMTA and a viscoelastic material model was developed and used in the simulation model.
The material‘s viscoelastic properties were tested on an EPLEXOR 500 N system (Gabo Qualimeter Testanlagen GmbH, Ahlden, Germany). The acquired data were analyzed, evaluated, and processed using the ViscoData v2.0 and ViscoShift v1.61 software packages. The ViscoData software was used to predict the viscoelastic behaviour of the rubber under different temperatures and loading conditions. The viscoelastic behaviour of a rubber seal at low temperatures can be characterized by the so-called Prony series consisting of a sum of several exponential functions with different intensity coefficients and relaxation time constants (16). From various experiments, capable of characterizing viscoelastic properties, a so-called master curve is developed. By application of an evolutionary algorithm, the intensity coefficients and time constants of the Prony series are adapted in such a way that the series describes the experimental data with minimal error. The now-defined Prony series is equivalent to the relaxation spectra associated with the material in question. This enables the prediction of further important behaviours of the material, which are not directly measured but can now be derived analytically.
The viscoelastic material properties of two butyl rubber stopper formulations were measured by experimental dynamic thermal mechanical analysis within a temperature range from −196 °C (liquid nitrogen) up to 50 °C (results not shown).
The raw data was post-processed and Prony series were derived. This allows the acquisition of all the necessary input parameters for the FE material model. The physical properties of the glass vial and aluminum flip-off cap were obtained from relevant literature (17). The thermo-mechanical properties of the two different rubber formulations, thermal conductivity and specific heat, were calculated (results not shown).
2.2. Concept of the FE Simulation Model
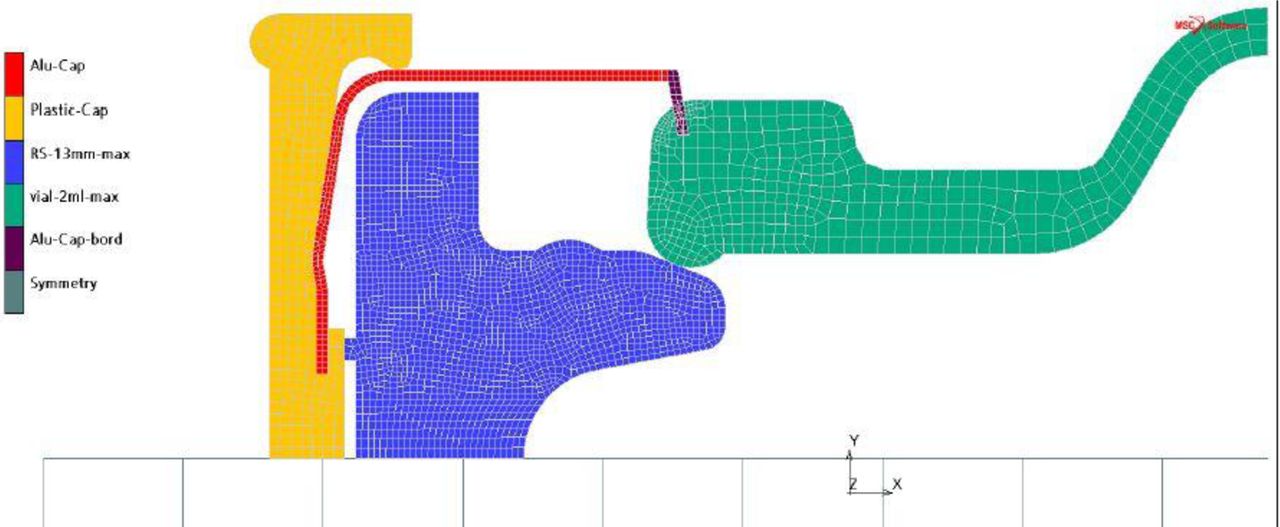
The simulation model used includes three bodies (Figure 1):
Glass vial
Rubber stopper
Flip-off cap (aluminum combined with polypropylene)

Model overview for 13 mm neck. Initial conditions before closing the container showing mean overlap between vial and rubber stopper. RS = rubber stopper.
The model is in 2D with axial (rotational) symmetry. The geometry is modeled with mean tolerance dimensions, as per specification (data not shown, confidential drawings). The container closing force is set to 40 N (18). There is no fluid inside the container.
The applied simulation technologies include the consideration of geometric nonlinearities (large deflection, buckling effects, if applicable), nonlinear material properties (rubber material F1 and F2, data acquired by measurements), and nonlinear boundary conditions (contact with friction).
For the 13 mm neck vial, the model is composed of roughly 4000 elements and 4350 nodes. For the 20 mm neck vial, the model is composed of roughly 3800 elements and 4300 nodes. The number of elements is determined by modeling requirements.
The software Marc (MSC Software Corporation, Santa Ana, CA) was used in the simulations.
Each component of the model is represented as a single contact body. The friction coefficient is generally set to 0.15 (19).
2.3. Simulated Versions
The simulation results presented in this report include transient sealing behaviour of glass vials with a 13 mm neck and glass vials with a 20 mm neck for different scenarios:
7 days of storage at −20 °C (with and without 24 h intermediate storage at room temperature before cooling)
180 days of storage at −20 °C (without 24 h intermediate storage at room temperature before cooling)
7 days of storage at −60 °C (with and without 24 h intermediate storage at room temperature before cooling)
The loading history is described as follows: Each transient thermo-mechanical coupled simulation run is divided into multiple load cases and individually composed of multiple increments:
Container closure with a defined load (50 increments)
Bordering the aluminum cap (simplified simulation, to “conserve” the initial state at room temperature, 10 increments). Optional: Intermediate storage at room temperature for 24 h
Cooling down the container from room temperature (23 °C) to storage temperature within 1 h (300 increments)
Storing the container for a defined duration at a defined temperature (200 increments for 7 days, 600 increments for 180 days)
Heating up the container to room temperature (23 °C) (100 increments)
Storing the container at room temperature (23 °C) for 3 h (100 increments)
In total, each simulation run includes 760 (7 days), 960 (8 days with intermediate storage at room temperature), and 1160 (180 days) nonlinear simulation steps, respectively.
Additionally, the following parameters were varied (assembly simulation):
Geometric tolerances (minimum/maximum overlap between rubber stopper and vial)
Container closing force:
12 N/40 N (default)/112 N for 13 mm vial neck
18 N/40 N (default)/125 N for 20 mm vial neck
Rubber stopper material properties:
Formulation 1 (F1) (default)
Formulation 2 (F2)
For the 13 mm neck size, there are six different variations and for the 20 mm neck size, there are an additional six different variations (Table I).
Assembly Simulation Scenarios for 13 mm Neck Size and 20 mm Neck Size
Container closure (capping) was conducted at room temperature. The reference calculations for 13 mm and 20 mm neck size include 7 days cooling at −20 °C after 1 day storage at room temperature after container closure. The −60 °C simulation results were used to predict the break-loose temperature (Tb), which is defined as the temperature at which the container tightness is lost (10). A summary of the simulated scenarios can be found in Table II.
Summary of Simulated Scenarios
The influence of mesh density on the contact normal stress was also analyzed (results not shown). Due to rotational symmetry, the serum stoppers are simulated with 2D-axisymmetric models allowing a FE mesh density (0.1 mm for a 13 mm neck size, 0.15 mm for a 20 mm neck size). The transient thermo/mechanical simulations were run with approximately 4000 nodes and elements.
There are several model versions for the verification of the mesh convergence: coarse mesh (density 0.3 mm), medium mesh (density 0.15 mm), fine mesh (density 0.075 mm). The results of every FE simulation depend on the number of elements in the model. The convergence study confirmed that an appropriate mesh was chosen for the studies (medium mesh density). Coarser meshes deliver insufficient mechanical stresses, as the models are too stiff. On the other hand, finer meshes tend to behave more smoothly and deliver higher normal contact stresses, that is, with finer meshes, the result quality increases. For locations with higher gradients, convergence depends on multiple factors, such as local contact with friction influence as well as local temperature distribution. However, finer meshes encompass tremendously long calculation times and in regard to computing time and the quality of the results, a compromise had to be found.
3. Results and Discussion
3.1. Evaluation Concept for Tightness
The following data were plotted to evaluate the container sealing behaviour:
contact status (1 = touching, 0 = no contact)
contact normal stress (N/mm2) as a measure of tightness
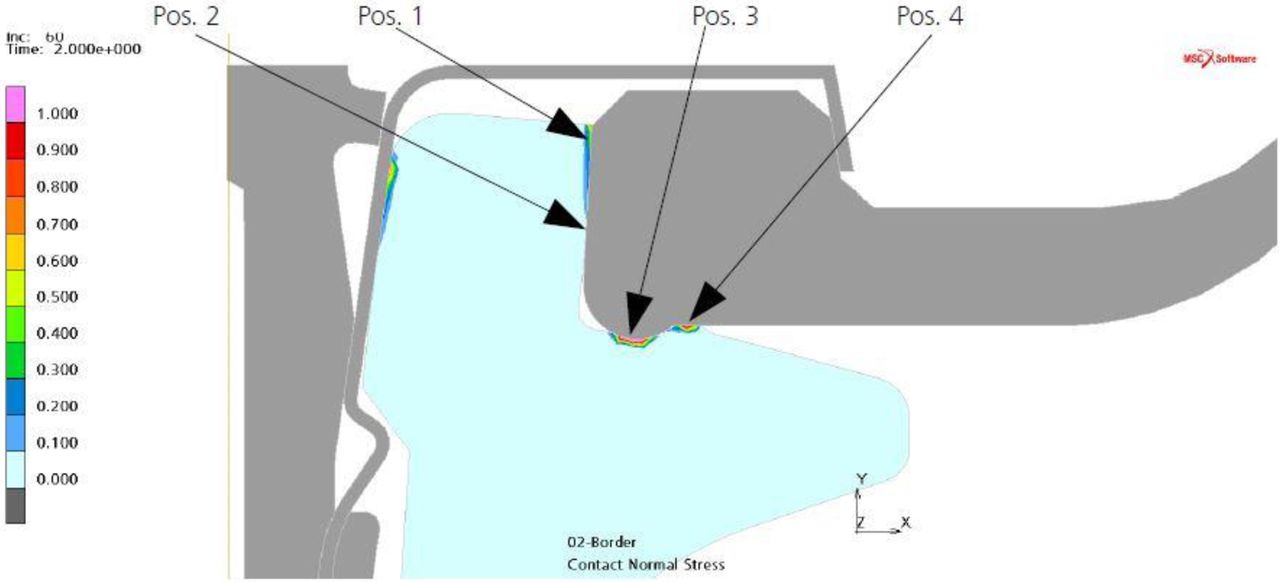
The data were plotted in a time-dependent manner in combination with time-dependent temperature data. A detailed evaluation of the contact normal stress is available for four positions along the sealing path, namely Pos.1, Pos. 2, Pos. 3, and Pos. 4. Based on the contact status at the four measured positions, the CCS tightness is determined. The CCS tightness acceptance criteria correspond with the situation when contact at the last of all four evaluation positions is lost.
3.2. Simulation Results
3.2.1. Contact Normal Stress of 13 mm Vial Neck:
3.2.1.1. Influence of 1 Day Storage Time at Room Temperature:
After 1 day of storage at room temperature, the contact normal stress for the F1 rubber stoppers is reduced to approximately 25% of its initial value after container closure (Table III).
Comparison of Contact Normal Stresses for Simulated Versions Immediately after Container Closure at 23 °C and after 1 Day of Storage at 23 °C (13 mm Neck Size)
The F2 version of the same rubber stopper geometry under identical conditions shows a much better behaviour regarding relaxation than does the F1 version. After 1 day of storage at room temperature, the contact normal stress is reduced to approximately 60% of its initial value (Table III).
3.2.1.2. Influence of Storage Time at Low Temperatures:
The contact stresses at the depicted positions (Figure 2, Pos. 1–4) decrease during the cooling period due to thermal shrinkage and ongoing relaxation processes in the sealing material. However, thermodynamic equilibrium is inhibited due to the prevailing low temperature (−20 °C). Thus, reaching thermodynamic equilibrium takes some time (longer than holding time). A slow but small increase of contact stresses during the frozen state was observed. Therefore, the minimum contact stress in the frozen state was chosen for the evaluation of all results.

Contact normal stress (N/mm2) after container closure. This is the common initial state for the simulation models with 40 N closing force, 13 mm neck diameter, mean geometric tolerances, F1 (rubber formulation).
Furthermore, the storage duration (7 days vs. 180 days under the same conditions) does not affect the tightness of the container (Table IV), as there was no difference between the contact stresses after thawing when samples were stored at −20 °C for either 7 or 180 days. This can be expected due to the elastic properties of the rubber, which seems not to be affected by the long-term storage time. The influence of 1 day of storage at room temperature before freezing the container is more important. Here, approximately 20% higher contact normal stresses after thawing were observed when the sample was frozen immediately after container closure.
Evaluation of Minimum Contact Stress in Frozen Conditions and Comparison of Storage Duration (13 mm Neck Size)
3.2.1.3. Influence of Closure Force and Geometric Tolerances:
The influence of the closure force on the contact normal stresses is not linear. A reduction from 40 N to 12 N (−70%) does not result in a general reduction of contact normal stresses and the contact normal stresses are shifted closer to the center (Pos. 2 to Pos. 4), while contact on the outer diameter (Pos. 1) is lost. With an increase of the contact normal force to 112 N (+180%), the contact normal stresses rise particularly at the outer zones (Pos. 1 and 2) while the contact stress in the vial neck (Pos. 4) is reduced (Table V).
Contact Stress after Thawing (13 mm Neck Size)
The geometric tolerances (minimum/maximum overlap between vial and rubber stopper) have a significant influence. A minimum overlap (with a 40 N closure force) shows approximately half the contact normal stresses as the nominal geometry parts (Table V).
Because the container cannot be closed within the simulation with a 40 N closure force when the maximum overlap occurs, the closing force was increased to 65 N for the simulation with a maximum overlap. Overall, the version with a maximum overlap and closure force of 65 N is the only combination that exhibits tightness at all four positions throughout the whole simulation scenario (closing, 1 day at 23 °C, cooling to −20 °C, stored 7 days at −20 °C, thawing, and storing 3 h at 23 °C).
The better relaxation behaviour of F2 compared with F1 can be confirmed for all simulation states. The contact for all four evaluated positions is kept throughout the whole simulation and the contact normal stresses are more than doubled, compared to the F1 version of the rubber stopper (Table V).
3.2.2. Contact Normal Stress of 20 mm Vial Neck:
3.2.2.1. Influence of 1 Day Storage Time at Room Temperature:
After 1 day of storage at room temperature, the contact normal stress for the F1 rubber stoppers is reduced to approximately 25% of its initial value after container closure (Table VI).
Comparison of Contact Normal Stresses for Simulated Versions Immediately after Container Closure at 23 °C and after 1 Day of Storage at 23 °C (20 mm Neck Size)
The F2 version of the same rubber stopper geometry under the same conditions shows a much better relaxation behaviour than the F1 version: after 1 day of storage (at room temperature), the contact normal stress is reduced to approximately 60% of its initial value.
3.2.2.2. Influence of Storage Time at Low Temperatures:
The contact stresses at the depicted positions (Figure 3, Pos. 1–4) decrease during the cooling period due to ongoing thermal shrinkage and relaxation processes of the sealing material, and a slow but small increase of contact stresses during the frozen state can be observed (Table VII). Therefore, for all result evaluations, the minimum contact stress in the frozen state was chosen.
Contact normal stress (N/mm2) after container closure. This is the common initial state for the simulation models with 40 N closing force, 20 mm neck diameter, mean geometric tolerances, F1 (rubber formulation).
Evaluation of Minimum Contact Stress in Frozen Conditions (20 mm Neck Size)
The performance of 20 mm diameter neck stoppers is similar to that of the 13 mm stoppers. This indicates that the stopper size has minimal influence.
3.2.2.3. Influence of Closure Force and Geometric Tolerances:
The geometric tolerances (minimum/maximum overlap between the vial and rubber stopper) have a significant influence. A minimum overlap (with a 40 N closure force) shows approximately half the contact normal stresses as nominal geometry parts (Table VIII), as observed for the 13 mm neck.
Contact Stress after Thawing (20 mm Neck Size)
Because the container could not be closed within the simulation using a 40 N closure force when maximum overlap occurs due to geometric reasons, the closing force had to be increased to 65 N for the simulation with maximum overlap. Overall, the version with maximum overlap and 65 N is the only F1 combination, with tightness at all four positions throughout the whole simulation scenario (closing, 1 day at 23 °C, cooling to −20 °C, storing 7 days at −20 °C, thawing, and storing 3 h at 23 °C).
The better relaxation behaviour of F2 compared with F1 can be confirmed for all simulation states. The contact for all four evaluated positions is kept throughout the whole simulation and the contact normal stresses are more than doubled, compared to the F1 version of the rubber stopper (Table VIII).
In this paper, all statements corresponding to tightness rely on discrete nodal positions, where contact normal stresses are measured during the simulation. This is obviously a conservative approach as the remaining small contact areas could still exist when all discrete positions show a loss in contact.
3.2.3. Break-Loose Temperature:
Node-Based Procedure:
By following the node-based procedure or nodal approach, the break-loose temperature is evaluated with the cooling simulations to −60 °C after 1 day of intermediate storage at room temperature. The break-loose temperature corresponds to the ambient temperature of the sample, when contact at the last of the four evaluation positions is lost. The temperature value is then taken from one of the four points.
With this approach, the break-loose temperature twice depends on mesh convergence:
Contact normal stress at a certain location (contact could be lost, while a neighboring node still is in contact).
Transient temperature distribution. During cooling, temperature is never constant within the rubber stopper—neither relating to the position nor relating to time.
Therefore, this procedure is not robust and was not followed as the final choice to calculate the break-loose temperature.
Force-Based Procedure:
An alternative method (force-based approach) integrates the contact normal forces to the remaining axial closing force between vial and aluminum cap. With a numerical integration of the contact normal stresses across the elements in contact, the resulting force on the cap can be calculated. The given break-loose temperature ranges are limited by minimum and maximum nodal temperatures in the rubber stopper. Break loose occurs during cooling the system down to −60 °C, while the system is neither in thermal nor in viscoelastic equilibrium.
Table IX summarizes the break-loose temperatures for 13 mm and 20 mm serum stoppers depending on vial neck size and capping force by following the force-based approach as well as the nodal approach for comparison purposes.
Break-Loose Temperatures in 13 mm and 20 mm Serum Stopper Depending on Vial Neck Size and Capping Force (Mean Geometric Tolerances) by Following the Force-Based Approach and the Nodal Approach
The difference between the two procedures is more important for the 13 mm neck size. The 20 mm neck size evaluation points for the nodal approach (Figure 3) seem to be more representative for the system than the 13 mm neck size evaluation points (Figure 2). The force-based approach was better suited to calculate the break-loose-temperature based on a better correlation of the simulated values with laboratory data for the 13 mm neck size, as described in the next section. The plots below show temperature distributions at the time when the force-based approach break-loose criteria were met (Figure 4).
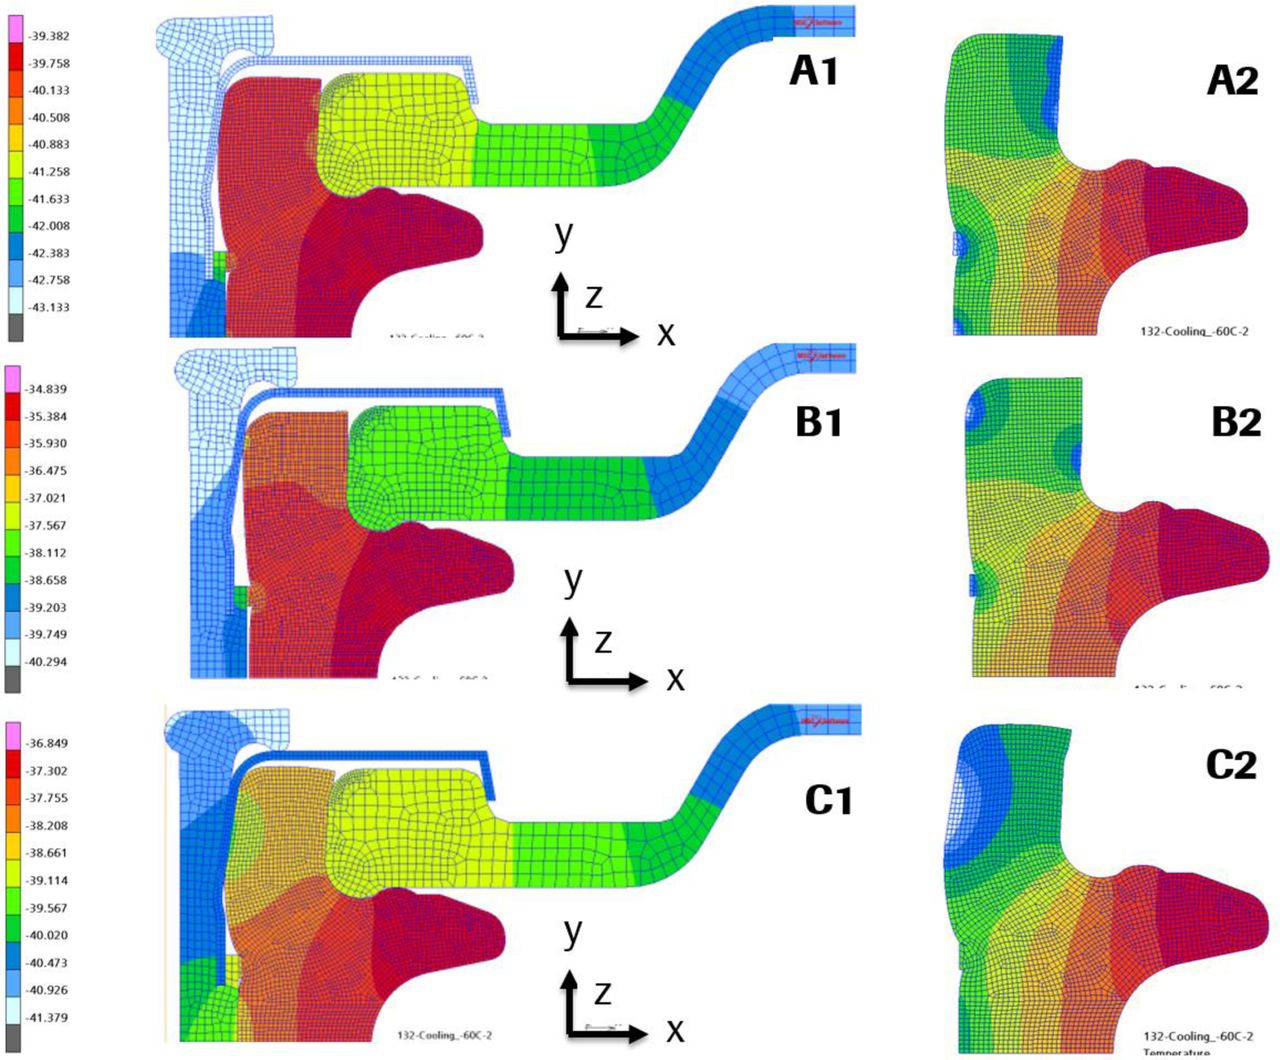
Temperature distribution in the system (upper panel) and in the stopper (bottom panel) when overall axial contact force is <0.1 N, for 13 mm vial neck size with different simulated closing forces: (A) 40 N, (B) 12 N, (C) 112 N.
3.2.4. Correlation of FE Simulations with Laboratory Data:
A summary for the comparison of experimental data obtained in the laboratory to the FE simulations results is shown in Table X.
Correlation of Laboratory Data to FE Simulation Results
The comparison of FE simulation data to laboratory data was based on a tightness concept. In the laboratory, the CCI was evaluated at low temperature by the ThermCCI method (5, 10). The following parameters were identified as having an influence on the CCS tightness at low temperatures, based on both laboratory data as well as on FE simulation results:
Storage time: Regardless of the storage time, 1 day or 7 days, tested CCSs are tight at −20 °C and not tight (unpredictable behaviour) at −60 °C.
Storage temperature: Tested CCSs are tight at −20 °C. At −60 °C the behaviour is unpredictable and vials show leakage.
Neck diameter: The break-loose temperature varies slightly with stopper size, although it is below −20 °C for all tested CCSs. This could be due to slight design differences between 13 mm and 20 mm neck size.
Container closing force (simulations): At −60 °C, the tested CCSs were not tight. At −20 °C and at room temperature, vials with a 13 mm vial neck size exhibited no impact of container closing force on helium leakage rate in the range from 10 N to 110 N for serum stoppers. At −20 °C samples with a serum stopper and a 20 mm vial neck showed leaking vials at container closing force values of approximately 15 N. The container closure force ranges studied in the FE model were derived from the parameters obtained from laboratory experiments (18), which represent typical ranges used in commercial manufacturing, as well as worst-case values based on the ability of the CCS to maintain the pCCI (20).
Break-loose temperature (Tb): In the case of the 13 mm neck size, a correlation was found between laboratory results and FE simulations when the force-based approach was used, whereas for the 20 mm neck size the correlation to real laboratory data was not as successful. However, a direct comparison of the Tb FE simulation results with experimental data is still difficult because the quality of thermal and viscoelastic equilibrium is difficult to measure, as the simulated break-loose temperatures are evaluated during the cooling process, when neither thermal nor viscoelastic equilibrium is present. For this reason, and in order to find a correlation and a suitable simulation model for it, two different approaches (nodal or force-based) were investigated to simulate the Tb. In conclusion, due to the dynamics in the simulated system, the force-based approach may be more suitable to compare simulation results with measurement data. On the other hand, the nodal approach (based on local contact normal stresses), expanded to a continuous path along the vial flange, could be more reliable for a simulated system in thermal and viscoelastic equilibrium. To achieve such results by applying the nodal approach, a solution could be to run multiple simulations with a thermal equilibrium in the expected range of the break-loose temperature. FE simulation revealed that other parameters, such as rubber stopper material or geometric tolerances of CCS components, also play a role in the tightness of the system at low temperatures, as hypothesized.
Hence, the laboratory experiments can help confirm the FE simulation results, and vice versa. The results here also confirm how FE simulations can be used to predict the sealing behaviour of CCSs under frozen conditions, without the need to perform lengthy and costly laboratory experiments.
Thus, the application of this powerful predictive tool is evident. As an example, it was shown that by changing the dimensions of the components in a certain range, differences in tightness behaviour under frozen conditions can be expected.
Hence, simulations allow study parameters that cannot be experimentally investigated otherwise.
4. Conclusions
Given that the FE analysis is based upon fundamental material properties, the viscoelastic material properties were derived from DMTA experimental data and an FE model was developed. The appropriateness of the mesh size density was confirmed. In general, finer meshes tend to behave more smoothly and deliver higher contact normal stresses. Additionally, a concept for tightness (contact-based approach) was developed, as well as a concept to calculate break-loose temperatures (force-based concept). Several scenarios were simulated and the model was validated with experimental data. The following was demonstrated:
A 13 mm stopper performs better than a 20 mm stopper, in what concerns lower break-loose temperatures. However, the behaviour is similar with regards to the effect of storage time influence.
The influence of the closing force on the contact normal stress is not linear.
The geometric tolerances (maximum/minimum overlap vial/stopper) have significant influence.
F2 rubber stopper shows better relaxation behaviour than F1.
The CCSs were tight when stored at −20 °C under identified standard middle- and upper-range container closing parameters. The CCSs were not tight at −60 °C, regardless of the rubber stopper formulation.
It was also concluded that there is a good overall correlation between the FE model and the experimental data regarding the sealability of rubber stoppers under frozen conditions. Hence these simulations can be used as a predictive tool. FE analysis can help obtain information where measurements are not possible or too laborious, and it enables the separation of the influence of material properties from design impacts.
Future efforts are planned to focus on investigating the influence of rubber stopper lamination with coating, such as ethylene tetrafluoroethylene (EFTE) or Teflon™ fluorinated ethylene propylene (FEP). In addition, the behaviour under cycling conditions, such as multiple freeze-thaw cycles, would be examined.
Conflict of Interest Declaration
The authors declare that they have no competing interests.
Acknowledgments
The authors would like to acknowledge Dipl. Ing. Martin Zueger (pinPlus AG, Bern, Switzerland) for his work on the structural simulations. Thanks to Dr. Michael Adler and Dr. Silke Mohl (F. Hoffmann, La Roche Ltd.) for their constructive feedback and to Sandra Gandré and Helen Brown (F. Hoffmann, La Roche Ltd.) for proofreading.
- © PDA, Inc. 2018


