
Abstract
To ensure successful scale-up of continuous processing to large-scale production, it is necessary to seamlessly incorporate viral testing and clearance/inactivation into representative small-scale models. For the first time, a session devoted to the adaptation of standard viral clearance/inactivation unit operations to continuous processing was held at the Viral Clearance Symposium (VCS), with an emphasis on design of valid small-scale models. In this session, the presentations and subsequent discussions identified challenges as well as pathways forward for these emerging technologies. In the first two talks, two different strategies on how to validate continuous low pH viral inactivation (VI) were discussed, focusing on molecule stability and XMuLV inactivation kinetics in the lower residence times of continuous manufacturing, in addition to mathematics-based modeling of continuous viral inactivation processes. The third talk in the session presented a strategy to adapt weak anion exchange chromatography to a continuous manufacturing process by taking advantage of the elution pulses from bind and elute chromatography. The final and fourth talk provided data from novel spiking strategies in consideration of the high, but fluctuating, product titers in the context of continuous flow encountered in continuous manufacturing processes.
LAY ABSTRACT: To ensure successful scale-up of continuous processing to large-scale production, it is necessary to seamlessly incorporate viral testing and clearance/inactivation into representative small-scale models.
For example, in this session, strategies to validate continuous low pH viral inactivation were discussed.
In addition, data from novel spiking strategies in consideration of the high, but fluctuating, product titers in the context of continuous manufacturing processes were presented.
- Viral clearance
- Continuous processing
- Small-scale model
- Chromatography
- Virus inactivation
- Virus-spiking strategy
Session Background and Overview
To ensure successful scale-up of continuous processing to large-scale production, it is necessary to seamlessly incorporate viral testing and clearance/inactivation into representative small-scale models. For the first time, a session devoted to the adaptation of standard viral clearance/inactivation unit operations to continuous processing was held at the Viral Clearance Symposium, with an emphasis on the design of valid small-scale models. In this session, the presentations and subsequent discussions identified challenges as well as pathways forward for these emerging technologies. In the first two talks, two different strategies on how to validate continuous low pH viral inactivation were discussed, focusing on molecule stability and Xenotropic Murine Leukemia Virus (XMuLV) inactivation kinetics in the lower residence times of continuous manufacturing, in addition to mathematics-based modeling of continuous viral inactivation processes. The third talk in the session presented a strategy to adapt weak anion exchange chromatography to a continuous manufacturing process by taking advantage of the elution pulses from bind and elute chromatography. The final and fourth talk provided data from novel spiking strategies in consideration of the high, but fluctuating, product titers in the context of continuous flow encountered in continuous manufacturing processes.
Participants' Contributions
Facilitating Continuous Low pH Viral Inactivation Using Lower pHs and Shorter Hold Times
A Just Biologics/Merck & Co., Inc., Kenilworth, NJ, USA Collaborative Study, Presented by Lisa Connell-Crowley
To facilitate a fully continuous process, the low pH viral inactivation (VI) unit operation requires conversion from the traditional 60-min static hold step in a vessel to a continuous, in-line pH titration with a set residence time in a device such as a coiled-flow reactor. Residence time in a continuous operation is directly proportional to the size and volume of the coiled-flow reactor, and, thus, lower residence times will reduce reactor size and cost. As a first step to designing a continuous low pH (viral inactivation) process, Merck & Co., Inc., and Just Biotherapeutics evaluated molecule stability and XMuLV inactivation at lower pHs and shorter inactivation times to determine a window of operation for continuous low pH VI. A review of inactivation kinetics for low pH VI data sets (1) suggests that full XMuLV inactivation is achieved at pH 3.6 within 3 min for most conditions tested, so pH values below 3.6 were evaluated in these experiments.
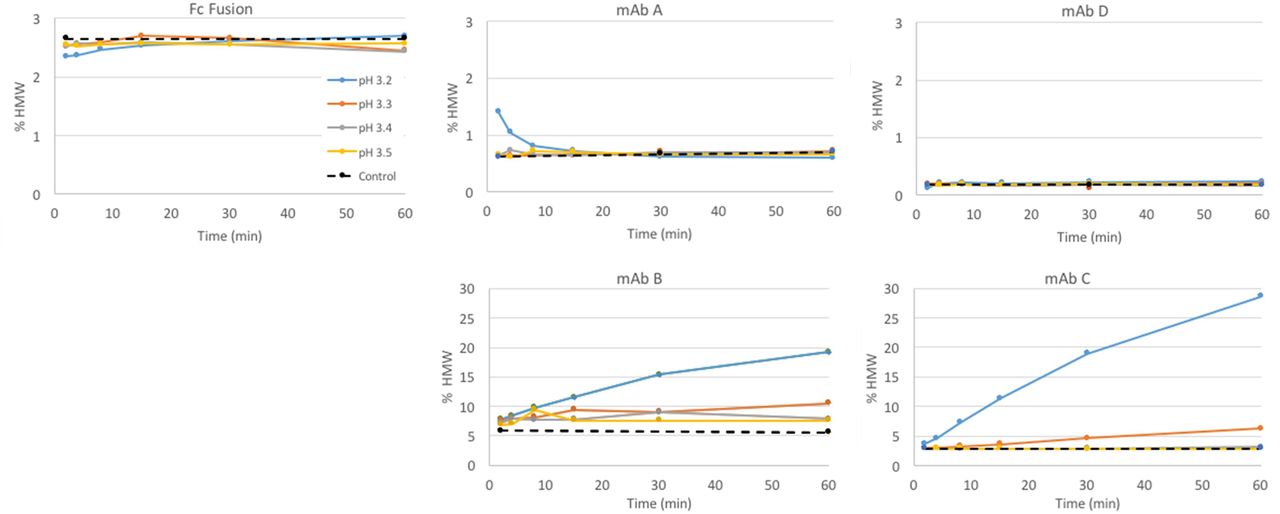
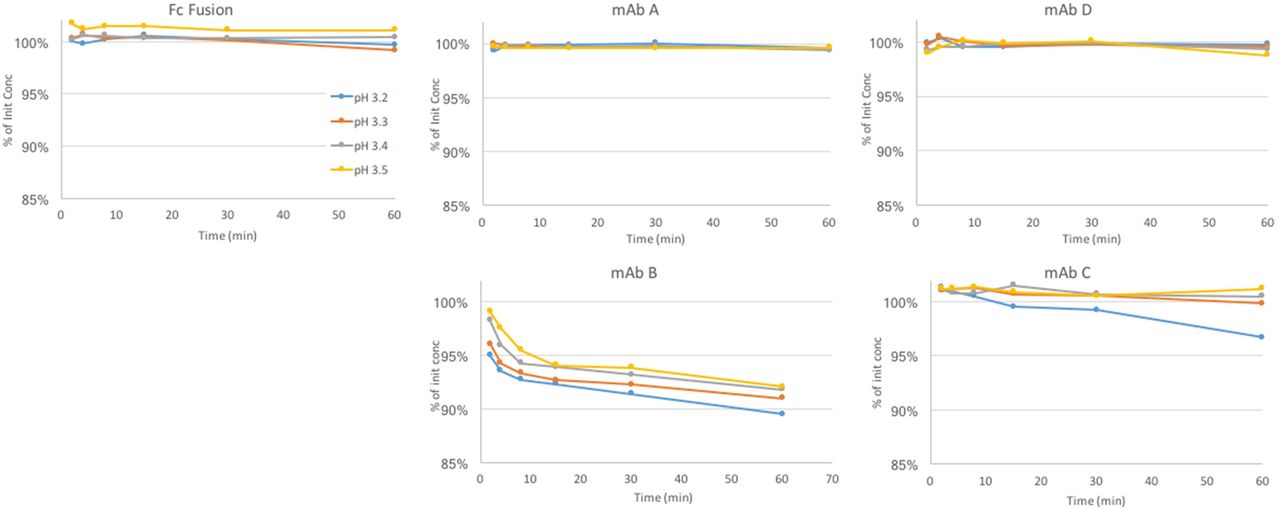
Three Merck & Co., Inc. molecules (monoclonal antibody [mAb] A–C) and two Just molecules were tested according to the design in Table I. mAb B was also tested in 2× dilution (with 20 mM acetate) to determine if lower protein concentration would give better results. Aggregation data and product loss data during low pH hold for each molecule are shown in Figures 1 and 2. Most of the molecules did not show any yield loss; mAb C had slight yield loss at the lowest pH, and mAb B had significant yield loss across all pH. MAb A, Fc fusion, and mAb D did not show significant High Molecular Weight (HMW) change, even at the lowest pH and the longest time. MAb C showed only a significant HMW change at the lowest pH, whereas mAb B showed significant change across all pH and time points. A 2× dilution of mAb B did not impact the yield loss; however, it did reduce the HMW increase.
Design for Low pH and XMuLV Inactivation Experiment(s)

Aggregation at low pH as measured by Size Exclusion Chromatography (SEC). Four antibodies and one Fc fusion were held at pH 3.2–pH 3.5 for up to 60 min. Control (black dashed line): material held at starting pH.

Product loss at low pH as measured by percentage of initial protein concentration. Four antibodies and one Fc fusion were held at pH 3.2–pH 3.5 for up to 60 min. Control (black dashed line): material held at starting pH.
A low pH viral clearance study was performed at a contract research organization (CRO) by use of mAb A and model virus XMuLV as described in Table I. Three pH conditions were tested in duplicate, with time-point sampling starting at 0.5 min out to 10 min. The study was performed in a 15°C water bath to test the worst-case inactivation kinetics (i.e., lowest ambient [15–25°C] temperature). The amount of acid and base required to reach the low pH set point and the neutralized condition was predetermined to ensure accuracy of the time points taken (results are shown in Table II). All conditions and time points showed good clearance, with the higher pH conditions showing a few samples with a low level of virus detection.
XMuLV Inactivation Kinetics at Each pH (*Values Where Low Level of X-MuLV Detected by the Plaque Assay)
The results of the low pH stability testing indicate that most molecules are amenable to lower pH hold at hold times of ≤15 min. Some molecules, such as mAbs B or C, may be too sensitive for a low pH of ≤3.5, and may need to follow a traditional Batch VI hold at pH of ≥3.6 with 30- to 60-min hold time. The viral inactivation study performed with XMuLV confirmed the previously published work by Chinniah et al., (1), and showed that fast inactivation kinetics are observed at pH of ≤3.6. Based on the results, a pH of 3.4 for ≤6 min would provide robust viral inactivation for a continuous process using a continuous flow device that would allow for good mixing. It is expected that a viral validation study to support continuous low pH VI would be performed in batch mode, and the large-scale VI system would have an established “integrity test” of the continuous reactor device to establish the minimum residence time.
Viral Clearance for Continuous Viral Inactivation
A BI/Pfizer Collaboration Presented by Raquel Orozco
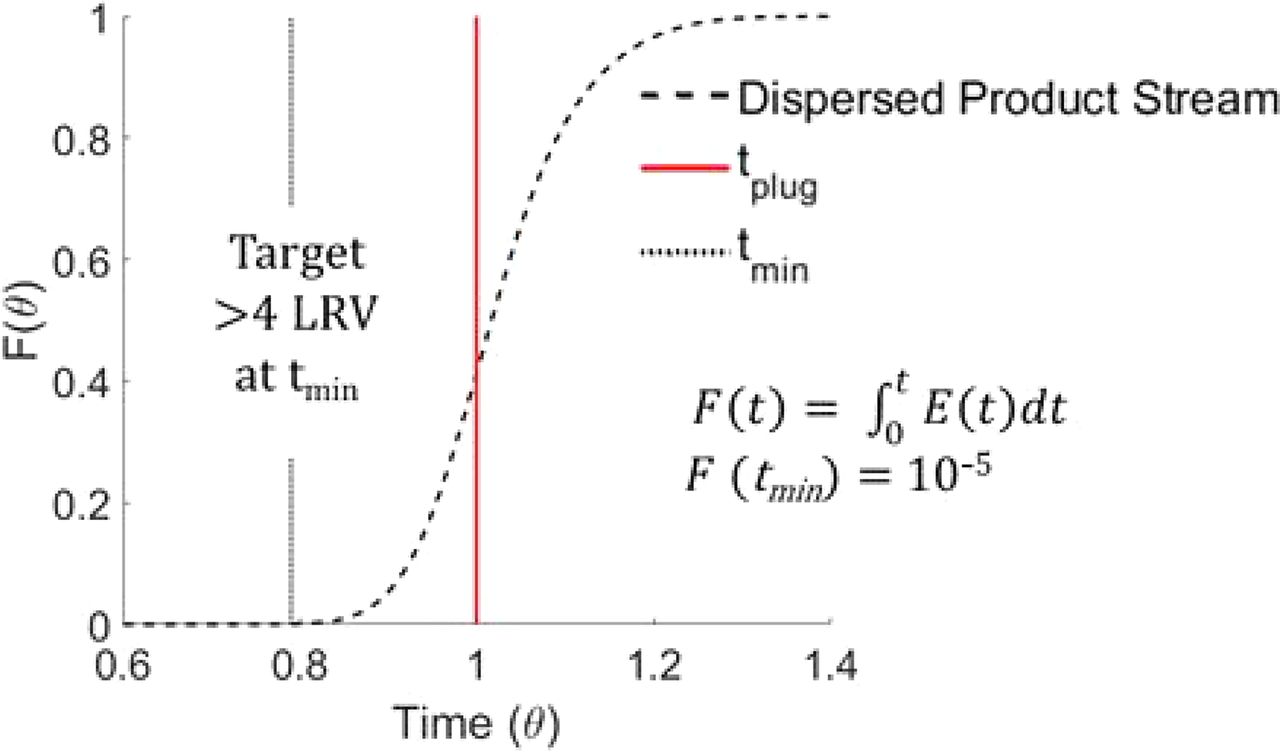
Continuous low pH viral inactivation has been considered by Boehringer Ingelheim (BI), Pfizer, and other companies that are investing in integrated processing. In continuous viral inactivation, a critical parameter that poses a new challenge is the definition of the exact incubation time of the product stream. In a continuous space, the concept of time does not translate solely in the product flow rate and incubation volume, as dispersion effects should also be accounted for. To address dispersion, the time when the first fluid element exits the tubular chamber should be considered to correctly size the tubular incubation reactor and ensure proper viral clearance. Here we define time as the minimum residence time (tmin) that should meet the following requirements (see Figure 3 for illustration):
>4LRV (log reduction value) is achieved at time tmin in a batch process.
The time when 10−5 particles are allowed to exit the tubular reactor or F(tmin) = 10−5.

Illustration of a residence time distribution for a disperse product stream. The inactivation time in a continuous space should be equivalent to a minimum residence time, tmin, where F(t) = 10−5 and the time when >4LRV are achieved in a batch setting.
Previously, we characterized tmin for a novel, scalable, and sturdy tubular reactor design also known as JIB that can serve as an incubation chamber for a process capable to produce >1 kg of product (2, 3). This design provides a narrow residence time distribution compared with other previously published designs (1). The following formula is used to size a tubular reactor and account for dispersion:
 Where Q is the process flow rate and tmean is the mean residence time. We found that the JIB has a ∈ = 1.05, meaning that it has to be about 5% bigger than a plug flow reactor to meet the tmin requirements.
We propose to use the above concepts and integrate them to a traditional “batch” viral clearance validation approach to serve as a platform for continuous low pH virus inactivation. A batch approach is preferred, as a continuous scale-down approach would be more time- and resource-constraining in addition to technically more challenging. For the batch validation approach, we propose to follow the subsequent steps:
Establish a hold time or tmin that will achieve >4LRV. Consider worst-case operating conditions for concentration, pH, temperature, and buffer species.
Use the desired hold time from Step 1 to size the commercial tubular incubation design accordingly.
Use the commercial design and desired process flow rate and generate an F(t) curve with enough sensitivity to read down to F(tmin) = 10−5. A phage can be used as a tracer for this purpose. This curve will become the baseline to compare against a residence time distribution that can be generated right before or during processing. The tmean, variance, and F(t) = 0.005 can be the parameters used to compare the baseline with the residence time distribution of the actual process.
It is our hope to normalize this approach across companies and make it the gold standard for viral clearance of continuous viral inactivation.
Viral Clearance for Continuous Anion Exchange Chromatography
A BI/Pfizer Collaboration Presented by Rob Fahrner
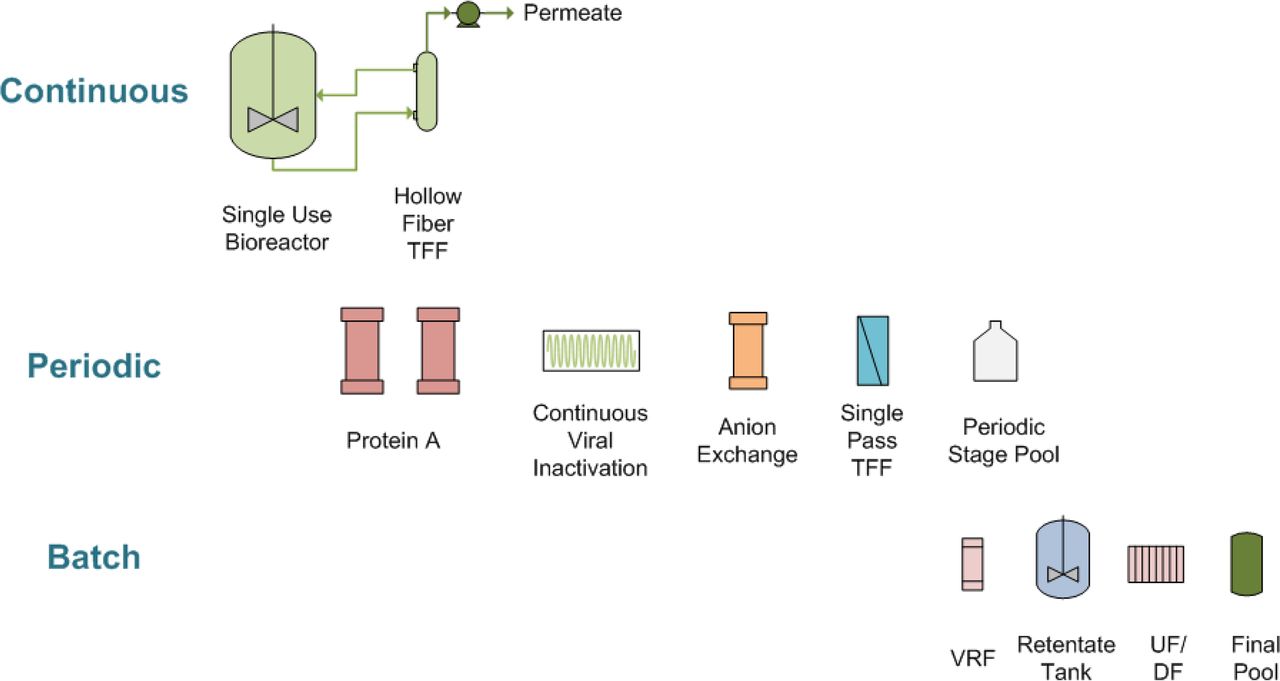
In many continuous downstream systems for mAbs, Protein A chromatography produces periodic peaks. The Pfizer/BI downstream process uses weak partitioning anion exchange chromatography following Protein A, and the weak partitioning column will be operated with a product peak moving through the column. The weak partitioning step is used for impurity removal as well as for viral clearance, and this presentation will examine strategies for validating viral clearance on weak partitioning chromatography operating with a nonhomogeneous load. The Pfizer-BI integrated manufacturing system has been developed as a hybrid of the following three stages, namely, continuous, periodic, and batch (Figure 4), during which the bioreactor permeate is loaded continuously onto one of two Protein A columns.

Diagram of the integrated manufacturing system, showing the three continuous, periodic, and batch stages.
During the continuous stage, the bioreactor permeate is continuously harvested by tangential flow titration (TFF) and is alternately loaded onto two 1-L Protein A columns, where the loading phase switches between the two columns and does not pause. During the periodic stage (which occurs every 2 to 12 h): after loading, the first Protein A column is eluted (while the second Protein A column is being loaded in parallel) and runs continuously through a low pH virus inactivation chamber; a 0.5-L weak partitioning anion exchange column; a single-pass tangential flow filtration (SPTFF) unit; in-line pH and conductivity conditioning; and is collected into a single-use mixing bag. While the product stream moves continuously through the periodic stage, each individual unit operation is taken offline when not containing the product and each is regenerated and sanitized in parallel with other unit operations, thus permitting significant flexibility for variable product streams and maximizing the periodic stage productivity. The periodic stage is then paused until the second Protein A column is ready for elution. There are no in-process holds during the periodic stage.
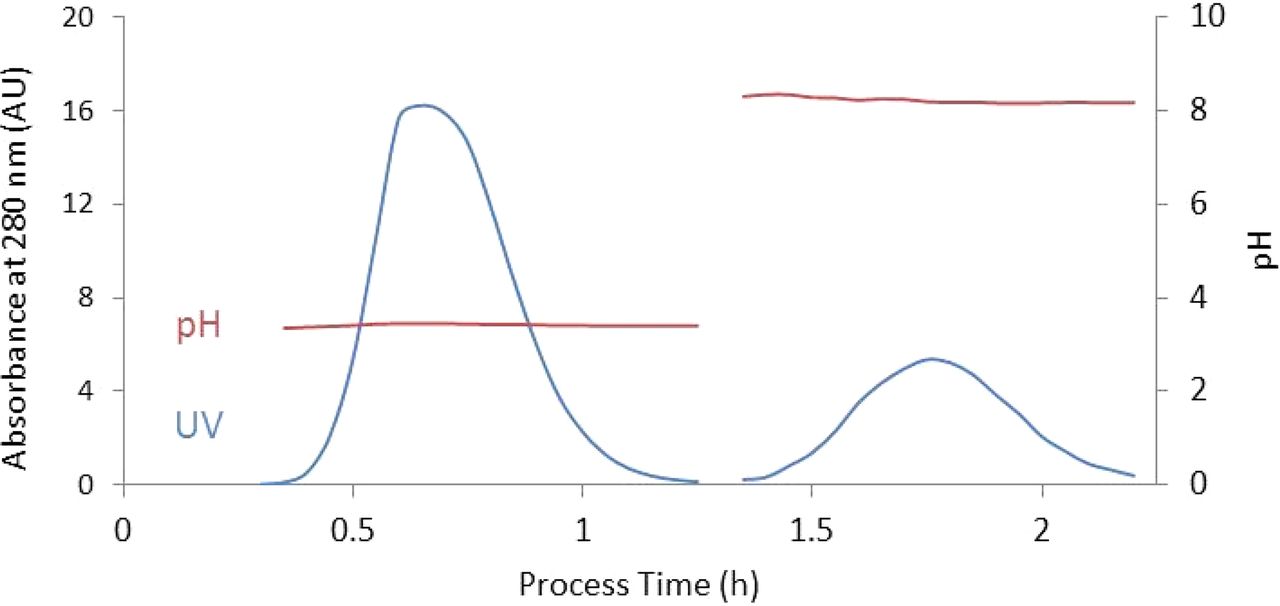
As a result of the mAb being eluted as peak from the Protein A column, this peak will move continuously through the periodic stage, including the anion exchange column (Figure 5). The variable mAb concentration is the main difference between a batch and a continuous anion exchange step. Because there is no in-process pool, a new method for viral clearance validation that is different than batch but can demonstrate viral clearance is needed.

Illustration of a peak moving through the downstream system. The Protein A column is eluted and the peak moves continuously through a low pH inactivation step, and then it is neutralized and moves through an anion exchange step.
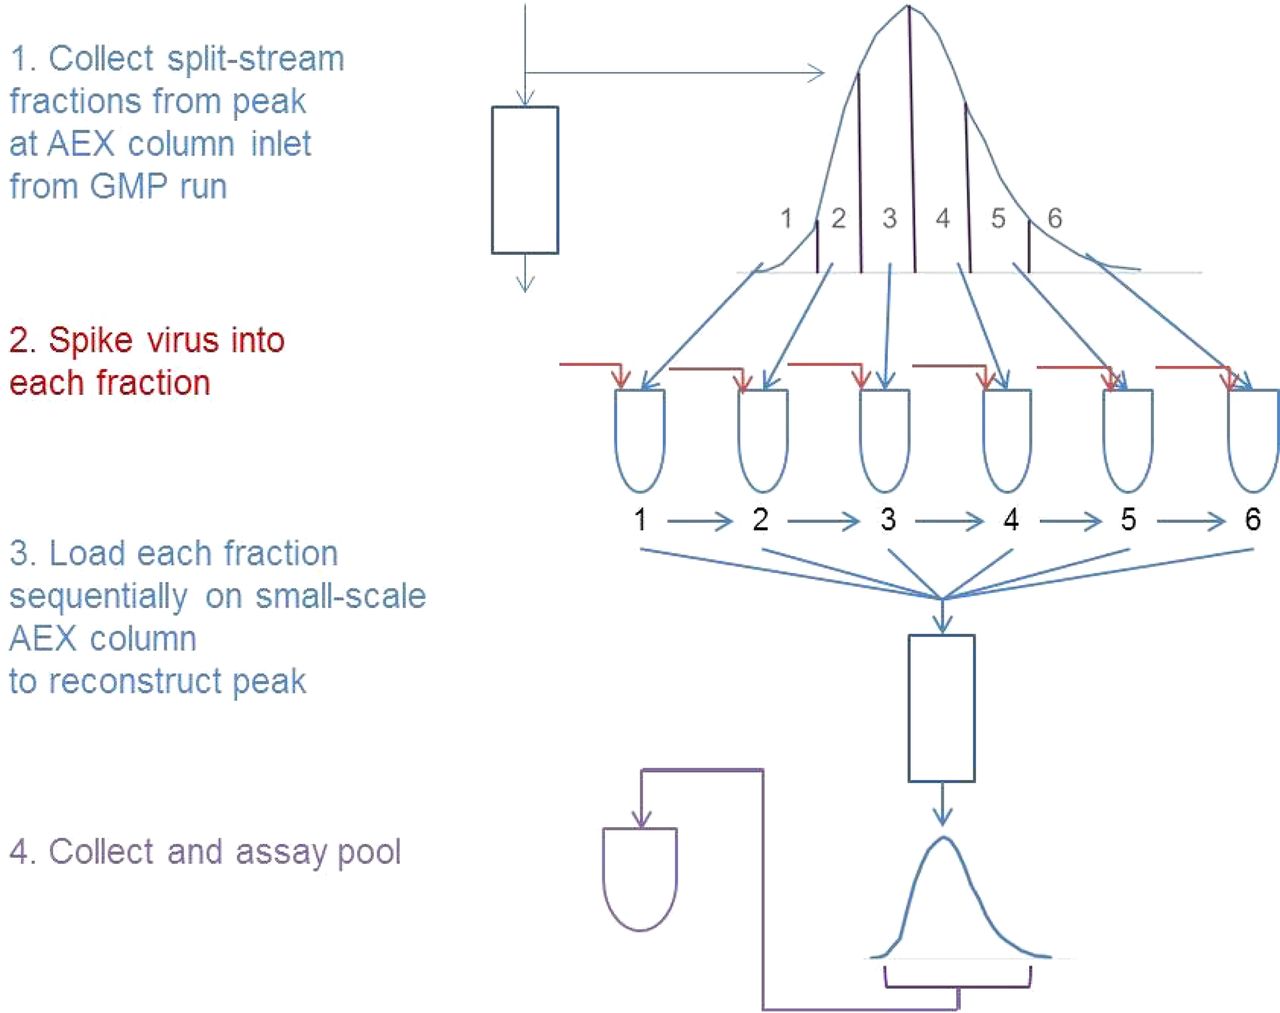
A simple and representative approach is shown in Figure 6. A pump and fraction collector is connected to the anion exchange column inlet (using sterile connections). The split-stream peak at the column inlet is then fractionated, likely into at least 6 and as many as 12 fractions across the peak at the inlet (Figure 6). Virus is spiked into each fraction on the basis of volume, similar to virus spiking for a batch process. Each fraction is then loaded sequentially onto a small-scale column that has been qualified as a scale-down model. This process reconstructs the peak as it moves into the small-scale column, duplicating very closely an actual peak moving through the column. The peak at the column outlet is collected and assayed for virus, and a viral clearance can then be calculated. The idea is that the peak is deconstructed by fractionation, virus is spiked into each fraction, the peak is reconstructed as it is loaded onto a scale-down column, and the eluted peak is collected at the column outlet and assayed for virus. This method allows viral clearance to be shown in a continuous process.

A proposed method for viral clearance validation on the anion exchange step.
Alternative Strategies for Viral Validation of a Continuous Viral Filtration Step
Presented by Eva Gefroh
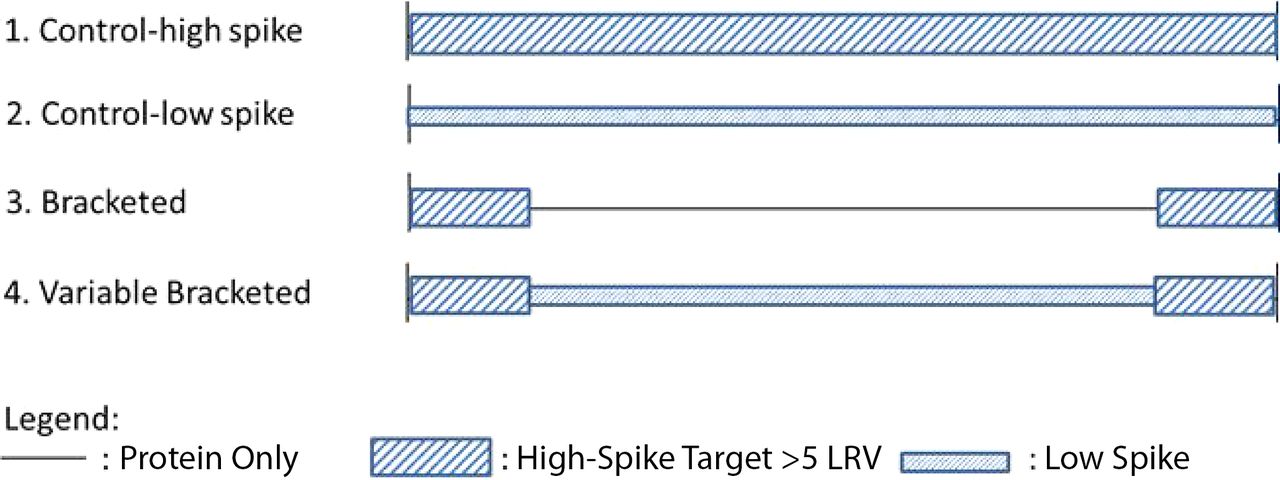
Continuous viral filtration processes present a challenge for viral clearance studies owing to the high product loadings that are specified for this type of process. Figure 7 illustrates the standard spiking strategies for showing viral clearance of the viral filtration step. Example 1 (Control High Spike in Figure 7) uses a fixed virus spike percentage; thus, the total amount of virus loaded on the filter is dependent on the volume of product loaded. In Example 2 (Control Low Spike in Figure 7), the total amount of virus loaded on the filter is fixed (e.g., 7–8 log10 TCID50 or PFU) regardless of the load volume. In both of these approaches, the virus is applied to the filter for the entire duration of the run. For a continuous viral filtration process where product loading is high, Approach 1 may not be acceptable because the fixed percent spike could result in an unacceptably high load of virus onto the filter and lead to premature, nonrepresentative filter fouling. One could also argue that loading the filter with such a high level of virus does not accurately represent a contamination event at this stage of the downstream process. Conversely, Approach 2 also may not be acceptable, because the percent virus spike will be lower for a high-loading, continuous VF process to maintain the fixed virus load. This could result in unacceptably low Log Reduction Value (LRV), depending on the virus stock and the loading parameters specified for the process, owing to reduced assay sensitivity at lower virus levels.

Alternative virus-spiking strategies for validation of the viral filtration step.
To circumvent these challenges, two alternative virus-spiking strategies were evaluated. Example 3 illustrates a bracketed spiking approach in which virus would be spiked into the load stream for a defined period at the start and end of product loading, and the product alone would be loaded in-between (Figure 7). This strategy can be likened to an integrity test approach, whereby the filter is probed for integrity by showing that it can retain virus at the start of the process and again at the end. This would also cover both worst-case filter-fouling scenarios for clearance: filter fouling by caking, which could result in virus passage at the start of the process but then virus retention later as the cake layer builds up; and filter fouling by pore plugging, which could result in virus passage at the end of the process because smaller pores are plugged and thus more flow is directed through larger pores. It is not expected that filter retention performance would be worse in the middle of the run than at the bracketed ends, provided the run is controlled within its set point parameters. The percent virus spike used to show clearance at the start and end of the process could be set sufficiently high to achieve the desired LRV target by limiting the volume to the amount required for virus assays.
Example 4 is a variation of Example 3, in which bracketed virus spiking is used at the start and end of the process, but virus spiking is also included in the middle of the process. In this case, the percent virus spike would be low for the middle of the process to show virus retention throughout the run, whereas the higher percent virus spike challenge used for the start and end of the process would be used to claim Log Reduction Value (LRV). This approach could be used to alleviate concerns about having virus present throughout the entire product loading, which presumably would better mimic an actual contamination event; however, this option adds complexity and is less preferred compared with Example 3.
To better illustrate these approaches, a viral clearance study was performed by Just Biotherapeutics at a CRO. Merck & Co., Inc. mAb A viral filter load material (10 g/L, pH 5.5) was loaded onto a Viresolve® Prefilter coupled to a Viresolve® Pro filter, and an in-line virus-spiking method was used to introduce the Mouse Minute Virus (MMV) model virus. The runs were performed on an ÄKTAexplorer, GE Healthcare (Uppsala, Sweden) loading for 24 h at 0.5 mL/min to a target loading of 2300 L/m2. The four conditions outlined in Figure 7 were tested according to the study plan outlined in Table III, and the actual executed runs with LRV results are shown in Table IV.
Alternate Virus-Spiking Strategies Viral Clearance Study Design (*Calculations Based on an Estimated Virus Starting Titer of 8.4 log10TCID50/mL)
Alternate Virus-Spiking Strategies Viral Clearance Study Results (*Based on Average of Bracketed Spikes (within 1 log)
For all four runs, the loading target was achieved with little to no pressure increase. No virus was detected in any of the filtrate pools. The actual amount of virus loaded on the filters was slightly lower than that loaded on the study design owing to the lower titer of the starting virus stock. Despite showing virus retention by the filter in all cases, LRV results illustrate the difficulty in achieving sufficiently high LRV with a Control Low Spike approach in contrast with the Control High Spike and the bracketed approaches. Although the Control High Spike arm did not show significant fouling before reaching the 2300 L/m2 loading target at 24-h run duration, it is expected that some products and process conditions would encounter premature fouling with this high level of virus spike. In addition, continuous viral filtration is moving in the direction of longer operation times (e.g., 3–5 days), to reduce cost by increasing filter utilization and to reduce operational and bioburden risk by minimizing operator manipulations and maintaining system closure. The data and rationale presented here support the bracketed spiking approach as an option that warrants further consideration and discussion with regulatory authorities.
Next Steps
The biotechnology industry is moving toward the adoption of continuous-mode manufacturing, both in individual unit operations and linked chains of unit operations. This shift from standard batch mode to a continuous mode of manufacturing introduced a need for novel approaches to standard viral clearance/inactivation technologies. The presentations in the “Ensuring Viral Safety in Continuous Processing” of the 2017 Viral Clearance Symposium outlined several viable strategies to adapt standard viral inactivation/clearance unit operations to continuous processing (CP) operations. Two of the four presentations in this session focused on viral inactivation (VI), a technology that shows great promise in adaptation to continuous flow. One of the major challenges to be overcome in adapting VI to a continuous-flow schematic is ensuring that the residence time of the entire product stream in either the low pH or solvent/detergent solution is maintained at a set point, as it is the most critical process parameter for this unit operation. The second presentation by Boehringer Ingelheim (BI) offered a calculation-based framework that ensures that a traditional Batch VI validation study design is still a representative model for a novel tubular reactor design.
The first presentation in the session by Just Biotherapeutics (JB) complements this observation by defining the minimum residence time that allows viral inactivation while maintaining product molecule integrity in the context of continuous-flow schemes. This study upheld many of the inactivation kinetics tenets shown previously in past Viral Clearance Symposia (VCS) presentations (e.g., precise pH control is truly critical). Even in worst-case conditions, the data presented showed at least >4 logs of XMuLV reduction in pH 3.4–3.6 in as little as 30 s in 20 mM sodium acetate, and with relatively little increase in aggregation in the product molecules. Overall, the first two presentations indicate that the viral inactivation unit operation can be designed to be robust in continuous processes.
The latter half of the CP session focused on two other unit operations often validated for viral clearance in batch processes: chromatography and viral filters. The third session presentation by Pfizer presents an example of a hybrid process, where the continuous upstream processes are linked to the final filtration steps. In this unique process, the semicontinuous product flow starts from a periodic Protein A chromatography unit operation to a virus filter, and then ion exchange chromatography before the final batch mode filtration and bulk storage. With no in-process holds, alternatives to traditional strategies to validate the virus filter and anion-exchange viral clearance are needed. Pfizer presented for discussion in this session, a novel validation strategy that relies on peak fractionation and pooling.
The final presentation in the session by Just Biotherapeutics (JB) presents potential strategies to overcome a significant hurdle for CP viral safety, viral filtration, and spiking strategies required to accurately model the high but oscillating product load levels that continuous processes will encounter. JB presented two alternative spiking strategies to model this fluctuation, namely, a bracketed and a variable bracketed approach for discussion during the session. Mechanistic data presented on the two spiking strategies showed that both strategies achieved at least five logs of MMV clearance for a 24-h processing time and a higher than typical throughput volume (2300 L/m2).
Overall, this session embodies the spirit of innovation, and it presents the new concepts and strategies to adapt traditional viral clearance/inactivation unit operations from batch mode into continuous processing. It also presented initial mechanistic experiments of viral clearance and safety assurances. Future work is needed to solidify the robust scientific evidence seen in past batch mode viral validation, but overall, this VCS session on Ensuring Viral Safety in Continuous Processing shows that conceptually, it is entirely feasible.
Disclaimer
This article reflects the views of the author and should not be construed to represent FDA's views or policies.
Conflict of Interest Declaration
The authors declare that they have no competing interests.
- © PDA, Inc. 2018


